Formation of a nylon-6 micro/nano-fiber assembly through a low energy reactive melt spinning process†
Renhai
Zhao
,
Xiao
Meng
,
Hongwei
He
,
Jinfa
Ming
and
Xin
Ning
 *
*
Industrial Research Institute of Nonwovens & Technical Textiles, College of Textiles & Clothing, Shandong Center for Engineered Nonwovens, Qingdao University, Qingdao 266071, China. E-mail: xning@qdu.edu.cn; Tel: +86-532-85953572
First published on 15th November 2021
Abstract
Commercial synthetic fibers of below 10 μm in diameter are usually unachievable with conventional melt spinning technology using high molecular weight polymers as the starting materials. The electrospinning process is capable of forming nanoscale fibers but is usually accompanied by the use of 80–90 wt% organic solvents, which greatly reduces the fiber yield and increases process cost as well as causing environmental concerns. We describe herein an approach using the caprolactam monomer as the main starting material for reactive anionic polymerization, propagating the degree of polymerization to achieve suitable melt viscosity for drawing into ultra-fine fibers using an electrostatic field force. The process temperature was well below that of the nylon 6 melting point. We demonstrate that through this low energy consumption integrated process, essentially all monomers can be transformed into the final nylon-6 micro/nano fiber assemblies which was unattainable from prior industrial or research processes.
1. Introduction
Nylon 6 is a commercial trade name for polycaprolactam, which refers to a polymer with repeating structural units of (–NH(CH2)5CO–) on the polymeric chain. Nylon 6 belongs to a category of well-established engineering thermoplastics with important commercial value, widely used in automobiles, industrial, and textile fields based on its excellent characteristics of toughness, wear-resistance, self-lubrication, wide working temperature range and so on.1 Paul Schlack in 1938 first invented the preparation of polycaprolactam by the polymerization of caprolactam and used it in fibers. The synthesis of nylon 6 is mainly achieved by caprolactam monomer batch polymerization which requires the initiation of water, cations and strong bases. According to the type of polymeric chain growth, it can be divided into hydrolysis polymerization, cationic polymerization and anionic polymerization mechanisms.1,2 It is well known that the anionic polymerization of CL occurs much faster (i.e., in a few minutes)3–6 than the hydrolytic polymerization, which takes about 12–24 h.7 Nylon 6 anionic polymerization is usually used in reactive extrusion processes. The first description of the anionic polymerization of CL can be traced back to 1941.8 After this, the synthesis method has been gradually applied to reaction injection molding,9–16 rotational centrifugal molding17,18 and monomer casting.19 The chemistry of the CL anionic polymerization has been widely studied due to its simple operation, fast reaction at reasonably low temperature (well below the melting point of nylon 6), high conversion rate, and the ability to achieve a high molecular weight.20–24Commercially, melt-spinning of thermoplastic polymeric fibers consists of the melting and extrusion of a molten viscous fluid, forcing the fluid through the tiny holes of spinnerets under high melt pressure and high temperature to form continuous filaments of the molten polymer, and then quenching and attenuating the filaments to the desired dimensions for (usually) further stretching in the solid state.25 The fibers thus produced are usually above 10 μm in diameter and can be wound up as continuous filament spindles, or sprayed out as a web such as in spun-bond and melt-blown in the nonwoven manufacturing field. Smaller dimension microfibers (such as micrometer or nanometer sized fibers) are not achievable with conventional technology and equipment due to their high melt viscosity. The conventional fiber spinning process is also an energy intensive, multi-step operation due to the high temperature involved, and the AC quenching required as well as the mechanical stretching and conditioning. For finer dimension fibers such as those with diameters below 1 denier (10+ μm), a high electrostatic field can be applied to polymer solutions with much lower viscosity to produce non-woven webs of ultrafine fibers, the diameters of which are in the range of a few hundred nanometers to micrometers, in a process known as electrospinning.26,27 Electrospinning has attracted great interest due to its simple and easy operation process, and the fine structural characteristics of its products.28–30 As an established class of engineering materials, aliphatic PA-6 (nylon 6) has been shown to be electrospun from organic solutions into very fine and uniform fibers which are used in the field of filtration media. Ding et al.31 observed the morphology of a fiber assembly of electrospun PA-6 with the spider webs having a mean fiber diameter of only tens of nanometers. It can effectively intercept highly contagious virus particles floating in the air. Different experimental studies employed multi-nozzle electrospinning to fabricate heterogeneously structured PA-6 nonwovens composed of fibers with significantly different diameters through the choice of solvent and concentration of the spinning solution.32,33 Electrospun composite fibers containing montmorillonite with PA-6 as the carrier material have been described.34 In Sundarrajan's research,35 electrospinning of a poly (ethylene imine) (PEI)/nylon 6 blend has been carried out. The obtained membranes are suitable candidates for protective clothing applications due to excellent air and moisture permeability. To sum up, the electrospinning of PA-6 must be carried out with solutions having concentrations of 10%–20% to obtain continuous fibers. But even so, the solutions still contain 80–90% solvent whose volatilization greatly reduces the fiber yield and increases the process cost. The literature shows that the fabrication of nylon 6 fibers by solution electrospinning mostly used formic acid25,36–38 as the solvent, or mixtures of formic acid and m-cresol in various compositional ratios32,33,39 or hexafluoro isopropyl alcohol (HFIP).35,40 All three commonly used solvents pose great potential threats to the human body and environment with the LD50 (oral, rat) and LC50 (4 h) (inhalation, rat) values of formic acid being 1100 mg kg−1 and 0.4 g m−3, respectively. The LD50 (oral, rat) and LC50 (4 h) (inhalation, rat) values of m-cresol are 242 mg kg−1 and 0.178 g m−3. The LD50 (oral, rabbit) value of HFIP is 1500 mg kg−1.41 At 10% nominal solution concentration, the preparation of 1 kg nylon 6 fiber requires 10 L of formic acid as the solvent, all of that requires energy for evaporation and recovery and they are all potential pollutants to the environment, especially to water and air. In fact, these problems are also common in the whole emerging field of solution electrospinning, and can become major barriers to commercially viable industrial production technology. A recent paper on nanofibrous membranes from the emulsion electrospinning technique has reported an excellent green fabrication procedure based on waterborne polyurethane,42 but unfortunately such an emulsion formulation for nylon polymers remains elusive. All solution-based fiber electrospinning operations are energy-intensive due to the fact that the vast majority of spinning solutions are solvent compositions which will require further evaporative processing and recycling.
Due to the above shortcomings in the solution electrospinning process, melt electrospinning is thought to be more scalable industrially and potentially at a lower cost. However, the viscosity of the molten polymer is so high which, together with the melt elasticity, makes the fiber stretching and attenuation under the high electric field extremely difficult to achieve, and the consequent generation of nanofibers much less likely. In the earlier work of polyolefin melt electrospinning, polypropylene (PP) of various molecular weights, from the molten state, was successfully drawn into fibers. They found that the higher the molecular weight of the polymers used, the larger the diameter of the fibers formed, but even with the lowest molecular weight polypropylene polymer they used (Mw = 12![[thin space (1/6-em)]](https://www.rsc.org/images/entities/char_2009.gif) 000), the majority of fibers obtained were above 3.5 μm.43 To overcome this challenge, some researchers reported a process called laser-heated melt-electrospinning (termed “laser electrospinning” (LES)), which prevented the electric discharge problems because heating is performed from a distance. In Takasaki's research,44 LES was employed to produce ultra-fine fibers of nylon 6/12 with average diameters of about 1 μm and a CV of less than 20%. Shimada et al. irradiated the tip of a rod-like polymer material using a spot-like laser beam, and a high voltage was applied between the tip melted part and the collector, forming a Taylor cone from which a nanofiber was drawn. They have further upgraded the process to line laser melt electrospinning,45 in which the nylon 6/12 sheets were irradiated by a line-like laser beam. The fiber productivity would increase by forming many Taylor cones simultaneously in the melted zone. However, the polymer only can be locally and instantaneously melted for LES, and the fiber productivity remains at extremely low levels. Furthermore, strong laser output power means high energy consumption and polymer decomposition can easily occur in the same process. In a report in 2009, the PA 6 polymer melt viscosity was reduced at very high temperature and using large amounts of additives and plasticizers. Extreme process conditions were described in this experiment, such as a temperature of up to 345 °C, and an electric voltage up to a dangerous 130 kV. Sodium stearate and oleate-higher fatty acid sodium salts (SF) must be added to the composition at 2–10% to reduce the viscosity and improve the electrical characteristics. Without such large amounts of additives, the fiber diameters would have been 40 times bigger.46 No mention was made of the negative impact of such extreme process conditions and large amounts of additives on the final fiber properties.
000), the majority of fibers obtained were above 3.5 μm.43 To overcome this challenge, some researchers reported a process called laser-heated melt-electrospinning (termed “laser electrospinning” (LES)), which prevented the electric discharge problems because heating is performed from a distance. In Takasaki's research,44 LES was employed to produce ultra-fine fibers of nylon 6/12 with average diameters of about 1 μm and a CV of less than 20%. Shimada et al. irradiated the tip of a rod-like polymer material using a spot-like laser beam, and a high voltage was applied between the tip melted part and the collector, forming a Taylor cone from which a nanofiber was drawn. They have further upgraded the process to line laser melt electrospinning,45 in which the nylon 6/12 sheets were irradiated by a line-like laser beam. The fiber productivity would increase by forming many Taylor cones simultaneously in the melted zone. However, the polymer only can be locally and instantaneously melted for LES, and the fiber productivity remains at extremely low levels. Furthermore, strong laser output power means high energy consumption and polymer decomposition can easily occur in the same process. In a report in 2009, the PA 6 polymer melt viscosity was reduced at very high temperature and using large amounts of additives and plasticizers. Extreme process conditions were described in this experiment, such as a temperature of up to 345 °C, and an electric voltage up to a dangerous 130 kV. Sodium stearate and oleate-higher fatty acid sodium salts (SF) must be added to the composition at 2–10% to reduce the viscosity and improve the electrical characteristics. Without such large amounts of additives, the fiber diameters would have been 40 times bigger.46 No mention was made of the negative impact of such extreme process conditions and large amounts of additives on the final fiber properties.
We reason that there is an important feature of nylon 6 synthesis through anionic polymerization in that the starting monomer has extremely low viscosity and the polymeric melt viscosity builds up as the degree of polymerization progresses. Furthermore, both chain-growth polymerization and polymer crystallization occur at temperatures below that of the melting point (Tm) of the final product even while a high polymeric molecular weight can be achieved to render meaningful properties to the final product.3 We are taking advantage of these features in our current report to uncover an extremely low energy fine fiber production process which uses no solvent or diluents. Relying on the mechanism and kinetics of the rapid anionic polymerization, the caprolactam monomer-catalyst-initiator system was used to obtain a reactant/product mixture with viscoelastic properties suitable for melt electrospinning. In doing so, we are generating a polymerizing melt mixture that is substantially less viscous than the neat polymer melts at a temperature substantially lower than the typical nylon 6 processing temperature (i.e. around 20–50 °C lower than its Tm, and 60–100 °C lower than the melt spinning temperature) to afford the spinning-stretching of fine fibers under a nominal electric field of 20–30 kV.
In this paper, we demonstrate the control of the reaction kinetics to arrive at a range of viscosities of the anionic polymerization mixture, which was suitable for drawing into ultra-fine fibers (0.4–3.2 μm) using an electrostatic field force. In our lab-built experiment setup, the low viscosity caprolactam monomer mixing, anionic ring-opening polymerization, extrusion and fiber spinning, polymer crystallization, stretching under an electric field force and the random laying of fibers took place sequentially to generate solid webs and membranes of nano- and micro-scale nylon 6 fibers. We further demonstrate that close to 100% monomer conversion was achieved in our prototype reactive melt electrospinning process and the weight average molecular weight of the resulting nylon 6 fibers as measured by GPC is above 50![[thin space (1/6-em)]](https://www.rsc.org/images/entities/char_2009.gif) 000. Having no organic solvents in the process eliminated the need for solvent recovery and potential environment pollution problems.
000. Having no organic solvents in the process eliminated the need for solvent recovery and potential environment pollution problems.
2. Experimental
2.1 Materials
All reactants in the present study have been supplied by Shanghai Macklin Biochemical Co., Ltd. Since the reaction is sensitive to moisture, caprolactam (CL) with the Mw of 113.16 and sodium hydride (NaH, 60% dispersion in mineral oil) were dried in a vacuum environment at 60 °C for 24 h. Toluene-2,4-diisocyanate (TDI) was kept at cryogenic temperature (2–8 °C).2.2 Nylon-6 fiber reactive forming process
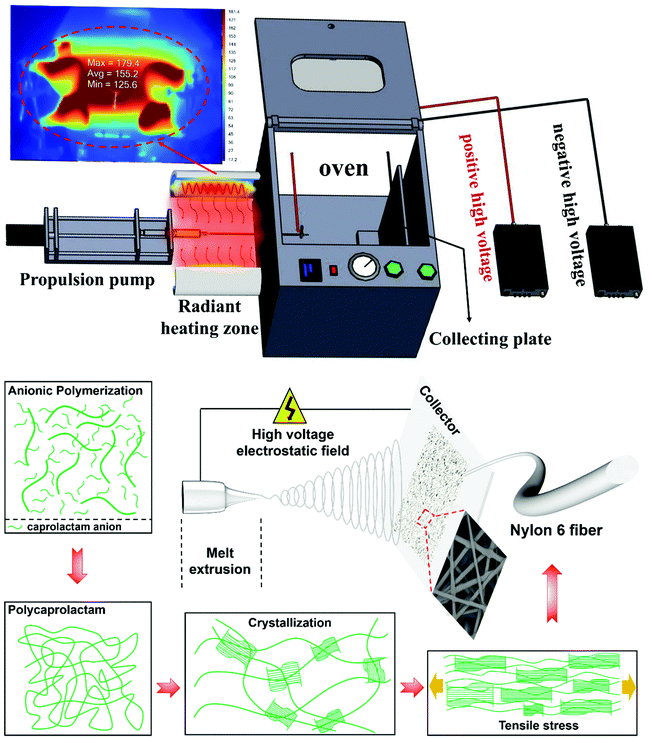
A schematic of the process is shown in Fig. 1, in which the CL and NaH were used as component A, with NaH being the catalyst. The CL and TDI were used as component B, with TDI being the initiator. A and B were placed in a 180 °C environment to melt and stabilize individually for 20 min, and then A and B were mixed together. The fluidic mixture gradually became viscous as the degree of polymerization rises due to the ring-opening polymerization. And it was transferred into a propulsion pump when the viscosity of the melt was adequate for fiber spinning. A DC supply (DW-P503-1ACF0, Dongwen High Voltage Power Supply Co., Ltd, Tianjin, China), a single-channel propulsion pump (LSP02-1B, Baoding Lange Constant Flow Pump Co., Ltd, Baoding, China), and a collecting plate were used in the setup. As shown in the radiant heating zone of Fig. 1, the melt in the propulsion pump was injected into the oven though a high temperature resistant pipe. The positive voltage (20 kV) was connected to the metal needle, and the negative voltage (10 kV) was connected to the collecting plate. The oven temperature was maintained at 180 °C, and several other set temperatures. The interior of the oven is completely electrically insulated. A continuous spinning process was recorded using a high-speed camera (see Videos S1 of the ESI†).Components A and B (the CL and NaH mixture and CL and TDI mixture, respectively) are always kept in equal amounts for mixing. The molar ratios of CL to the catalyst (NaH) and the initiator (TDI) are controlled at 93![[thin space (1/6-em)]](https://www.rsc.org/images/entities/char_2009.gif) :
:![[thin space (1/6-em)]](https://www.rsc.org/images/entities/char_2009.gif) 7, 94
7, 94![[thin space (1/6-em)]](https://www.rsc.org/images/entities/char_2009.gif) :
:![[thin space (1/6-em)]](https://www.rsc.org/images/entities/char_2009.gif) 6, 95
6, 95![[thin space (1/6-em)]](https://www.rsc.org/images/entities/char_2009.gif) :
:![[thin space (1/6-em)]](https://www.rsc.org/images/entities/char_2009.gif) 5, 96
5, 96![[thin space (1/6-em)]](https://www.rsc.org/images/entities/char_2009.gif) :
:![[thin space (1/6-em)]](https://www.rsc.org/images/entities/char_2009.gif) 4, 97
4, 97![[thin space (1/6-em)]](https://www.rsc.org/images/entities/char_2009.gif) :
:![[thin space (1/6-em)]](https://www.rsc.org/images/entities/char_2009.gif) 3 respectively, with the corresponding fibers generated respectively named 93
3 respectively, with the corresponding fibers generated respectively named 93![[thin space (1/6-em)]](https://www.rsc.org/images/entities/char_2009.gif) :
:![[thin space (1/6-em)]](https://www.rsc.org/images/entities/char_2009.gif) 7, 94
7, 94![[thin space (1/6-em)]](https://www.rsc.org/images/entities/char_2009.gif) :
:![[thin space (1/6-em)]](https://www.rsc.org/images/entities/char_2009.gif) 6, 95
6, 95![[thin space (1/6-em)]](https://www.rsc.org/images/entities/char_2009.gif) :
:![[thin space (1/6-em)]](https://www.rsc.org/images/entities/char_2009.gif) 5, 96
5, 96![[thin space (1/6-em)]](https://www.rsc.org/images/entities/char_2009.gif) :
:![[thin space (1/6-em)]](https://www.rsc.org/images/entities/char_2009.gif) 4, 97
4, 97![[thin space (1/6-em)]](https://www.rsc.org/images/entities/char_2009.gif) :
:![[thin space (1/6-em)]](https://www.rsc.org/images/entities/char_2009.gif) 3 nylon-6 fibers. To study the effect of the reaction/process temperature, we chose the CL and NaH and CL and TDI molar ratio of 95
3 nylon-6 fibers. To study the effect of the reaction/process temperature, we chose the CL and NaH and CL and TDI molar ratio of 95![[thin space (1/6-em)]](https://www.rsc.org/images/entities/char_2009.gif) :
:![[thin space (1/6-em)]](https://www.rsc.org/images/entities/char_2009.gif) 5 as the standard formulation, while adjusting the spinning ambient temperature range from 150 to 190 °C, and the corresponding fibers are respectively named 150, 160, 170, 180, and 190 nylon-6 fibers.
5 as the standard formulation, while adjusting the spinning ambient temperature range from 150 to 190 °C, and the corresponding fibers are respectively named 150, 160, 170, 180, and 190 nylon-6 fibers.
The low viscosity caprolactam monomer mixing, anionic ring-opening polymerization, extrusion and fiber spinning, polymer crystallization, stretching under an electric field force and the random laying of fibers took place sequentially to generate solid webs and membranes of nano- and micro-scale nylon 6 fibers (the fiber forming schematic diagram is shown in Fig. 1).
3. Characterization
Scanning electron microscopy (SEM, Phenom Pro SEM, Hitzacker, Germany) was employed to investigate the morphology and structure of the fibrous webs. The samples were subjected to gold sputter-coating in a vacuum prior to imaging (SBC-12, Beijing KYKY Technology Co., Ltd, Beijing, China).Fourier transform infrared spectra (FTIR) of the nanofibers were measured on a Nicolet 5700 FTIR spectrometer (Thermo Nicolet Corp., USA), for which the wave number range was 4000–500 cm−1. The final monomer conversion was determined by the absorbance ratio method based on the noncoincidence of two infrared characteristic peaks of the residual monomer and the polymer in the mixed system.
The powder X-ray diffraction (XRD) patterns were obtained with a DX-2700 X-ray diffractometer with Cu Kα radiation (40 kV, 40 mA), and the recorded region of 2θ was 5–50°, and the scanning speed was 5.0° min−1.
The thermal behavior of the nanofibers was monitored by differential scanning calorimetry (TA Q2000; TA Instruments, New Castle, DE, USA) under a nitrogen gas flow. The temperature was programmed to increase from 20 to 230 °C at a ramp rate of 10 °C min−1, then decrease from 230 to 20 °C at a freezing rate of 10 °C min−1 in a nitrogen atmosphere.
Gel permeation chromatography (GPC): an Agilent 1260 Infinity II system (Agilent Technologies) was used, fitted with a refractive index detector. Two PL HFIP-gel columns (300 × 7.5 mm) were used in series. The analysis was performed at 40 °C and hexafluoroisopropanol (HFIP) containing 10 mmol L−1 sodium trifluoroacetate was used as the mobile phase at a flow rate of 1.0 mL min−1. The test specimen was dissolved into the mobile phase at room temperature for more than 5 hours and then filtered. The molecular weight was determined in accordance with ASTMD 3536 and the equipment was calibrated with monodisperse standards of PL2020-0200 EasiVial PMMA (see the GPC calibration chart in the ESI†).
4. Results and discussion
4.1 Control of monomer conversion in caprolactam polymerization
The absorbance ratio method is an infrared quantitative analysis method which is suitable for samples whose thickness is difficult to control or cannot be accurately measured.47 It requires that the characteristic absorption bands of each component should not overlap each other and should be subject to the Lambert–Beer law.The product of the polymerization process consists of two components, unreacted caprolactam (X) and polyamide 6 (Y). The two components have the following relationship.
| AX = εXcXLX | (1) |
| AY = εYcYLY | (2) |
 | (3) |
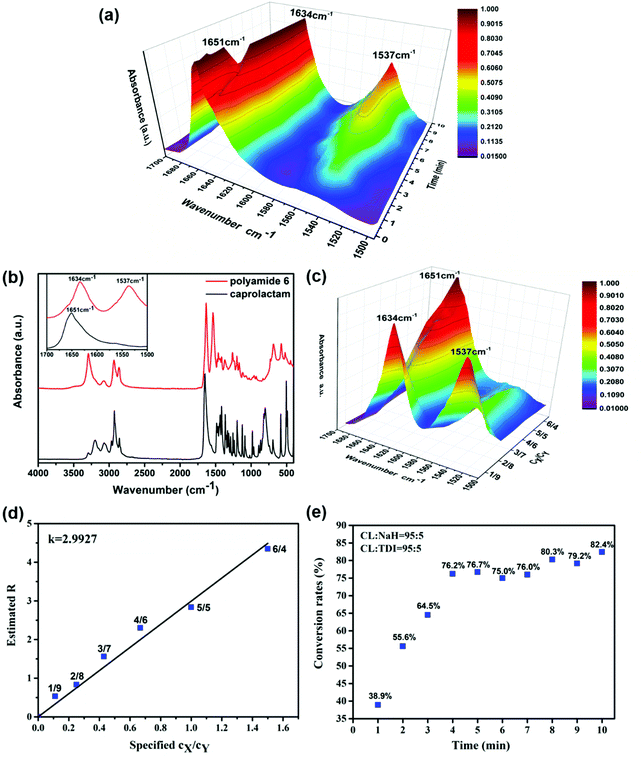
Fig. 2b shows the FTIR spectra of pure caprolactam and polyamide 6. The peak at 1651 cm−1 is the characteristic band of the lactam carbonyl band in caprolactam. The absorption bands at 1634 and 1537 cm−1 represent the linear amide I band and the linear amide II band of polyamide 6. Pure caprolactam (X) and polyamide 6 (Y) were made standard samples using concentration ratios (cX/cY) of 1![[thin space (1/6-em)]](https://www.rsc.org/images/entities/char_2009.gif) :
:![[thin space (1/6-em)]](https://www.rsc.org/images/entities/char_2009.gif) 9, 2
9, 2![[thin space (1/6-em)]](https://www.rsc.org/images/entities/char_2009.gif) :
:![[thin space (1/6-em)]](https://www.rsc.org/images/entities/char_2009.gif) 8, 3
8, 3![[thin space (1/6-em)]](https://www.rsc.org/images/entities/char_2009.gif) :
:![[thin space (1/6-em)]](https://www.rsc.org/images/entities/char_2009.gif) 7, 4
7, 4![[thin space (1/6-em)]](https://www.rsc.org/images/entities/char_2009.gif) :
:![[thin space (1/6-em)]](https://www.rsc.org/images/entities/char_2009.gif) 6, 5
6, 5![[thin space (1/6-em)]](https://www.rsc.org/images/entities/char_2009.gif) :
:![[thin space (1/6-em)]](https://www.rsc.org/images/entities/char_2009.gif) 5 and 6
5 and 6![[thin space (1/6-em)]](https://www.rsc.org/images/entities/char_2009.gif) :
:![[thin space (1/6-em)]](https://www.rsc.org/images/entities/char_2009.gif) 4. The mixture in powder was finely ground and pressed into a tablet whose absorbance in the frequency range of 1500 cm−1 to 1700 cm−1 is shown in Fig. 2c. According to the formula, the curve of AX/AY − cX/cY (Fig. 2d) was drawn through the origin and the slope was the absorption coefficient ratio (k = 2.9927).
4. The mixture in powder was finely ground and pressed into a tablet whose absorbance in the frequency range of 1500 cm−1 to 1700 cm−1 is shown in Fig. 2c. According to the formula, the curve of AX/AY − cX/cY (Fig. 2d) was drawn through the origin and the slope was the absorption coefficient ratio (k = 2.9927).
Fig. 2a shows the FT-IR kinetics spectra of nylon 6 in the frequency range of 1500 cm−1 to 1700 cm−1, showing the appearance of the linear amide II band (at 1537 cm−1) of the nylon structure and the transformation of the lactam carbonyl band (at 1651 cm−1) into the linear amide I band (at 1634 cm−1) during the course of polymerization at 180 °C.48
For this binary system,
| cX + cY = 1, | (4) |
 | (5) |
By calculating the R value of the polymer at each polymerization time according to the data in Fig. 2a, we can calculate the cX and cY, and then the conversion rate of the polymer at each minute could be obtained (as shown in Fig. 2e).
When the spinning process is well underway, part of the spinning melt was taken out and quenched to stop polymerization in four repeat experiments. The absorbances of these samples numbered 1, 2, 3 and 4 were measured by infrared spectroscopy. The conversion rates were calculated according to eqn (5) and the results are shown in Table 1.
| Samples | 1 | 2 | 3 | 4 | Average |
|---|---|---|---|---|---|
| Conversion rate (%) | 53.4 | 57.6 | 54.3 | 62.7 | 57.0 |
In addition, the sample polymerization conversion rate can be calculated by the weight method. The sample was soaked in alcohol for 24 h, and the alcohol was changed once at 12 h. The oligomers and unreacted monomers in the sample are extracted by alcohol, and polyamide 6 with a high degree of polymerization will not be extracted. The sample conversion rate was calculated using eqn (6) and the result is 54.1%. Compared with the result of the absorbance ratio method (57.0%), the value is smaller. This is because lower MW linear amide bands may exist in oligomers extracted from alcohol. Referring to Fig. 2e, the resulting conversion rate corresponds to the Y value between 2 and 3 min. That is to say, the melt viscosity when the polymerization was carried out for 2–3 min is most suitable for electrospinning at the temperature of 180 °C for that particular composition.
 | (6) |
where D is the sample conversion rate, W0 is the weight of the sample before extraction with alcohol, and W is the weight of the sample after extraction with alcohol.
4.2 Characteristics of the nanofiber membranes
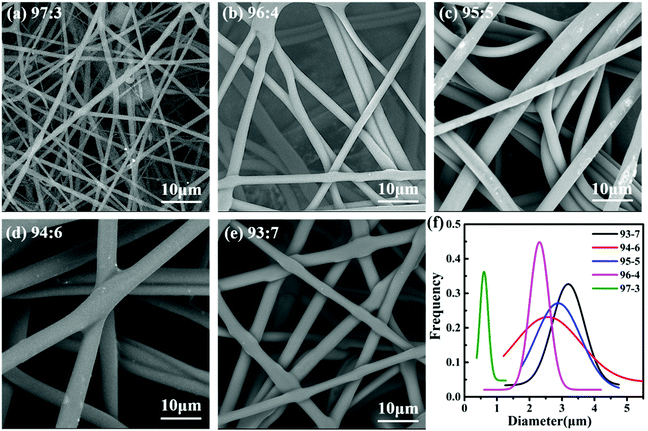
We used scanning electron microscopy (SEM) to view, measure and count the fiber sizes and the diameter (size) distribution of the prepared nylon-6 fibers as depicted in Fig. 3. We found that the samples present a two-dimensional reticular membrane structure on the whole, and the size distribution to be continuous monotonically for fibers. The curve graphs shown in Fig. 3f represent the random measurement of 100 fibers under the SEM graphs for each sample of the 93![[thin space (1/6-em)]](https://www.rsc.org/images/entities/char_2009.gif) :
:![[thin space (1/6-em)]](https://www.rsc.org/images/entities/char_2009.gif) 7, 94
7, 94![[thin space (1/6-em)]](https://www.rsc.org/images/entities/char_2009.gif) :
:![[thin space (1/6-em)]](https://www.rsc.org/images/entities/char_2009.gif) 6, 95
6, 95![[thin space (1/6-em)]](https://www.rsc.org/images/entities/char_2009.gif) :
:![[thin space (1/6-em)]](https://www.rsc.org/images/entities/char_2009.gif) 5, 96
5, 96![[thin space (1/6-em)]](https://www.rsc.org/images/entities/char_2009.gif) :
:![[thin space (1/6-em)]](https://www.rsc.org/images/entities/char_2009.gif) 4, and 97
4, and 97![[thin space (1/6-em)]](https://www.rsc.org/images/entities/char_2009.gif) :
:![[thin space (1/6-em)]](https://www.rsc.org/images/entities/char_2009.gif) 3 nylon-6 fibers. The average peak diameters for 93
3 nylon-6 fibers. The average peak diameters for 93![[thin space (1/6-em)]](https://www.rsc.org/images/entities/char_2009.gif) :
:![[thin space (1/6-em)]](https://www.rsc.org/images/entities/char_2009.gif) 7, 94
7, 94![[thin space (1/6-em)]](https://www.rsc.org/images/entities/char_2009.gif) :
:![[thin space (1/6-em)]](https://www.rsc.org/images/entities/char_2009.gif) 6, 95
6, 95![[thin space (1/6-em)]](https://www.rsc.org/images/entities/char_2009.gif) :
:![[thin space (1/6-em)]](https://www.rsc.org/images/entities/char_2009.gif) 5, 96
5, 96![[thin space (1/6-em)]](https://www.rsc.org/images/entities/char_2009.gif) :
:![[thin space (1/6-em)]](https://www.rsc.org/images/entities/char_2009.gif) 4, and 97
4, and 97![[thin space (1/6-em)]](https://www.rsc.org/images/entities/char_2009.gif) :
:![[thin space (1/6-em)]](https://www.rsc.org/images/entities/char_2009.gif) 3 nylon-6 fibers are at 3.2 μm, 2.6 μm, 2.8 μm, 2.3 μm and 0.6 μm respectively. These size differences correspond to the differences in melt viscosity of the composition when spun very well. The higher initiator molar ratio increased polymerization speeds which in turn enhanced the viscosity of the composition at the spinneret, which results in larger diameters of the fibers in the same electrospinning environment.49 According to the polymerization reaction formula (see Fig. S1 in the ESI†), the higher the ratio of the initiator (TDI) in the reaction system, the more active centers of growing chains formed.50 They can react with the caprolactam anion at the same time, which significantly improves the polymerization rate, followed by the rapid increase of melt viscosity. Under the same electric field intensity, the diameter of nylon-6 fibers obtained is thicker.
3 nylon-6 fibers are at 3.2 μm, 2.6 μm, 2.8 μm, 2.3 μm and 0.6 μm respectively. These size differences correspond to the differences in melt viscosity of the composition when spun very well. The higher initiator molar ratio increased polymerization speeds which in turn enhanced the viscosity of the composition at the spinneret, which results in larger diameters of the fibers in the same electrospinning environment.49 According to the polymerization reaction formula (see Fig. S1 in the ESI†), the higher the ratio of the initiator (TDI) in the reaction system, the more active centers of growing chains formed.50 They can react with the caprolactam anion at the same time, which significantly improves the polymerization rate, followed by the rapid increase of melt viscosity. Under the same electric field intensity, the diameter of nylon-6 fibers obtained is thicker.
Meanwhile, some side-reaction products and oligomers are more likely to form as the ratio of the catalyst and initiator increases. These are adulterated into melt jets during the spinning process, which affects the regularity of the molecular chain arrangement.51 It is a disadvantage to molecular chain orientation, which further affects the orientation of the nylon-6 fiber. Finally, a broader diameter distribution is shown in Fig. 3f as the ratio of catalyst and initiator increases.
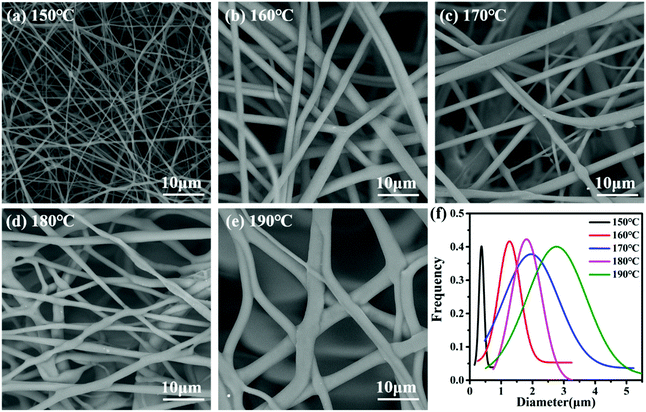
As shown in Fig. 4, the fibers present a two-dimensional reticular membrane structure on the whole, and the size distribution was continuous monotonically for fibers. The curve graphs shown in Fig. 4f represent the random measurement of 100 fibers under the SEM graphs for each sample, and they were taken for the nylon-6 fibers, as well as for the 150 °C, 160 °C, 170 °C, 180 °C, and 190 °C controls. For the control samples the peak diameters for 150, 160, 170, 180, and 190 nylon-6 fibers are 0.4 μm, 1.3 μm, 1.9 μm, 1.8 μm and 2.8 μm respectively. Given the analysis in section 4.1, the reactive mixture melt will be at approximately the same monomer conversion rate (less than 60%) when entering the spinning box. From entering the spinning box to forming the Taylor cone, the melt polymerization rate will vary due to the difference in the set temperature. The higher the temperature, the faster the polymerization rate, and the higher the average chain growth and molecular weight, so when the melt reached the tip of the spinning nozzle, the viscosity was higher and the resulting fibers were thicker at the same spinning parameters. Meanwhile a too fast polymerization rate is difficult to control, which will easily cause heterogeneity of the whole melt viscosity. The high viscosity limits electric field stretching, and even in some melt regions the conversion is too high to stretch.
This results in a fiber web with less regularity and a wider diameter distribution.
4.3 XRD study on the spun fibers
Nylon 6 is a typical semi-crystalline polymer, which usually includes two stable crystal structures of the α-type and the γ-type. Nylon 6 tends to show the alpha crystal form when it is pressed or crystallized at high temperature, while nylon 6 tends to show a gamma structure during high-speed spinning or rapid melt cooling.52 The two crystal forms can coexist and can be transformed into each other under certain conditions.53 In this experiment, Nylon 6 is spun and stretched by electrostatic spinning at high temperature, meeting the conditions for the formation of two crystal forms at the same time. The above is in line with the X-ray diffraction spectrum of the prepared nylon 6 fibers (Fig. 5). The results are shown in the figure: 2θ = 20.5° and 2θ = 23.8° are the most common characteristic diffraction peaks of the α crystal form,54 corresponding to (020) and (002/202) crystal planes, the molecular chains are arranged completely in a plane zigzag, and the structure is a triclinic crystal system.55 2θ = 11.0° and 2θ = 21.7° are the characteristic diffraction peaks of the γ crystal form,56 which correspond to the (020) and (001) crystal planes. The structure is generally monoclinic. The plane of the amide group and the plane of the main chain are at a 67° angle.57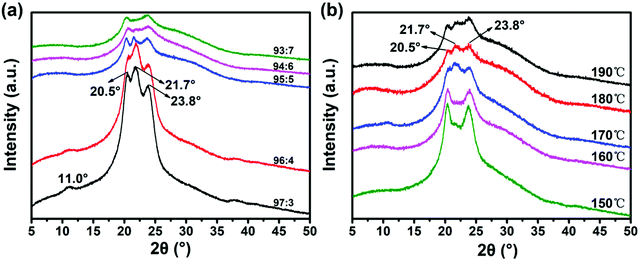 | ||
Fig. 5 (a) X-ray diffraction patterns of 97![[thin space (1/6-em)]](https://www.rsc.org/images/entities/char_2009.gif) : :![[thin space (1/6-em)]](https://www.rsc.org/images/entities/char_2009.gif) 3; 96 3; 96![[thin space (1/6-em)]](https://www.rsc.org/images/entities/char_2009.gif) : :![[thin space (1/6-em)]](https://www.rsc.org/images/entities/char_2009.gif) 4; 95 4; 95![[thin space (1/6-em)]](https://www.rsc.org/images/entities/char_2009.gif) : :![[thin space (1/6-em)]](https://www.rsc.org/images/entities/char_2009.gif) 5; 94 5; 94![[thin space (1/6-em)]](https://www.rsc.org/images/entities/char_2009.gif) : :![[thin space (1/6-em)]](https://www.rsc.org/images/entities/char_2009.gif) 6; and 93 6; and 93![[thin space (1/6-em)]](https://www.rsc.org/images/entities/char_2009.gif) : :![[thin space (1/6-em)]](https://www.rsc.org/images/entities/char_2009.gif) 7 nylon-6 fibers at 180 °C process temperature and (b) 150, 160, 170, 180, and 190 nylon-6 fibers at 95 7 nylon-6 fibers at 180 °C process temperature and (b) 150, 160, 170, 180, and 190 nylon-6 fibers at 95![[thin space (1/6-em)]](https://www.rsc.org/images/entities/char_2009.gif) : :![[thin space (1/6-em)]](https://www.rsc.org/images/entities/char_2009.gif) 5 initiator ratio. 5 initiator ratio. | ||
With the increase of the ratio of the catalyst and initiator, the peak intensity of the characteristic diffraction peak continues to decrease, which indicates that the crystallinity of nylon fibers is continuously decreasing. According to the polymerization reaction formula, it is known that increasing the amount of catalyst and initiator can increase the polymerization reaction speed, but it is also accompanied by the occurrence of more side reactions and the production of by-products. Moreover, increasing the amount of initiator will form more active centers of growth chain. Since the total amount of monomers in the system is constant, under the same conversion rate, the increase in the active center of the growing chain, that is, the increase in the number of polymer macromolecules, will inevitably lead to a significant decrease in the relative molecular weight of the final product, thereby increasing the production of oligomers. The presence of excessive oligomers and by-products will affect the symmetry and regularity of the nylon 6 molecular chain arrangement, which is not conducive to crystallization, so the crystallinity and the characteristic diffraction peak intensity decrease. However, a small amount of oligomer can induce crystallization by heterogeneous nucleation. Compared to the homogeneous nucleus that folds itself into chains, heterogeneous nucleation needs a lower energy barrier.58 While small amounts of oligomers can promote the α crystal forms, excessive oligomers will inhibit the α crystal forms,59 so the intensity of the characteristic peaks corresponding to the α crystal forms is weakened with the increase of the ratio of the catalyst and initiator.
According to the X-ray diffraction spectrum of nylon 6 prepared under different temperature conditions (Fig. 5b), the results show that as the temperature of the process environment increases, the intensity of the characteristic diffraction peaks continues to decrease, and the crystallinity of nylon 6 fibers continues to decrease. This is because at the same catalyst and initiator ratio, the higher the temperature, the higher the polymerization rate and the faster the melt viscosity, which limits the diffusion of the chain segment to the crystal nucleus. This will make it difficult for the chain segments to aggregate into nuclei and to fold and grow on the surface of the crystal nucleus, so the nucleation rate and crystal growth rate are reduced,60 resulting in a decrease in crystallinity and a decrease in the intensity of the characteristic diffraction peaks. In addition, studies have shown that nylon 6 tends to form a γ crystal form when the movement of the molecular chain is hindered.61 The higher the temperature, the more seriously the movement of the molecular chain is hindered, and the more conducive the conditions are to the growth of γ crystals. The 21.7° diffraction peak corresponding to the γ crystal form is more obvious in the spectrum.
4.4 DSC study on the crystalline characteristics of nylon-6 fibers
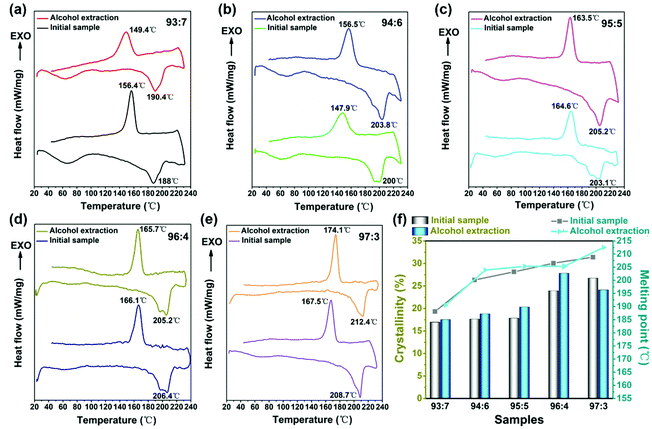
To further verify the results from the XRD analysis, DSC measurements were conducted to characterize the thermal properties of the electrospun nylon-6 fiber membranes. Fig. 6 shows the DSC thermograms of (a) 93![[thin space (1/6-em)]](https://www.rsc.org/images/entities/char_2009.gif) :
:![[thin space (1/6-em)]](https://www.rsc.org/images/entities/char_2009.gif) 7; (b) 94
7; (b) 94![[thin space (1/6-em)]](https://www.rsc.org/images/entities/char_2009.gif) :
:![[thin space (1/6-em)]](https://www.rsc.org/images/entities/char_2009.gif) 6; (c) 95
6; (c) 95![[thin space (1/6-em)]](https://www.rsc.org/images/entities/char_2009.gif) :
:![[thin space (1/6-em)]](https://www.rsc.org/images/entities/char_2009.gif) 5; (d) 96
5; (d) 96![[thin space (1/6-em)]](https://www.rsc.org/images/entities/char_2009.gif) :
:![[thin space (1/6-em)]](https://www.rsc.org/images/entities/char_2009.gif) 4; and (e) 97
4; and (e) 97![[thin space (1/6-em)]](https://www.rsc.org/images/entities/char_2009.gif) :
:![[thin space (1/6-em)]](https://www.rsc.org/images/entities/char_2009.gif) 3 nylon-6 fibers before and after alcohol extraction. Fig. 6f depicts the melting point and calculated crystallinity line chart of nylon-6 fibers before and after alcohol extraction. With the declining catalyst and initiator content, the melting point and crystallinity of the prepared nylon-6 fibers increase continuously. The melting point of 97
3 nylon-6 fibers before and after alcohol extraction. Fig. 6f depicts the melting point and calculated crystallinity line chart of nylon-6 fibers before and after alcohol extraction. With the declining catalyst and initiator content, the melting point and crystallinity of the prepared nylon-6 fibers increase continuously. The melting point of 97![[thin space (1/6-em)]](https://www.rsc.org/images/entities/char_2009.gif) :
:![[thin space (1/6-em)]](https://www.rsc.org/images/entities/char_2009.gif) 3 nylon-6 reached 208.7 °C and 212.4 °C respectively before and after alcohol extraction, which was very close to the melting point (∼215 °C) of commercial nylon-6 products. Meanwhile the crystallinity of 97
3 nylon-6 reached 208.7 °C and 212.4 °C respectively before and after alcohol extraction, which was very close to the melting point (∼215 °C) of commercial nylon-6 products. Meanwhile the crystallinity of 97![[thin space (1/6-em)]](https://www.rsc.org/images/entities/char_2009.gif) :
:![[thin space (1/6-em)]](https://www.rsc.org/images/entities/char_2009.gif) 3 initial nylon-6 fibers reached 26.7% and that of 96
3 initial nylon-6 fibers reached 26.7% and that of 96![[thin space (1/6-em)]](https://www.rsc.org/images/entities/char_2009.gif) :
:![[thin space (1/6-em)]](https://www.rsc.org/images/entities/char_2009.gif) 4 nylon-6 fibers after alcohol extraction reached 27.8% (Table 2). As mentioned earlier, side-reaction products and oligomers are more likely to form as the ratio of the catalyst and initiator increases. These are adulterated into melt jets during the spinning process, which affects the regularity and symmetry of the molecular chain arrangement. This is not conducive to the crystallization. For a lower ratio of catalysts and initiators, such as 97
4 nylon-6 fibers after alcohol extraction reached 27.8% (Table 2). As mentioned earlier, side-reaction products and oligomers are more likely to form as the ratio of the catalyst and initiator increases. These are adulterated into melt jets during the spinning process, which affects the regularity and symmetry of the molecular chain arrangement. This is not conducive to the crystallization. For a lower ratio of catalysts and initiators, such as 97![[thin space (1/6-em)]](https://www.rsc.org/images/entities/char_2009.gif) :
:![[thin space (1/6-em)]](https://www.rsc.org/images/entities/char_2009.gif) 3, only a small amount of oligomer was formed. Instead, it can promote nylon-6 fiber crystallization.
3, only a small amount of oligomer was formed. Instead, it can promote nylon-6 fiber crystallization.
| Nylon 6 fibers | Melting point (°C) | Crystallinity (%) | ||
|---|---|---|---|---|
| Before alcohol extraction | After alcohol extraction | Before alcohol extraction | After alcohol extraction | |
93![[thin space (1/6-em)]](https://www.rsc.org/images/entities/char_2009.gif) : :![[thin space (1/6-em)]](https://www.rsc.org/images/entities/char_2009.gif) 7 7 |
188 | 190.4 | 16.9 | 17.5 |
94![[thin space (1/6-em)]](https://www.rsc.org/images/entities/char_2009.gif) : :![[thin space (1/6-em)]](https://www.rsc.org/images/entities/char_2009.gif) 6 6 |
200 | 203.8 | 17.6 | 18.8 |
95![[thin space (1/6-em)]](https://www.rsc.org/images/entities/char_2009.gif) : :![[thin space (1/6-em)]](https://www.rsc.org/images/entities/char_2009.gif) 5 5 |
203.1 | 205.2 | 17.8 | 20.3 |
96![[thin space (1/6-em)]](https://www.rsc.org/images/entities/char_2009.gif) : :![[thin space (1/6-em)]](https://www.rsc.org/images/entities/char_2009.gif) 4 4 |
206.4 | 205.2 | 23.9 | 27.8 |
97![[thin space (1/6-em)]](https://www.rsc.org/images/entities/char_2009.gif) : :![[thin space (1/6-em)]](https://www.rsc.org/images/entities/char_2009.gif) 3 3 |
208.7 | 212.4 | 26.7 | 24.1 |
Moreover, the symmetry and regularity of the molecular chain are higher, and the change of the molecular chain is relatively less in the melting process, so nylon-6 fibers with a lower ratio of catalysts and initiators have a higher melting point. Meanwhile, a lower ratio of initiators leads to the production of nylon-6 fibers with a higher molecular weight. In general, the melting point increases with increasing molecular weight. As shown in Fig. 6, the nylon-6 fiber extracted from alcohol generally has a higher melting point and crystallinity. This is because alcohol can extract the unreacted monomers and oligomers which reduces the overall melting point and crystallinity.
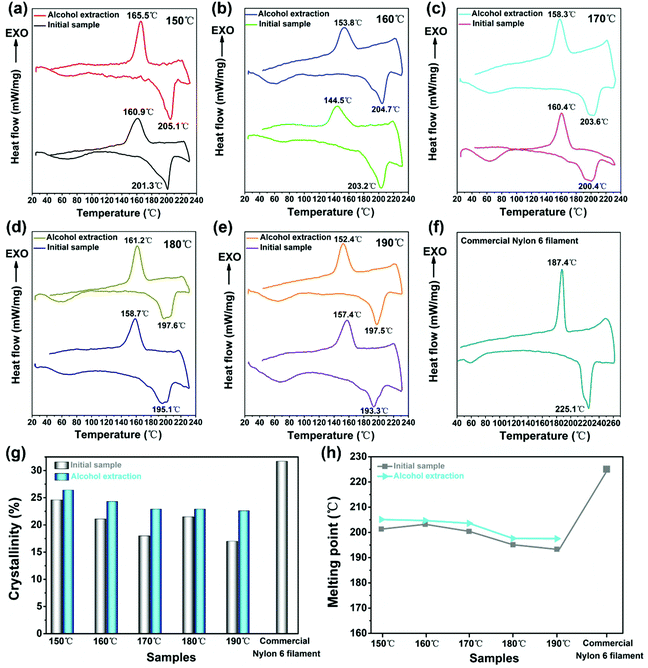
Fig. 7 shows the general trend of melting point and crystallinity of the prepared nylon-6 fibers going downward as the spinning temperature rises from 150 to 190 °C for the monomer/initiator composition of 95![[thin space (1/6-em)]](https://www.rsc.org/images/entities/char_2009.gif) :
:![[thin space (1/6-em)]](https://www.rsc.org/images/entities/char_2009.gif) 5. The crystallinity of 150 nylon-6 reached 24.6% and 26.4% respectively before and after alcohol extraction. Meanwhile the melting point of initial 160 nylon-6 fibers reached 203.2 °C and that of 150 nylon-6 fibers after alcohol extraction reached 205.1 °C (as shown in Table 3). At a higher temperature, the chain segment has better movement capacity. But this segment motion is unfavorable for segment gathered nucleation and folding growth of chain segments absorbed on the surface of the crystal nucleus. Thus, the higher the temperature, the lower the nucleation rate and crystal growth rate. In other words, the crystallization process is mainly controlled by the nucleation process, and the harder the nucleation, the more difficult the crystal growth.62
5. The crystallinity of 150 nylon-6 reached 24.6% and 26.4% respectively before and after alcohol extraction. Meanwhile the melting point of initial 160 nylon-6 fibers reached 203.2 °C and that of 150 nylon-6 fibers after alcohol extraction reached 205.1 °C (as shown in Table 3). At a higher temperature, the chain segment has better movement capacity. But this segment motion is unfavorable for segment gathered nucleation and folding growth of chain segments absorbed on the surface of the crystal nucleus. Thus, the higher the temperature, the lower the nucleation rate and crystal growth rate. In other words, the crystallization process is mainly controlled by the nucleation process, and the harder the nucleation, the more difficult the crystal growth.62
![[thin space (1/6-em)]](https://www.rsc.org/images/entities/char_2009.gif) :
:![[thin space (1/6-em)]](https://www.rsc.org/images/entities/char_2009.gif) 5 initiator ratio
5 initiator ratio
| Nylon 6 fibers | Melting point (°C) | Crystallinity (%) | ||
|---|---|---|---|---|
| Before alcohol extraction | After alcohol extraction | Before alcohol extraction | After alcohol extraction | |
| 150 | 201.3 | 205.1 | 24.6 | 26.4 |
| 160 | 203.2 | 204.7 | 21.1 | 24.3 |
| 170 | 200.4 | 203.6 | 18 | 22.9 |
| 180 | 195.1 | 197.6 | 21.5 | 22.9 |
| 190 | 193.3 | 197.5 | 17 | 22.6 |
| Commercial nylon 6 filament | 225.1 | 31.7 | ||
So the crystallinity is the highest at 150 °C.
In addition, commercial nylon 6 filaments were procured and parallel tests were run on the DSC program, with the result shown in Fig. 7f and Table 3. The commercial sample showed a DSC trace with less noise, and the exotherm and endotherm had a narrower peak pattern, reflecting a better ordered crystalline structure than our in situ produced samples. The melting point is higher. However, the degree of crystallinity for the commercial filament was only slightly higher than our samples and can be regarded as consistent with our results. We believe that the crystallinity and melting point of fiber samples described in our current paper are still within the reasonable range, given the high process speed in our in situ polymerization and crystallization.
The crystallinity (Xc) of the nylon-6 fibers could be determined from DSC through the following equation,
 | (7) |
4.5 Characterization of caprolactam monomer conversion
Fig. 8a and b show the results obtained by the weight method in section 4.1, and each sample was tested three times and averaged. The results are recorded in Tables S2 and S3.† The monomer conversion curve of fibers shows a strong regularity with the variation of the initiator and catalyst ratio, which is consistent with the XRD and DSC analysis results, all pointing to formation of more unreacted monomers, side-reaction products and oligomers as the ratio of the catalyst and initiator increases.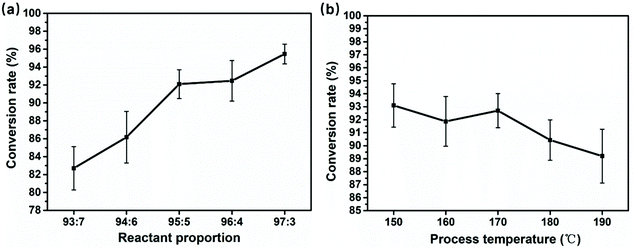 | ||
| Fig. 8 The conversion rate line graph at (a) different reactant proportions and (b) different spinning temperatures. | ||
It should be noted that the conversion rate results further support a conclusion: the melt was drawn into ultra-fine fibers by the electrostatic field force, and it is accompanied by continuous ring-opening polymerization. The conversion rate of the extruded melt and final fibers calculated by the weight method is 54.1 (section 4.1) and 92.1, respectively. During fiber stretching and the random laying, about 38% monomer conversion was accomplished.
4.6 Gel permeation chromatography (GPC) characteristics of nylon-6 fibers
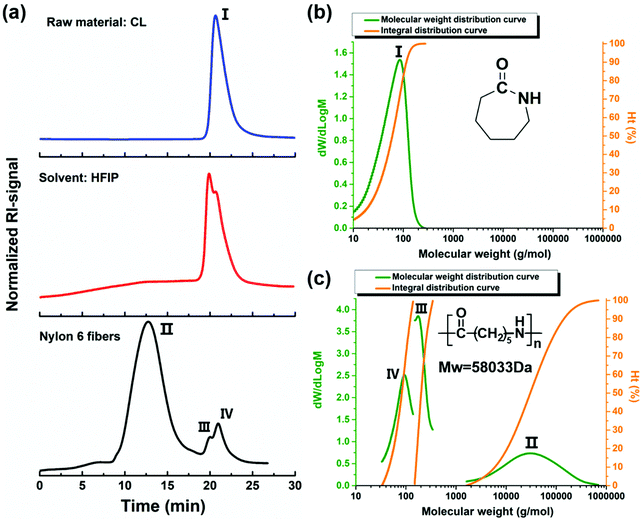
It is widely known that the molecular weight distribution (MWD) and the average weights play a critical role in the major properties of polymers. GPC (called also size exclusion chromatography, SEC) is one of the most targeted testing methods for these important polymer characteristics.65 As observed in Fig. 9a, the GPC nylon 6 fiber analysis showed three peaks (II, III, IV). The retention time of Peak III and IV overlaps with that of the solvent peak (the red curve), the Peak III and IV solvent signal is caused by the fact that the samples were dissolved in a solvent other than the eluent and have differences in the refractive index.Peak II shows a regular unimodal peak with a relatively well defined spread, which highlights the high molecular weight and reasonable MWD in the caprolactam anionic polymerization mechanism. The slight trailing in the profile may be caused by the fact that there are indeed shorter chain length polymers which did not grow as uniformly during the polymerization/fiber forming process. The average Mn value of 14![[thin space (1/6-em)]](https://www.rsc.org/images/entities/char_2009.gif) 772 Da and Mw value of 58
772 Da and Mw value of 58![[thin space (1/6-em)]](https://www.rsc.org/images/entities/char_2009.gif) 033 Da (Table 4) demonstrate that a highly efficient polymerization took place in our reactive fiber spinning process. Peak I of Fig. 9a is a narrow sharp peak of a strong signal corresponding to the low molecular weight (Table 4) of caprolactam (Fig. 9b). From peak I to II, the gradual disappearance of the monomer peak and simultaneous increase of the polymer peak can definitely prove the increase of molecular weight induced by chain growth in the anion ring opening polymerization of caprolactam.
033 Da (Table 4) demonstrate that a highly efficient polymerization took place in our reactive fiber spinning process. Peak I of Fig. 9a is a narrow sharp peak of a strong signal corresponding to the low molecular weight (Table 4) of caprolactam (Fig. 9b). From peak I to II, the gradual disappearance of the monomer peak and simultaneous increase of the polymer peak can definitely prove the increase of molecular weight induced by chain growth in the anion ring opening polymerization of caprolactam.
![[thin space (1/6-em)]](https://www.rsc.org/images/entities/char_2009.gif) :
:![[thin space (1/6-em)]](https://www.rsc.org/images/entities/char_2009.gif) 5 nylon 6 fibers prepared at 180 °C process temperature
5 nylon 6 fibers prepared at 180 °C process temperature
| Peak no. | M p (g mol−1) | M n (g mol−1) | M w (g mol−1) | M z (g mol−1) | M z + 1 (g mol−1) | M v (g mol−1) | PD |
|---|---|---|---|---|---|---|---|
| I | 85 | 35 | 64 | 87 | 104 | 84 | 1.829 |
| II | 31![[thin space (1/6-em)]](https://www.rsc.org/images/entities/char_2009.gif) 042 042 |
14![[thin space (1/6-em)]](https://www.rsc.org/images/entities/char_2009.gif) 772 772 |
58![[thin space (1/6-em)]](https://www.rsc.org/images/entities/char_2009.gif) 033 033 |
161![[thin space (1/6-em)]](https://www.rsc.org/images/entities/char_2009.gif) 754 754 |
289![[thin space (1/6-em)]](https://www.rsc.org/images/entities/char_2009.gif) 383 383 |
144![[thin space (1/6-em)]](https://www.rsc.org/images/entities/char_2009.gif) 633 633 |
3.929 |
5. Conclusion
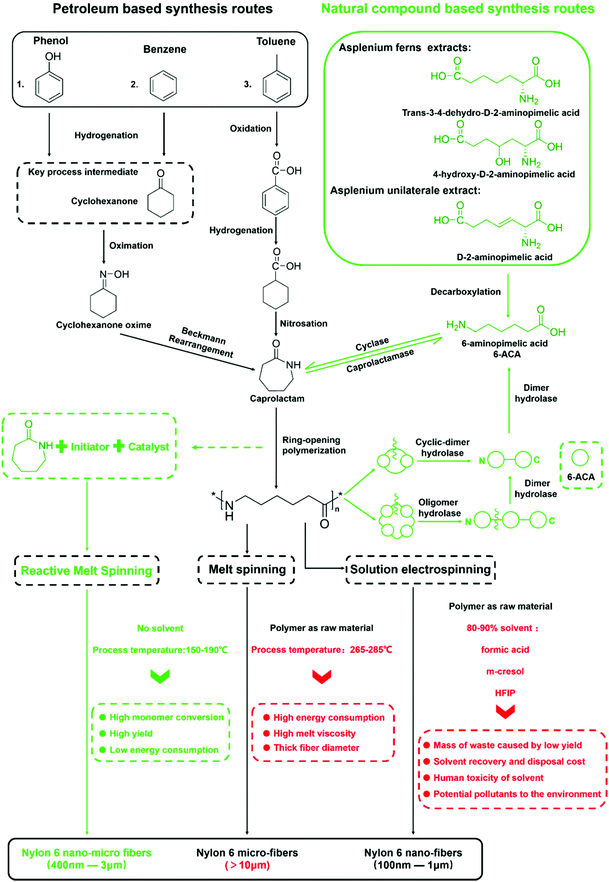
In summary, through caprolactam reactive fiber spinning, we were able to fabricate micro-nano-scale polyamide 6 nonwoven fiber membranes with high polymer conversion rate and nylon 6 crystalline characteristics at process temperatures below that of the melting point of the final polymers. What needs to be emphasized is that the whole process is much less energy intensive than the traditional micro fiber production process, let alone the nascent nano-fiber production processes. There is also no loss of production yield and the corresponding cost due to the use of organic solvent when comparing to the solution based nano-fiber e-spinning process. As a simple experimental process with low energy consumption and no byproducts, we have high hopes for its further development into a commercially viable, truly green manufacturing technology.Extending the discussions on the merits of the present research work, we have undertaken to further reflect on the overall Life Cycle Assessment (LCA) from the origin of the caprolactam monomer, to nylon 6 synthesis, to the final fiber production. We have therefore constructed a partial LCA map for the different routes currently employed commercially and/or experimentally as illustrated in Fig. 10. There are two different colors of the production routes, with the green routes being the more environmentally friendly approach consistent with the Green Chemistry concept. Recent research has shown caprolactam production using natural compounds found in plants like Asplenium under the action of biological enzymes. The aim of a green sustainable synthesis of the nylon 6 building block can been achieved.66–69 While in the processing of nylon 6 into fibers, whereas the segment of the LCA that our current paper is concerned, our Reactive Melting Spinning (RMS) could be the greenest route based on the comparison with that of conventional melt spinning and that of solvent based electro-spinning. Furthermore, Reactive Melt Spinning (RMS) could be the only route to produce fibers with diameters in the micron and sub-micron range without the aid of a toxic solvent, and the process temperature is about 80–100 °C lower than that of the current commercial melt spinning production, resulting in substantial energy savings. Further down the LCA chain, nylon 6 and its oligomers can be degraded to the caprolactam precursor (6-aminopimelic acid) under the action of some marine and soil microorganisms and hydrolase.70,71 At this point, the whole life cycle of nylon 6 fibers could conceptually be a green cycle and a sustainable process.
Author contributions
R. Z. performed the experiment design, test analysis and draft writing, X. M. contributed to the experimental work, H. H., and J. M. contributed to setup and analysis, and X. N. conceived the study and worked in the design, analysis and final writing.Conflicts of interest
The authors declare no competing financial interests.Acknowledgements
This research was supported by an Institute startup grant from Qingdao University and the Shandong Center for Engineered Nonwovens (SCEN).References
- H. K. Reimschuessel, J. Polym. Sci., Part C: Macromol. Rev., 1977, 12, 65–139 CAS.
- T. Ageyeva, I. Sibikin and J. Karger-Kocsis, Polymers, 2018, 10, 357 CrossRef.
- C. Vicard, O. De Almeida, A. Cantarel and G. Bernhart, Polymer, 2017, 132, 88–97 CrossRef CAS.
- N. Mougin, P. Rempp and Y. Gnanou, Macromolecules, 1992, 25, 6739–6743 CrossRef CAS.
- J. L. Lombardi and P. Calvert, Polymer, 1999, 40, 1775–1779 CrossRef CAS.
- M. Narita, H. Yoneyama, T. Matsunaga and M. Harada, Polym. J., 2020, 52, 199–206 CrossRef CAS.
- N. Mougin, C. A. Veith, R. E. Cohen and Y. Gnanou, Macromolecules, 1992, 25, 2004–2016 CrossRef CAS.
- R. M. Joyce and D. M. Ritter, U.S. Patent No2251519, 1941 Search PubMed.
- X. Ning and H. Ishida, Polym. Eng. Sci., 1991, 31, 632–637 CrossRef CAS.
- M.-X. Li, D. Lee, G. H. Lee, S. M. Kim, G. Ben, W. I. Lee and S. W. Choi, Polymers, 2020, 12, 1133 CrossRef CAS.
- X. Ning and H. Ishida, J. Polym. Sci., Part B: Polym. Phys., 1991, 29, 1479–1492 CrossRef CAS.
- N. Dencheva, H. Gaspar, S. Filonovich, O. Lavrova, T. Busani, G. Bernardo and Z. Denchev, J. Mater. Sci., 2014, 49, 4751–4764 CrossRef CAS.
- D. Leonov, T. Ustinova, N. Levkina, A. Mostovoy and M. Lopukhova, J. Polym. Res., 2020, 27, 1–7 CrossRef.
- M. Park, J.-U. Jang, J. H. Park, J. Yu and S. Y. Kim, Polymers, 2020, 12, 997 CrossRef CAS.
- O. V. Semperger and A. Suplicz, Materials, 2020, 13, 4 CrossRef CAS.
- C. W. Macosko, RIM, fundamentals of reaction injection molding, Hanser Publishers, 1989 Search PubMed.
- G. Rusu, K. Ueda, E. Rusu and M. Rusu, Polymer, 2001, 42, 5669–5678 CrossRef CAS.
- G. Rusu, M. Rusu, E. Rusu, A. Stoleriu and C. Teaca, Polym.-Plast. Technol. Eng., 2000, 39, 233–247 CrossRef CAS.
- M. I. Kohan, Nylon Plastics Handbook, Hanser, Munich, Germany, 1995 Search PubMed.
- K. Ueda, M. Nakai, M. Hosoda and K. Tai, Polym. J., 1996, 28, 1084–1089 CrossRef CAS.
- K. Ueda, K. Yamada, M. Nakai, T. Matsuda, M. Hosoda and K. Tai, Polym. J., 1996, 28, 446–451 CrossRef CAS.
- R. Mateva, R. Filyanova, R. Dimitrov and R. Velichkova, J. Appl. Polym. Sci., 2004, 91, 3251–3258 CrossRef CAS.
- S. Bolgov, V. Begishev, A. Y. Malkin and V. Frolov, Polym. Sci. U.S.S.R., 1981, 23, 1485–1492 CrossRef.
- K. Khodabakhshi, M. Gilbert, P. Dickens and R. Hague, Adv. Polym. Technol., 2010, 29, 226–236 CrossRef CAS.
- Y. Ahn, S. Park, G. Kim, Y. Hwang, C. Lee, H. Shin and J. Lee, Curr. Appl. Phys., 2006, 6, 1030–1035 CrossRef.
- M. Cai, J. Zhu, C. Yang, R. Gao, C. Shi and J. Zhao, Polymers, 2019, 11, 185 CrossRef.
- M. Cai, H. He, X. Zhang, X. Yan, J. Li, F. Chen, D. Yuan and X. Ning, Nanomaterials, 2019, 9, 39 CrossRef PubMed.
- S.-L. Liu, Y.-Z. Long, Y.-Y. Huang, H.-D. Zhang, H.-W. He, B. Sun, Y.-Q. Sui and L.-H. Xia, Polym. Chem., 2013, 4, 5696–5700 RSC.
- X. Wang, Y. Zhu, X. Wang, G. Liu, J. Li, R. Zhao, Y. Zhang, X. Zhang, G. Han and H. Zhao, Carbon, 2020, 169, 446–454 CrossRef CAS.
- R. Zhao, H. He, M. Cai, D. Miao, D. Yuan, J. Ming, N. Wang and X. Ning, Macromol. Rapid Commun., 2019, 40, 1900492 CrossRef CAS.
- B. Ding, C. Li, Y. Miyauchi, O. Kuwaki and S. Shiratori, Nanotechnology, 2006, 17, 3685 CrossRef CAS.
- C. Mit-uppatham, M. Nithitanakul and P. Supaphol, Macromol. Chem. Phys., 2004, 205, 2327–2338 CrossRef CAS.
- C. Mit-uppatham, M. Nithitanakul and P. Supaphol, Effects of Solution Concentration, Emitting Electrode Polarity, Solvent Type, and Salt Addition on Electrospun Polyamide-6 Fibers: A Preliminary Report, 2004 Search PubMed.
- H. Fong, W. Liu, C.-S. Wang and R. A. Vaia, Polymer, 2002, 43, 775–780 CrossRef CAS.
- S. Sundarrajan, A. Venkatesan and S. Ramakrishna, Macromol. Rapid Commun., 2009, 30, 1769–1774 CrossRef CAS PubMed.
- B. M. Razavizadeh and R. Niazmand, Heliyon, 2020, 6, 4784 CrossRef.
- A. Greiner and J. H. Wendorff, Angew. Chem., Int. Ed., 2007, 46, 5670–5703 CrossRef CAS PubMed.
- S. Zhang, N. Tang, L. Cao, X. Yin, J. Yu and B. Ding, ACS Appl. Mater. Interfaces, 2016, 8, 29062–29072 CrossRef CAS.
- P. Supaphol, C. Mit-uppatham and M. Nithitanakul, Macromol. Mater. Eng., 2005, 290, 933–942 CrossRef CAS.
- J. Macossay, Y. I. Avila-Vega, F. A. Sheikh, T. Cantu, F. E. Longoria-Rodríguez, E. H. Ramírez-Soria, R. C. Advíncula and J. Bonilla-Cruz, Macromol. Rapid Commun., 2020, 41, 2000195 CrossRef CAS.
- J. Andraos, ACS Sustainable Chem. Eng., 2018, 6, 3206–3214 CrossRef CAS.
- W. Zhou, X. Gong, Y. Li, Y. Si, S. Zhang, J. Yu and B. Ding, Chem. Eng. J., 2022, 427, 130925 CrossRef CAS.
- J. Lyons, C. Li and F. Ko, Polymer, 2004, 45, 7597–7603 CrossRef CAS.
- M. Takasaki, H. Fu, K. Nakata, Y. Ohkoshi and T. Hirai, Sen'i Gakkaishi, 2008, 64, 29–31 CrossRef CAS.
- N. Shimada, H. Tsutsumi, K. Nakane, T. Ogihara and N. Ogata, J. Appl. Polym. Sci., 2010, 116, 2998–3004 CAS.
- S. Malakhov, A. Y. Khomenko, S. Belousov, A. Prazdnichnyi, S. Chvalun, A. Shepelev and A. Budyka, Fibre Chem., 2009, 41, 355–359 CrossRef CAS.
- A. S. Wexler, Anal. Chem., 1964, 36, 1829–1831 CrossRef CAS.
- H. Ishida and C. Scott, J. Polym. Eng., 1986, 6, 201–218 CAS.
- S.-H. Tan, R. Inai, M. Kotaki and S. Ramakrishna, Polymer, 2005, 46, 6128–6134 CrossRef CAS.
- G.-H. Hu, H. Cartier and C. Plummer, Macromolecules, 1999, 32, 4713–4718 CrossRef CAS.
- K. Van Rijswijk, H. Bersee, A. Beukers, S. Picken and A. Van Geenen, Polym. Test., 2006, 25, 392–404 CrossRef CAS.
- D. Cho, E. Zhmayev and Y. L. Joo, Polymer, 2011, 52, 4600–4609 CrossRef CAS.
- C. Ramesh, A. Keller and S. Eltink, Polymer, 1994, 35, 2483–2487 CrossRef CAS.
- H. Suzuki, S. Ishii, H. Sato, S. Yamamoto, Y. Morisawa, Y. Ozaki, T. Uchiyama, C. Otani and H. Hoshina, Chem. Phys. Lett., 2013, 575, 36–39 CrossRef CAS.
- J. Pepin, V. Miri and J.-M. Lefebvre, Macromolecules, 2016, 49, 564–573 CrossRef CAS.
- N. Murthy, S. Aharoni and A. Szollosi, J. Polym. Sci., Polym. Phys. Ed., 1985, 23, 2549–2565 CrossRef CAS.
- D. Holmes, C. Bunn and D. Smith, J. Polym. Sci., 1955, 17, 159–177 CrossRef CAS.
- H. Wang, P.-G. Ren, J.-Z. Xu, D.-X. Yan, Z.-M. Li and L. Xu, Compos. Interfaces, 2014, 21, 203–215 CrossRef CAS.
- S. Zhang, J. Zhang, L. Tang, J. Huang, Y. Fang, P. Ji, C. Wang and H. Wang, Polymers, 2019, 11, 978 CrossRef PubMed.
- S. E. Swanson, Am. Mineral., 1977, 62, 966–978 CAS.
- T. Ishisue, M. Okamoto and K. Tashiro, Polymer, 2010, 51, 5585–5591 CrossRef CAS.
- J. Magill, Polymer, 1962, 3, 655–664 CrossRef CAS.
- P. Kiliaris, C. Papaspyrides and R. Pfaendner, Polym. Degrad. Stab., 2009, 94, 389–396 CrossRef CAS.
- I. Campoy, M. Gomez and C. Marco, Polymer, 1998, 39, 6279–6288 CrossRef CAS.
- Z. Liu, Y. Lv and Z. An, Angew. Chem., 2017, 129, 14040–14044 CrossRef.
- N. Murakami, J. Furukawa, S. Okuda and S.-I. Hatanaka, Phytochemistry, 1985, 24, 2291–2294 CrossRef CAS.
- N. Murakami and S.-I. Hatanaka, Bot. Mag., 1988, 101, 353–372 CrossRef CAS.
- N. Murakami and S.-I. Hatanaka, Phytochemistry, 1983, 22, 2735–2737 CrossRef CAS.
- J. Zhang, J. F. Barajas, M. Burdu, G. Wang, E. E. Baidoo and J. D. Keasling, ACS Synth. Biol., 2017, 6, 884–890 CrossRef CAS PubMed.
- U. Klun, J. Friedrich and A. Kržan, Polym. Degrad. Stab., 2003, 79, 99–104 CrossRef CAS.
- S. Negoro, T. Ohki, N. Shibata, K. Sasa, H. Hayashi, H. Nakano, K. Yasuhira, D.-I. Kato, M. Takeo and Y. Higuchi, J. Mol. Biol., 2007, 370, 142–156 CrossRef CAS PubMed.
Footnote |
| † Electronic supplementary information (ESI) available. See DOI: 10.1039/d1gc03468e |
| This journal is © The Royal Society of Chemistry 2022 |

