 Open Access Article
Creative Commons Attribution 3.0 Unported Licence
One-step enzyme-free dual electrochemical immunosensor for histidine-rich protein 2 determination†
Ariamna María Dip Gandarillaa,
Matias Regiart *b,
Mauro Bertottib,
Juliane Correa Glóriac,
Luís André Morais Mariubac and
Walter Ricardo Brito
 *a
*a
aDepartment of Chemistry, Federal University of Amazonas, Manaus, Amazonas 69067-005, Brazil. E-mail: wrbrito@ufam.edu.br; Tel: +55 92 981379920
bDepartment of Fundamental Chemistry, Institute of Chemistry, University of São Paulo, São Paulo 05508-000, Brazil. E-mail: matiasregiart@gmail.com; Tel: +55 11 982885489
cLeônidas and Maria Deane Institute, Oswaldo Cruz Foundation, Manaus, Amazonas 69057-070, Brazil
First published on 23rd December 2020
Abstract
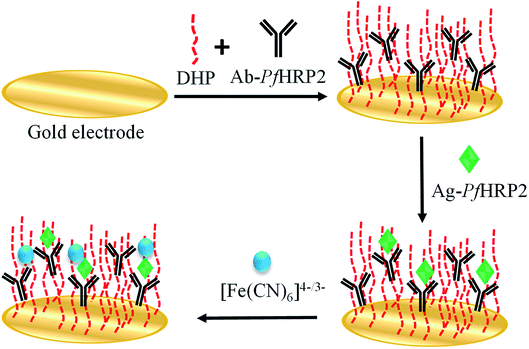
In the present work, we describe a novel one-step enzyme-free dual electrochemical immunosensor for the determination of histidine-rich protein 2 (Ag-PfHRP2), a specific malaria biomarker. A gold electrode (GE) was functionalized with the PfHRP2 antibody (Ab-PfHRP2) using dihexadecyl phosphate (DHP) polymer as an immobilization platform. The Ab-PfHRP2/DHP/GE sensor was characterized by cyclic voltammetry, electrochemical impedance spectroscopy, Fourier-transform infrared spectroscopy, scanning electron microscopy, and atomic force microscopy. The developed immunosensor was employed for indirect Ag-PfHRP2 determination by differential pulse voltammetry (DPV) and electrochemical impedance spectroscopy (EIS). The linear range was 10–400 ng mL−1 and 10–500 ng mL−1 for EIS and DPV, while the limit of detection was 3.3 ng mL−1 and 2.8 ng mL−1, respectively. The electrochemical immunosensor was successfully applied for Ag-PfHRP2 determination in human serum samples. Its performance was compared with an ELISA test, and good correspondence was achieved. The coefficients of intra- and inter-assay variations were less than 5%. The electrochemical immunosensor is a useful and straightforward tool for in situ malaria biomarker determination.
1. Introduction
Malaria is one of the most important tropical infectious parasitic diseases, caused by Plasmodium sp. parasites (Plasmodium falciparum, ovale, vivax, malariae, and knowlesi) and transmitted by the female of Anopheles mosquito. According to the World Malaria Report 2019, there was an estimate of 405![[thin space (1/6-em)]](https://www.rsc.org/images/entities/char_2009.gif) 000 deaths globally in 2018, and the infections by Plasmodium falciparum parasite are the most common.1 The morbidity and mortality are higher in low resource populations, with limited health care facilities.2
000 deaths globally in 2018, and the infections by Plasmodium falciparum parasite are the most common.1 The morbidity and mortality are higher in low resource populations, with limited health care facilities.2
Malaria diagnosis is commonly confirmed by microscopic examination, which consists of the observation of blood samples on a microscopic slide assisted with staining. However, such an approach requires trained professionals, specialized facilities, long analysis time, expensive equipment, and reagents.3 Nucleic acid amplification tests have also been used to detect the nucleic acid of the malaria parasite, including loop-mediated isothermal amplification, real-time quantitative polymerase chain reaction, and quantitative nucleic acid amplification techniques. However, they have many disadvantages, such as poor reproducibility at low concentrations, expensive and time-consuming, require good laboratory facilities, and skilled personnel.4,5 Rapid diagnostic tests (RDTs) based on the Plasmodium biomarkers detection are another alternative and hold advantages, like the low cost, short analysis times, the possibility of in situ multiple species detection, and require unskilled labor.6
Biomarkers are molecular, biochemical, or cellular variations measurable in biological samples that indicate any biological, pathogenic, or therapeutic response.7 Recent bibliography reported the development of several aptasensors and immunosensors for malaria based on biomarkers detection, like histidine-rich protein II (HRP-2),8–10 lactate dehydrogenase (LDH),11–13 aldolase (ALD),14 hypoxanthine-guanine phosphoribosyl transferase (HGPRT),15 glutamate dehydrogenase (GluDH),16 and products such as hemozoin.17
In the last years, nanotechnology advances allowed the integration of novel materials into bio-analytical detection systems based on recognition elements such as enzymes, antibodies, nucleic acids, among others.18,19 These devices are characterized by simple, rapid, and accurate results due to the selective and sensitive interaction between bio-reagents and target analytes without the need to remove interferants from the sample before detection. The application of such devices is extended to process monitoring, clinical diagnosis, and evaluation of environmental, food, and water safety.20,21
The immobilization step is an essential subject in immunosensors development to obtain a satisfactory performance and appropriate characteristics. Even though many protocols can be found in the literature where crosslinkers are used to perform a covalent link between the immunoreagents and the immobilization platforms, these immobilization processes require long time-consuming steps and entirely known reaction conditions.9,22 Another option for biomolecules immobilization is the entrapment into polymers networks.23 Dihexadecyl phosphate (DHP) is a polymeric surfactant widely used as an encapsulating material. This polymer has a phosphate group negatively charged in the polar head, connected to two long hydrocarbon chains, is hydrophobic, and does not form micelles. However, DHP can be dispersed in water and organic solvents using ultrasonic stirring, resulting in a homogeneous and stable dispersion with a gel-crystalline aspect.24 Such stable films have been used to develop electrochemical sensors and biosensors.25–27
In this study, we present a one-step enzyme-free electrochemical immunosensor to determine Plasmodium falciparum histidine-rich protein 2 antigen (Ag-PfHRP2), using a first-time DHP as a polymer to immobilize PfHRP2 antibody directly on a gold electrode (GE) surface. The Ab-PfHRP2/DHP/GE was characterized by cyclic voltammetry (CV), electrochemical impedance spectroscopy (EIS), Fourier-transform infrared spectroscopy (FTIR), scanning electron microscopy (SEM), and atomic force microscopy (AFM). The immunosensor was employed for indirect Ag-PfHRP2 determination by differential pulse voltammetry (DPV) and electrochemical impedance spectroscopy (EIS). The results were correlated with a conventional ELISA test, showing a good correspondence. This novel device is a low cost and simple tool for in situ malaria biomarker determination.
2. Materials and methods
2.1. Chemicals and reagents
DHP, potassium hexacyanoferrate(III), and potassium chloride were purchased from Sigma-Aldrich (St. Louis, USA). Potassium hexacyanoferrate(II) trihydrate, sulfuric acid (98%), and buffer saline solution (PBS) of pH 7.00 were from Merck (Darmstadt, Germany). Purified polyclonal Ab-PfHRP2, Ag-PfHRP2, and human serum samples were obtained from Leônidas and Maria Deane Institute (Oswaldo Cruz Foundation, Manaus, Brazil). The biomolecules preparation process consisted of the recombinant expression of Plasmodium falciparum HRP2 in Escherichia coli BL21 pLysS (Invitrogen), and the purification was performed using affinity chromatography nickel columns (QIAGEN), following the manufacturer instructions.28 Later, mice were immunized with the purified recombinant protein (4 bi-weekly 10 μg doses). Serum samples were collected, and reactivity was analyzed by indirect enzyme-linked immunosorbent assay (ELISA). Antibodies were purified using the protein G sepharose (Sigma) resin column following the manufacturer's recommendations.All the other reagents employed were of analytical grade and were used without further purification. Aqueous solutions were prepared by using purified water from a Milli-Q system.
2.2. Equipment
All electrochemical measurements (CV, EIS, and DPV) were performed using a PGSTAT128N potentiostat from Methrohm Autolab, with a NOVA 1.11 electrochemical analysis software. A conventional three-electrode system was used with a gold electrode (GE) (2 mm in diameter) as the working electrode, Ag/AgCl as the reference electrode (sat. KCl), and platinum as the auxiliary electrode.All pH measurements were made with a precision pH meter (F20, FiveEasy). An ultrasonic bath (Q3350, QUIMIS) was also used.
The chemical groups were identified by Fourier-transform infrared spectroscopy (FTIR), coupled with an attenuated total reflectance (ATR) accessory (Agilent, Cary 630 Model). The number of scans was set to 150 and the resolution to 8.
Scanning electron microscopy images were taken on a VEGA3, TESCAN. Atomic force microscopy measurements were carried out on a Nanosurf Lens AFM instrument, equipped with a c3000 controller, using tapping contact mode and commercial tips (TAP 190, Al-G).
2.3. Immunosensor preparation
To improve the measurement's reproducibility, the bare GE (2 mm in diameter) was polished with 0.3 and 0.05 μm alumina slurry, polishing sandpaper (P4000), and cloth pad from Buehler (Illinois, USA), followed by ultrasonication in deionized water for 3 minutes. An electrochemical cleaning step was then performed by cyclic voltammetry between +0.0 and +1.5 V (vs. Ag/AgCl, sat. KCl) in 0.5 mol L−1 H2SO4 solution, with a scan rate of 50 mV s−1. Afterward, the electrode was rinsed with water and dried using an argon gas stream. A DHP solution (1 μg μL−1) was then prepared in 0.1 mol L−1 PBS pH 7.00 under ultrasonic stirring for two hours.29 The antibody was coated by adding 3 μL of an Ab-PfHRP2 (0.05 μg μL−1)/DHP (1 μg μL−1) solution onto the electrode surface. The fabricated immunosensor was allowed to dry for 12 hours at 4 °C.2.4. Determination of Ag-PfHRP2
Firstly, the immunosensor was incubated in the sample solution (previously diluted 1/50 in 0.1 mol L−1 PBS pH 7.00) for 40 minutes. In this step, the antigen present in the sample binds to the antibody. Later, a washing step with 0.1 mol L−1 PBS pH 7.00 was performed. Finally, the dual detection step was carried out in a 5 mmol L−1 [Fe(CN)6]4−/3− + 0.1 mol L−1 KCl solution by differential pulse voltammetry measurements from −0.1 to +0.7 V at a scan rate of 25 mV s−1 under modulation amplitude of 50 mV, and by electrochemical impedance spectroscopy, at +0.23 V, varying the frequency with logarithmic spacing frequency in the range from 10 mHz to 100 kHz (Scheme 1).2.5. Ethical review
This study was approved by the Brazilian Animal Ethical Committee (CEUA-UFAM 005/2010) and by the Human Research Ethical Committee of Amazonas Federal University (CAAE 00622218.3.0000.5020).3. Results and discussion
3.1. Chemical and morphological characterization
The chemical environment of the modified gold electrode surface was characterized by the FTIR technique. Fig. 1 shows the C–H stretching vibrations at 2916 and 2847 cm−1, and C–H bend vibrations at 1342 cm−1, corresponding to the DHP aliphatic chains. Peaks around 2384 and 1648 cm−1 were observed and attributed to a phosphate group (P–O–H stretching and bending vibration, respectively). The peak at 1066 cm−1 corresponds to the P–O–C stretch vibration.30 The antibody presence is associated with vibrations resulting from O–H and N–H stretching bands (3200–3400 cm−1) and the increase in the signal intensity at 1648 and 1066 cm−1 due to C![[double bond, length as m-dash]](https://www.rsc.org/images/entities/char_e001.gif) O and C–O bonds. These signals are characteristics of typical amino acids present in proteins.
O and C–O bonds. These signals are characteristics of typical amino acids present in proteins.
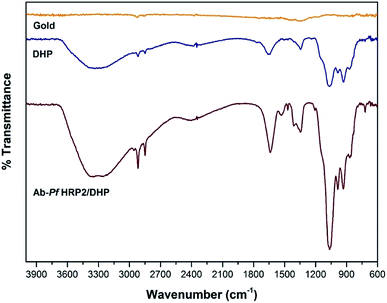 | ||
| Fig. 1 ATR-FTIR of the surfaces of bare GE, GE modified with DHP, and GE modified with Ab-PfHRP2/DHP. | ||
The morphological characterization of the modified GE with DHP and Ab-PfHRP2/DHP was conducted employing SEM and AFM techniques. Fig. 2a shows the granular structures of DHP on the GE surface, while the electrode surface after Ab-PfHRP2/DHP deposition reveals surface densification (Fig. 2b).
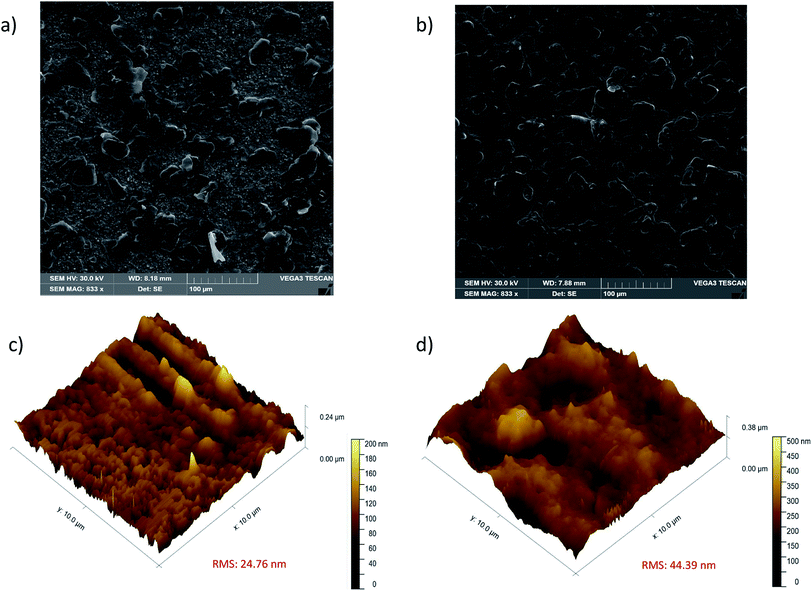 | ||
| Fig. 2 SEM and 3-dimensional AFM images: (a and c) DHP/GE surface, (b and d) Ab-PfHRP2/DHP/GE surface. | ||
AFM images of the topography of DHP and Ab-PfHRP2/DHP modified electrode surfaces are presented in Fig. 2c and d, respectively. The 24.76 nm and 44.39 nm root mean square roughness (RMS) values for the DHP and Ab-PfHRP2/DHP films, respectively, indicated the successful modification of the electrode surface. By inspection of such figures, one can also conclude that the Ab-PfHRP2/DHP film exhibits a more irregular and rougher surface compared to that of DHP.
3.2. Electrochemical characterization
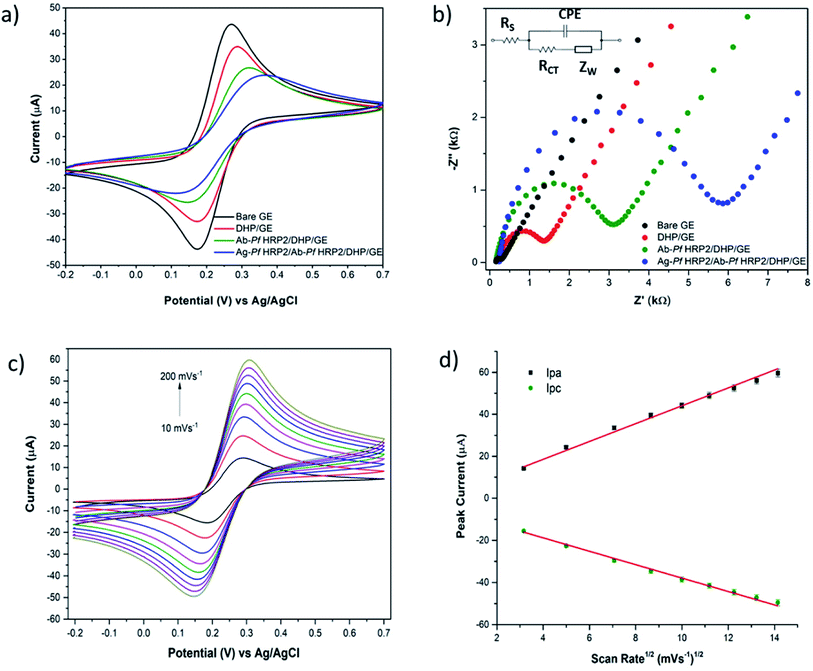
The GE surface modification was examined by CV and EIS. The CV of a soluble electroactive species with fast, reversible electrochemical behavior is an invaluable tool for monitoring several stages in the electrode surface modification. CVs were recorded in 5 mmol L−1 [Fe(CN)6]4−/3− + 0.1 mol L−1 KCl solution, in a potential range between −0.2 and +0.7 V at 50 mV s−1. As can be seen in Fig. 3a, the bare GE shows a well-defined reversible response for [Fe(CN)6]4−/3−, confirming the electron transfer is mass-transport controlled at the bare electrode. On the other hand, the ability of the redox probe to access the electrode surface decreases for the modified electrode with DHP because such a compound is negatively charged and hinders the diffusion of ferricyanide/ferrocyanide towards the electrode surface by charge exclusion.31 The voltammetric profile obtained with the Ab-PfHRP2/DHP and Ag-PfHRP2/Ab–PfHRP2/DHP modified electrodes followed a similar trend, i.e., broader voltammograms with larger anodic–cathodic peak separation, indicating partially blocked electron transfer because of the insulating characteristics of the immobilized biological structures.EIS experiments were carried out in 5 mmol L−1 [Fe(CN)6]4−/3− + 0.1 mol L−1 KCl, within the conditions previously reported. The obtained EIS data were represented as Nyquist (Fig. 3b) and Bode (Fig. S1†) plots. The impedance spectrum includes a semicircle at higher frequencies representing the electron transfer resistance, evidencing the blocking behavior of the bare/modified electrode surface towards the redox probe, and a linear part at lower frequencies that represents the diffusion process. Resistance values (Rct) were evaluated by iterative fitting (NOVA 1.11 software) of the experimental data to the modified Randles equivalent circuit (Fig. 3b inset), where Rs is the solution resistance, Zw is the Warburg impedance, and CPE is the constant phase element. As it can be observed, lower electron transfer resistance values were obtained with the bare gold electrode (136 Ω). The semicircle increased (Rct = 1.21 kΩ) due to the increase of the insulating layer thickness resulting from the DHP polymer deposition process. This behavior has been previously reported for gold,31 and glassy carbon32 electrodes modified with DHP and was attributed to the partial blockage of the electron transfer. The immobilization of large molecular antibody structures increased the gold surface's insulator behavior and led to an increase in the semicircle curve (Rct = 2.82 kΩ), confirming the successful Ab-PfHRP2 deposition.33 Finally, an even higher hindrance effect of the antibody–antigen complex was noticed after attachment of the antigens (100 ng mL−1 Ag-PfHRP2) to the immobilized antibodies, resulting in a significant Rct increase (up to 5.29 kΩ).
The electron transfer behavior of [Fe(CN)6]4−/3− redox couple at the Ab-PfHRP2/DHP/GE immunosensor was investigated by performing cyclic voltammetry experiments varying the scan rates from 10 to 200 mV s−1 in the potential range between −0.2 and +0.7 V. Fig. 3c and d show that both anodic (Ipa) and cathodic (Ipc) peak currents increased linearly with the square root of the scan rate (v1/2), suggesting that the electrochemical reaction was a diffusion-controlled process.34 The regression equations of the two straight lines are as follows: Ipa (μA) = 4.255v1/2 (mV s−1) + 1.496 (R2 = 0.992), Ipc (μA) = −3.183v1/2 (mV s−1) − 6.053 (R2 = 0.995).
An immunosensor stability test was conducted by recording cyclic voltammograms after storage for one week in a moist chamber at 4 °C (Fig. S2†). The results showed a similar profile in both voltammograms (before and after storage), with a slight modification in peak potentials without significant variation in the peak currents (Ipa and Ipc), indicating good stability.
3.3. Optimization of analytical parameters
The influence of experimental parameters that affect the Ab-PfHRP2/DHP/GE electrochemical immunosensor performance in biological samples was investigated in a 100 ng mL−1 Ag-PfHRP2 standard solution using DPV. The Ab-PfHRP2 concentration in the solution employed for the immobilization into the DHP modified electrode surface was optimized. The concentration was varied from 0.01 to 0.07 μg μL−1 Ab-PfHRP2, and the current response decreased with the increase in the antibody concentration until 0.05 μg μL−1 Ab-PfHRP2 (Fig. 4a). No further current decrease was noticed at higher Ab-PfHRP2 concentrations, hence 0.05 μg μL−1 Ab-PfHRP2 was adopted as optimum concentration for the Ab-PfHRP2 immobilization.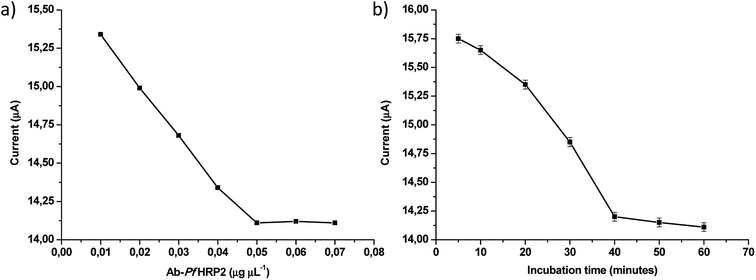 | ||
| Fig. 4 (a) Optimization of Ab-PfHRP2 immobilization concentration, (b) optimization of Ag-Ab-PfHRP2 incubation time. | ||
The Ag-Ab-PfHRP2 incubation time was also optimized in the interval from 10 to 60 minutes, and the results are shown in Fig. 4b. A continuous decrease in the current response was noticed up to 40 minutes of incubation, and the signal remained constant for longer times. Accordingly, 40 minutes was used for antigen–antibody binding as the optimum interaction time between the immune reagents.
Other parameters such as optimum pH for the analytical determination and DHP polymer concentration employed for the Ab-PfHRP2 immobilization were used, according to Ardila et al.29
3.4. Immunosensor analytical performance
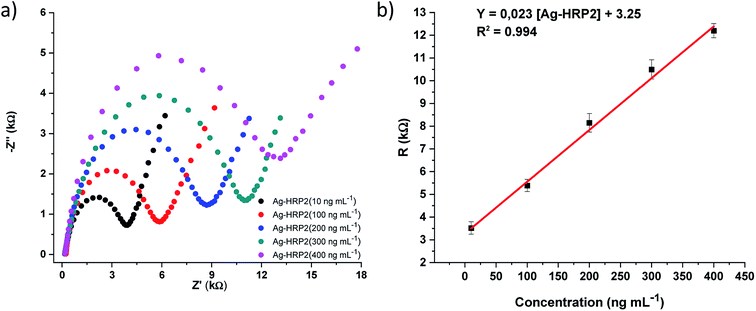
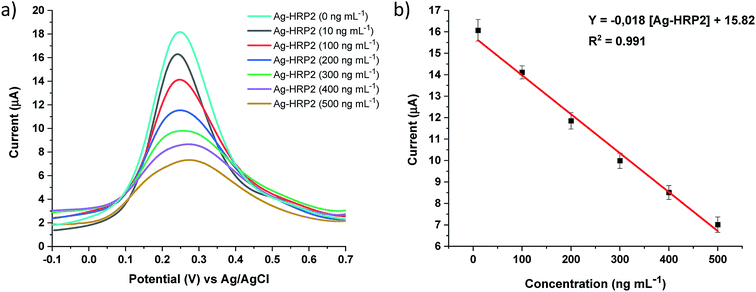
The analytical performance of the immunosensor was examined with Ag-PfHRP2 standard solutions (n = 8) at different concentrations: 1, 10, 100, 200, 300, 400, 500, and 750 ng mL−1 in 0.1 mol L−1 PBS pH 7.00. Fig. 5 shows the EIS spectra for several Ag-PfHRP2 concentrations from 10 to 400 ng mL−1. The calibration curve was obtained by plotting resistance (R) (kΩ) versus Ag-PfHRP2 concentration (ng mL−1). The calibration curve was defined as R (kΩ) = 0.023 [Ag-PfHRP2] + 3.25, with R2 = 0.994. The coefficient of variation (CV) for the determination of 100 ng mL−1 Ag-PfHRP2 was 4.95% (n = 5).Similar experiments were repeated using DPV as a detection technique, and a linear relationship was observed from 10 to 500 ng mL−1 Ag-PfHRP2. The calibration curve was obtained by plotting current (μA) versus Ag-PfHRP2 concentration (ng mL−1) and was defined by current (μA) = −0.018 [Ag-PfHRP2] + 15.82, with R2 = 0.991 (Fig. 6). The coefficient of variation (CV) for the determination of 100 ng mL−1 Ag-PfHRP2 was 4.88% (n = 5).
Moreover, results obtained with the electrochemical immunosensor were compared with those of an ELISA test (ESI 3†). The ELISA test showed a linear relationship in the concentration range from 15 to 125 ng mL−1 Ag-PfHRP2. The calibration curve was obtained by plotting optical density (OD) versus Ag-PfHRP2 concentration (ng mL−1) and was defined by OD = 0.01 [Ag-PfHRP2] + 0.24, with R2 = 0.993 (Fig. S3a†). The coefficient of variation (CV) for the determination of 100 ng mL−1 Ag-PfHRP2 was 5.44% (n = 5).
To evaluate the correlation between both methods, Ag-PfHRP2 responses for concentrations from 20 to 120 ng mL−1 were compared, and a linear behavior with a slope of 1.008 was found, indicating good correspondence between the ELISA and the electrochemical immunosensor (EIS detection) (Fig. S3b†).
The detection limit (LOD) was calculated according to the IUPAC recommendations.35 The LOD was found to be 3.3 ng mL−1 and 2.8 ng mL−1 for EIS and DPV, respectively, while the LOD for the ELISA test was 5.5 ng mL−1. The total assay time for the Ag-PfHRP2 determination was 45 minutes, much less than the one usually required for the conventional ELISA test (180 minutes).36
To evaluate the analytical applicability of the electrochemical immunosensor, Ag-PfHRP2 was quantified in seven negative spiked human serum samples by DPV and EIS techniques. Results were compared with those obtained with the ELISA test. A good correlation between results for spiked Ag-PfHRP2 samples can be observed in Table 1. Hence, the developed immunosensor can be considered as selective towards the interferences present in the samples. The dynamic concentration range for Ag-PfHRP2 detection using the electrochemical immunosensor is very large, therefore the device is useful to monitor both non-severe and severe malaria, as values greater than 100 ng mL−1 are typically associated with severe malaria.37,38
| Samplesa | EISb | DPVc | ELISA |
|---|---|---|---|
| a Ag-PfHRP2 human serum samples (ng mL−1).b Electrochemical impedance spectroscopy.c Differential pulse voltammetry. | |||
| 0 | 0.01 ± 0.01 | 0.01 ± 0.01 | 0.02 ± 0.02 |
| 10 | 10.1 ± 0.5 | 10.2 ± 0.6 | 9.5 ± 0.4 |
| 50 | 50.3 ± 0.1 | 49.9 ± 0.2 | 51.9 ± 0.3 |
| 100 | 99.8 ± 0.5 | 99.8 ± 0.6 | 102.5 ± 0.6 |
| 200 | 201.1 ± 1.1 | 199.8 ± 1.2 | 197.6 ± 1.5 |
| 300 | 302.2 ± 1.3 | 301.3 ± 1.4 | 303.2 ± 1.8 |
| 400 | 399.1 ± 2.1 | 402.8 ± 2.1 | 403.5 ± 2.5 |
4. Conclusions
The developed electrochemical immunosensor for Ag-PfHRP2 detection offered several attractive advantages like good stability, high selectivity, and sensitivity. The applied analytical method is based on a novel one-step enzyme-free dual electrochemical immunosensor performed by the simple Ab-PfHRP2 immobilization on a gold electrode surface using dihexadecyl phosphate polymer as an immobilization platform. Compared with the conventional method used to detect Ag-PfHRP2, an ELISA test, the electrochemical immunosensor shows better analytical properties, like a wide linear range and a low detection limit. The immunosensor was successfully applied for the Ag-PfHRP2 determination in human serum samples, and the coefficients of intra- and inter-assay variations were less than 5%. The total assay time employed was four times shorter than the time reported for the frequently used ELISA test. The electrochemical immunosensor can be a useful and straightforward tool for biomedical sensing and clinical applications for in situ diagnosis and prognosis of a malaria biomarker determination in human serum samples.Authorship contributions
Ariamna María Dip Gandarilla: conceptualization, investigation, validation, data curation, writing-original draft. Matias Regiart: methodology, investigation, data curation, writing review & editing. Mauro Bertotti: supervision, writing review & editing. Juliane Correa Glória: methodology, data curation, validation. Luís André Morais Mariuba: investigation, supervision. Walter Ricardo Brito: conceptualization, supervision, writing review & editing, project administration.Conflicts of interest
There are no conflicts to declare.Acknowledgements
The authors would like to thank for the financial support to Universidade Federal do Amazonas (UFAM), Coordenação de Aperfeiçoamento de Pessoal de Nível Superior (CAPES), Fundação de Amparo à Pesquisa do Estado do Amazonas (FAPEAM), Fundação de Amparo à Pesquisa do Estado de São Paulo (FAPESP) (2019/06293-6, 2018/08782-1), and Bio-manguinhos-FIOCRUZ (edital InovaBio).References
- World Health Organization, World Malaria Report 2019, World Health Organization, Geneva, 2019 Search PubMed.
- P. K. Sarkar, G. Ahluwalia, V. K. Vijayan and A. Talwar, J. Intensive Care Med., 2010, 25, 93–103 CrossRef.
- J. H. Kattenberg, E. A. Ochodo, K. R. Boer, H. D. Schallig, P. F. Mens and M. M. Leeflang, Malar. J., 2011, 10, 1–18 CrossRef.
- K. V. Ragavan, S. Kumar, S. Swaraj and S. Neethirajan, Biosens. Bioelectron., 2018, 105, 188–210 CrossRef CAS.
- Z. Ghayour Najafabadi, H. Oormazdi, L. Akhlaghi, A. Reza Meamar, M. Nateghpour, L. Farivar and E. Razmjou, Acta Trop., 2014, 136, 44–49 CrossRef CAS.
- P. L. Chiodini, K. Bowers, P. Jorgensen, J. W. Barnwell, K. K. Grady, J. Luchavez, A. H. Moody, A. Cenizal and D. Bell, Trans. R. Soc. Trop. Med. Hyg., 2007, 101, 331–337 CrossRef CAS.
- P. Jain, B. Chakma, S. Patra and P. Goswami, BioMed Res. Int., 2014, 2014, 1–20 CrossRef.
- A. Hemben and J. Ashley, Biosensors, 2017, 7, 28 CrossRef.
- B. Paul, A. K. Panigrahi, V. Singh and S. G. Singh, Analyst, 2017, 142, 2128–2135 RSC.
- B. Chakma, P. Jain, N. K. Singh and P. Goswami, Electroanalysis, 2018, 30, 1839–1846 CrossRef CAS.
- D. X. Liu, T. T. T. Tien, D. T. Bao, N. T. P. Linh, H. Park and S. J. Yeo, J. Biomed. Nanotechnol., 2019, 15, 204–211 CrossRef CAS.
- Y. K. Low, J. Chan, G. V Soraya, C. Bu, C. D. Abeyrathne, D. H. Huynh, E. Skafidas and P. Kwan, Sensors, 2019, 19, 2446 CrossRef CAS.
- A. Hemben, J. Ashley and I. E. Tothill, Talanta, 2018, 187, 321–329 CrossRef CAS.
- E. E. Dzakah, K. Kang, C. Ni, H. Wang, P. Wu, S. Tang, J. Wang, J. Wang and X. Wang, Malar. J., 2013, 12, 1–8 CrossRef.
- J. Raman, C. S. Ashok, S. I. N. Subbayya, R. P. Anand, S. T. Selvi and H. Balaram, FEBS J., 2005, 272, 1900–1911 CrossRef CAS.
- N. K. Singh, P. D. Thungon, P. Estrela and P. Goswami, Biosens. Bioelectron., 2019, 123, 30–35 CrossRef CAS.
- O. R. Obisesan, A. S. Adekunle, J. A. O. Oyekunle, T. Sabu, T. T. I. Nkambule and B. B. Mamba, Front. Chem., 2019, 7, 1–15 CrossRef.
- S. Guerrero, L. Agüí, P. Yáñez-Sedeño and J. M. Pingarrón, Talanta, 2019, 193, 139–145 CrossRef CAS.
- F. S. Felixa and L. Angnes, Biosens. Bioelectron., 2018, 102, 470–478 CrossRef.
- S. Hassani, M. Rezaei Akmal, A. Salek-Maghsoudi, S. Rahmani, M. Reza Ganjali, P. Norouzi and M. Abdollahi, Biosens. Bioelectron., 2018, 120, 122–128 CrossRef CAS.
- S. Song, H. Xu and C. Fan, Int. J. Nanomed., 2006, 1, 433–440 CrossRef CAS.
- K. Brince Paul, S. Kumar, S. Tripathy, S. R. K. Vanjari, V. Singh and S. G. Singh, Biosens. Bioelectron., 2016, 80, 39–46 CrossRef CAS.
- A. Sassolas, L. J. Blum and B. D. Leca-Bouvier, Biotechnol. Adv., 2012, 30, 489–511 CrossRef CAS.
- B. C. Janegitz, M. Baccarin, P. A. Raymundo-Pereira, F. A. Dos Santos, G. G. Oliveira, S. A. S. Machado, M. R. V. Lanza, O. Fatibello-Filho and V. Zucolotto, Sens. Actuators, B, 2015, 220, 805–813 CrossRef CAS.
- F. Campanhã Vicentini, L. L. Garcia, L. C. Figueiredo-Filho, B. C. Janegitz and O. Fatibello-Filho, Enzyme Microb. Technol., 2016, 84, 17–23 CrossRef.
- N. Bortolucci Simioni, G. G. Oliveira, F. Campanhã Vicentini, M. R. V. Lanza, B. C. Janegitz and O. Fatibello-Filho, Diamond Relat. Mater., 2017, 74, 191–196 CrossRef.
- F. Campanhã Vicentini, A. E. Ravanini, T. Almeida Silva, B. C. Janegitz, V. Zucolotto and O. Fatibello-Filho, Analyst, 2014, 139, 3961–3967 RSC.
- L. P. Sousa, L. A. M. Mariuba, R. J. Holanda, J. P. Pimentel, M. E. M. Almeida, Y. O. Chaves, D. Borges, E. Lima, J. L. Crainey, P. P. Orlandi, M. V. Lacerda and P. A. Nogueira, BMC Infect. Dis., 2014, 14, 1–8 CrossRef.
- J. A. Ardila, G. G. Oliveira, R. Antigo Medeiros and O. Fatibello-Filho, Analyst, 2014, 139, 1762–1768 RSC.
- K. Ariga, R. Tanaka, J. I. Kikuchi, M. Higuchi and K. Yamamoto, J. Nanosci. Nanotechnol., 2002, 2, 669–674 CrossRef CAS.
- Y. Wu and S. Hu, Colloids Surf., B, 2005, 41, 299–304 CrossRef CAS.
- G. Ibáñez-Redín, T. Almeida Silva, F. Campanhã Vicentini and O. Fatibello-Filho, Enzyme Microb. Technol., 2018, 116, 41–47 CrossRef.
- I. Tubía, J. Paredes, E. Pérez-Lorenzo and S. Arana, Biosens. Bioelectron., 2018, 102, 432–438 CrossRef.
- A. Bard and L. Faulkner, Electrochemical Methods Fundamentals and Applications, Chemical Industry Press, Beijing, China, 2005 Search PubMed.
- L. A. Currie, Anal. Chim. Acta, 1999, 391, 105–126 CrossRef CAS.
- I. K. Jang, S. Das, R. S. Barney, R. B. Peck, A. Rashid, S. Proux, E. Arinaitwe, J. Rek, M. Murphy, K. Bowers, S. Boadi, J. Watson, F. Nosten, B. Greenhouse, P. L. Chiodini and G. J. Domingo, Malar. J., 2018, 17, 1–8 CrossRef.
- I. C. E. Hendriksen, L. J. White, J. Veenemans, G. Mtove, C. Woodrow, B. Amos, S. Saiwaew, S. Gesase, B. Nadjm, K. Silamut, S. Joseph, K. Chotivanich, N. P. J. Day, L. Von Seidlein, H. Verhoef, H. Reyburn, N. J. White and A. M. Dondorp, J. Infect. Dis., 2013, 207, 351–361 CrossRef CAS.
- Y. E. Castro-Sesquen, C. Kim, R. H. Gilman, D. J. Sullivan and P. C. Searson, Am. J. Trop. Med. Hyg., 2016, 95, 354–357 CrossRef CAS.
Footnote |
| † Electronic supplementary information (ESI) available. See DOI: 10.1039/d0ra08729g |
| This journal is © The Royal Society of Chemistry 2021 |

