
 Open Access Article
 This Open Access Article is licensed under a
 Creative Commons Attribution 3.0 Unported Licence
Developing iron-based anionic redox couples for thermogalvanic cells: towards the replacement of the ferricyanide/ferrocyanide redox couple†
Mark A.
Buckingham
 ,
Kristine
Laws
,
Edward
Cross
,
Andrew J.
Surman
and
Leigh
Aldous
*
,
Kristine
Laws
,
Edward
Cross
,
Andrew J.
Surman
and
Leigh
Aldous
*
Department of Chemistry, Britannia House, King's College London, London, SE1 1DB, UK. E-mail: leigh.aldous@kcl.ac.uk
First published on 20th October 2021
Abstract
Thermogalvanic devices can harvest wasted thermal energy; a waste product that is generated by humanity in staggering abundance. However, the incorporation of thermogalvanic devices in applications from hot, industrial environments through to waste body heat harvesting necessitates safe chemicals. In particular, since the redox active ions are the charge carriers the chemistry of these is crucial; the bigger and more powerful the device, the greater the abundance of these chemicals. The anionic ferricyanide/ferrocyanide ([Fe(CN)6]3−/4−) redox couple is arguably the most widely utilised and investigated thermogalvanic electrolyte, but has inherent (in)stability issues, and therefore safety issues. This study has investigated a wide range of anionic polycarboxylate and polyaminocarboxylate ligands in conjunction with iron(II/III) chloride (FeCl2/3) in an effort to develop a safer [Fe(CN)6]3−/4−-replacement. Detailed electrochemical and spectroscopic characterisation was used across the wide range of ligands investigated, and several were found to be viable for use in thermogalvanic cells. In particular, optimised nitriloacetic acid was found to yield a redox-active complex, [Fe(NTA)2]3−/4−, with a good Seebeck coefficient (−1.35 mV K−1) on par with [Fe(CN)6]3−/4−. However, diethylenetriaminepentaacetic acid (to form [Fe(DEPTA)]2−/3−) demonstrated the optimum compromise between thermodynamic and kinetic properties; this was used to prepare an in-series thermogalvanic device with the parent Fe2+/3+ species. Benchmarking against relative costs, and the principles of green chemistry and green chemical engineering was used to identify the relative merits of the different systems.
Introduction
Thermogalvanic cells and thermoelectric devices can generate electricity from temperature gradients.1–3 This is an important attribute, given the vast amounts of energy that are lost by most human activities as un-utilised low grade waste heat.4 Whereas thermoelectric devices are typically composed entirely of semiconducting materials5 prepared from increasingly rare and expensive elements,6,7 thermogalvanic cells are primarily aqueous in nature. They utilise entropy-differences in redox states to drive redox chemistry; thus, a temperature gradient across a redox-active electrolyte and two electrodes can generate electricity, in an effect analogous to the classical Seebeck effect. The difference in entropy between the two redox ions (ΔSrc) can be modified by researchers by altering the size and charge of the redox active species, and this effects the magnitude of the thermogalvanic driving force, as shown in eqn (1);1 | (1) |
The Seebeck coefficient can either be positive or negative, which in simple redox couples is based upon whether the oxidised or reduced species has the higher charge density; positive Se systems typically correspond to redox couples such as Fe2+/3+,8–11 and [Co(bpy)3]2+/3+,12,13 where the oxidised species has the higher charge and thus the lower entropy (due to increased interaction with the bulk solvent), driving reduction at the hotter electrode. For negative Se systems such as the extensively-employed [Fe(CN)6]3−/4−,14–23 the reduced species has the higher charge, and thus oxidation occurs at the hotter electrode. This difference in sign of Se relates to the direction of the flow of current,24,25 and is a key aspect in combining multiple cells into more powerful waste heat harvesting devices without introducing a thermal short-circuit.24
Combinations of cells with opposite Se signs has frequently entailed an acidified Fe2+/3+ cell adjacent to a [Fe(CN)6]3−/4− cell.9,10,16,24–26 However, we have recently highlighted how hazardous this particular combination is in the case of any accidental mixing.5 This is due to instability of the [Fe(CN)6]3−/4− redox couple towards acidic environments,27–29 which has the potential to release highly toxic HCN(g).29 Efforts have therefore been directed to excluding cyanide, while maintaining earth-abundant iron in both cells, although notably anionic iron-redox couples are exceedingly scarce relative to cationic ones.30 Recently, the concentration of counter-ions such as sulphate was controlled to achieve Fe(II/III) redox couples with switchable positive/negative Se; these benign and non-hazardous redox couples can even be mixed but still operate (safely) as a thermogalvanic device.5
In this study, we have investigated a wide range of anionic ligands (polycarboxylate and polyaminocarboxylate) in conjunction with Fe2+/3+ to achieve stable anionic Fe(II/III) complexes with the necessary thermodynamics and kinetics required to operate in a thermogalvanic cell. All ligands chosen were inherently safe and ‘green’, and by binding with Fe(II/III) they likely reduce the toxicity of the free iron cations. A range of results were observed, but ultimately the Se of FeCl2/Cl3 (+1.1 mV K−1) could be inverted to −1.35 mV K−1 by complexation with nitriloacetic acid, putting it on par with the standard anionic [Fe(CN)6]3−/4− redox couple (ca. −1.4 mV K−1). Detailed electrochemical and spectroscopic characterisation was performed, and finally a combined thermogalvanic device comprised of Fe2+/3+ and [Fe(DEPTA)]2−/3− cells was developed, which demonstrated inherently improved safety and green chemistry credentials relative to devices using Fe2+/3+ and [Fe(CN)6]3−/4−.
Experimental
Chemicals
All chemicals were purchased from UK suppliers and used as received unless otherwise specified. These were: iron(III) chloride hexahydrate (Honeywell, 97%), iron(II) chloride tetrahydrate (Sigma Aldrich, ≥99.0%), acetic acid (HAc, Alfa, 99+%), sodium acetate (NaAc, Sigma Aldrich, ≥99%), oxalic acid (H2Ox, Sigma Aldrich, ≥99%), malonic acid (H2Mal, Sigma Aldrich, 99%), sodium malonate dibasic monohydrate (Na2Mal, Sigma Aldrich), succinic acid (H2Suc, Sigma Aldrich, ≥99.0%), succinate disodium salt (Na2Suc, Sigma Aldrich, 99%), citric acid (H3Cit, Sigma Aldrich, ≥99.5%), sodium citrate tribasic dihydrate (Na3Cit, Sigma Aldrich, ≥99.0%), tricarballylic acid (H3TCB, Alfa Aesar, 98%), 1,2,3,4-butanetetracarboxylic acid (H4BTC, Acros Organics, 99+%), glycine (HGly, Sigma Aldrich, ≥99%), 2-[(carboxymethyl)amino]acetic acid (H2IDA, Fluorochem), 2,2′,2′′-nitriloacetic acid (H3NTA, Fluorochem), ethylenediaminetetraacetic acid disodium salt dihydrate (Na2HEDTA, Sigma Aldrich, 99.0–101.0%), ethylene glycol-bis(β-aminoethylether)-N,N,N′,N′-tetraacetic acid tetrasodium salt (Na4EGTA, Sigma Aldrich, ≥97%), diethylenetriaminepentaacetic acid (H5DEPTA, Acros, 98+%), sodium hydroxide (NaOH, pellets, ≥97%, ChemCruz), potassium carbonate, (K2CO3, >99% ChemCruz), and hydrochloric acid (HCl, ∼37%, Fisher Scientific).Preparation of Fe(ligand) systems
Preparation of the iron-ligand solutions was achieved using one of the three methods below, all using ultrapure water:![[thin space (1/6-em)]](https://www.rsc.org/images/entities/char_2009.gif) :carboxylate was varied during the semi-optimisation, the corresponding equivalents was altered by changing the mass of solid(s) or liquid(s) added.
:carboxylate was varied during the semi-optimisation, the corresponding equivalents was altered by changing the mass of solid(s) or liquid(s) added.
Firstly, Fe(II) chloride (1 mL of 0.5 M stock, 1 equivalent) and Fe(III) chloride (1 mL of 0.5 M stock, 1 equivalent) were diluted with ultrapure water (7 mL). Then, the solid IDA carboxylic acid ligand was added in one portion (to make a 200 mM solution, 2 equivalents) and stirred until dissolved. Finally, IDA carboxylate ligand solution (1 mL, 200 mM final concentration, 2 equivalents) was added to the stirring solution. As the ratio of carboxylic acid:carboxylate was varied during the semi-optimisation, the corresponding equivalents were altered by changing the mass of solid carboxylic acid ligand added, or the concentration of the carboxylate ligand solution.
Firstly, Fe(III) chloride solution (1 mL of 0.5 M stock, 1 equivalent) was diluted with ultrapure water (6 mL). Next, the desired carboxylate ligand solution was added (2 mL) and stirred. Finally, Fe(II) chloride solution (1 mL) was added with stirring, resulting in a solution of 50 mM Fe(II), 50 mM Fe(III) and 2 equivalents of ligand per Fe (200 mM).
As the ratio of Fe(II/III):carboxylate was varied during the semi-optimisation, the corresponding equivalents were altered by changing the volume of carboxylate ligand stock added.
For the pH optimisation study on Fe(NTA), Fe(EDTA) and Fe(DEPTA), solid K2CO3 was added to this solution to achieve the desired pH. All pH measurements were taken using a digital pH meter (SciQuip Benchtop 9 Series pH and conductivity meter, SciQuip, UK). These were measured at ambient temperature.
Thermoelectrochemistry
All thermoelectrochemical measurements were performed using two types of tailormade poly(methyl methacrylate) (PMMA) cells, which were made in-house; a two-chamber thermocell and a six-chamber thermocell. The two-chamber thermocell was machined from a single block of PMMA (30 mm (width) × 20 mm (height) × 8.4 mm (depth)) and has been previously reported in detail elsewhere.14 The six-chamber thermocell was machined from a larger block (30 mm (width) × 44 mm (height) × 8.4 mm (depth)) and has also been reported elsewhere.5 Each chamber was a 6.7 mm diameter cylinder (giving a geometric electrode surface area of 35 mm2) and giving an inter-electrode spacing of 7.4 mm. The electrodes were 10 mm diameter circles which were inserted into 0.5 mm deep lips machined around the chambers in the thermocell, and were either solid platinum electrodes (1 mm thick discs with 10 mm diameter, from Surepure Chemetals, USA) or previously characterised amorphous graphite14 (cut into circles by hand). Temperature control was achieved using copper heat exchangers connected to RS-TX150 thermostatic circulator baths (Grant Instruments Ltd, UK), as previously described.14 Notably, some temperature gradients form between the isothermal water sources and the surfaces of the thermogalvanic electrode; this has been previously characterised for our cell,31 such that an applied temperature difference, ΔT, of 20 K, equates to an ‘experienced’ temperature difference of ca. 18 K. The applied (rather than experienced) temperature difference is utilised throughout this manuscript. All potential, current and power measurements were performed using a Keysight B2901A Source Measure Unit and Quick IV software (Keysight, UK). All measurements were allowed to reach steady-state, following precisely the ‘sequence of constant voltages’ method previously reported.31Cyclic voltammetry
Cyclic voltammetric experiments were carried out using a PGSTAT204 potentiostat with NOVA software (Metrohm, UK). The electrochemical setup was either a 1.6 mm diameter Pt or Au disc working electrode, a 1.6 mm diameter Pt disc counter electrode, and an Ag/AgCl (3 M NaCl) reference electrode (all BASi, USA). All scans were recorded at a scan rate of 50 mV s−1, unless specified otherwise. The cyclic voltammetry was performed ex situ to the thermoelectrochemical cell at ambient temperature (ca. 22 °C).Electrochemical impedance spectroscopy
Electrochemical impedance spectroscopy measurements were carried out using a PGSTAT204 potentiostat with NOVA software (Metrohm, UK). These were performed ex situ at ambient temperature (ca. 22 °C) using a 1.6 mm Pt disc working electrode, a 1.6 mm diameter Pt disc counter electrode, and an Ag/AgCl (3 M NaCl) reference electrode (all BASi, USA). Impedance spectra was recorded from 20000 to 0.1 Hz with an amplitude of 10 mV.
Correlations between data sets
Preliminary investigation into correlation between data sets was carried out using scripts in the R environment for statistical computing, and freely-available libraries.32 Correlations plotted in Fig. 5 as r2 were obtained as r (Pearson correlation coefficient, 95% confidence limit) using the “cor” function (a ‘base’ function), and plotted using the “corrplot” library. Scatter plots were produced using the “ggpubr” library, which generated best fit lines and represents 95% confidence limits as ‘shadow’ areas.UV-Vis spectroscopy
All spectra were obtained using iron chloride solutions containing (i) 2.5 mM Fe(II), (ii) 2.5 mM Fe(III), or (iii) 1.25 mM Fe(II) and 1.25 mM Fe(III), with the specified equivalents of carboxylic acid and/or carboxylate. UV-Vis spectroscopy was performed using a Cary 100 UV-Vis and WinUV software (Agilent, UK) between 200–800 nm and with a UV-Vis crossover wavelength of 375 nm, at ca. 20 °C (representing the limiting, cold electrode in the thermocell), using quartz cuvettes with a path length of 1 mm (FireflySci, USA).Structure and binding mode prediction
The ratio of ligands to Fe atoms was known, but most ligands had multiple possible binding sites, including carboxylates, hydroxides and amines. Various structures were drawn in Avogadro (version 1.2.0) covering the range of possible binding modes (e.g. which heteroatoms bind to the iron centre) then energy minimised using the Universal Force Field (UFF). The structures of the lowest energy optimised complexes identified by this route are presented visually in either Fig. S8 or S9 in the ESI.†Results and discussion
Initial screening and (semi)optimisation of the poly-carboxylate and poly-aminocarboxylate ligands
In thermogalvanic cells, anionic redox couples have been prepared by the coordination of Fe2+/3+ with the anionic ligands [CN]− and [SO4]2−, to form the [Fe(CN)6]3−/4− and [Fe(SO4)2]−/2− redox couples, respectively.5 The former possesses inherent risk due to the potentially lethal toxicity of the ligand, whereas the low charge density on the latter results in a significantly lower Seebeck coefficient (Se).5 In an effort to generate highly charged but sustainable and safe redox couples, a range of poly-carboxylate (Fig. 1(a–g)) and poly-aminocarboxylate (Fig. 1(h–m)) ligands were screened. | ||
| Fig. 1 Chemical structures and abbreviated name (and full, common name) for the anionic ligands investigated in this study, covering (a–g) the poly-carboxylate and (h–m) the poly-aminocarboxylate species that were screened. | ||
All of these ligand systems were initially screened and semi-optimised with respect to the ratio of the free carboxylic acid to its sodium carboxylate conjugate base, and the ratio of these ligands towards the Fe salt; this is discussed fully in the ESI (Tables S1–S3†). Briefly, the Ox and Suc carboxylic acid and sodium carboxylate salts (Fig. 1) suffered from solubility issues, precluding them from further study. The BTC and TBC ligands were found to be soluble once neutralised to the carboxylate salt; however, upon addition to the iron salt solution precipitation occurred immediately and were thus no longer considered in this study. Gly demonstrated good solubility as both the free acid and sodium carboxylate salt, but this system only generated positive Seebeck coefficients, and was therefore also removed from the study.
All of the remaining systems (Ac, Mal, Cit, IDA, NTA, EDTA, EGTA and DEPTA) were found to produce an inverted entropy e.g. the positive Se of 0.1 M FeCl2/3 (+1.1 mV K−1) was inverted to a negative Se upon either initial screening or during semi-optimisation. Table 1 summarises all ligand systems investigated, i.e. whether they were soluble and thermogalvanically active, the semi-optimised ratio of free acid to carboxylate base,‡ the thermogalvanic properties (Se, jSC and Pmax) and the pH under semi-optimised conditions. From Table 1, several Fe(ligand) systems stand out with high negative values of the Se; the Fe(Mal), Fe(Cit), Fe(IDA), Fe(NTA) and Fe(DEPTA) all demonstrated a higher Se than our previously reported [Fe(SO4)2]−/2− system (Se = ca. −0.29 mV K−1 for 0.3 M Fe(SO4), 0.3 M Fe(SO4)1.5 and 1.5 M Na2SO4).5
| Ligand (as carboxylate) | Soluble/thermo-galvanically active | Semi-optimised ratio of acid:base |
−Se/mV K−1 | −jSC/A m−2 | P max/mW m−2 | pH |
|---|---|---|---|---|---|---|
| [Ac]− | ✓ | 5:5 |
0.07 ± 0.01 | 0.06 ± 0.01 | 0.02 ± 0.01 | 4.4 |
| [Ox]2− | ✗ | — | — | — | — | — |
| [Mal]2− | ✓ | 5:10 |
0.47 ± 0.01 | 1.09 ± 0.04 | 2.55 ± 0.16 | 4.5 |
| [Suc]2− | ✗ | — | — | — | — | — |
| [Cit]3− | ✓ | 5:5 |
0.40 ± 0.01 | 0.28 ± 0.02 | 0.55 ± 0.02 | 3.8 |
| [TCB]3− | ✗ | — | — | — | — | — |
| [BTC]4− | ✗ | — | — | — | — | — |
| [IDA]2− | ✓ | 2:4 |
0.38 ± 0.01 | 0.98 ± 0.03 | 1.84 ± 0.05 | 3.5 |
| [NTA]3− | ✓ | 0:5 |
0.51 ± 0.01 | 1.24 ± 0.07 | 3.19 ± 0.32 | 8.9 |
| [EDTA]4− | ✓ | 0:2 |
0.20 ± 0.02 | 0.29 ± 0.01 | 0.29 ± 0.04 | 6.8 |
| [EGTA]4− | ✓ | 0:2 |
0.32 ± 0.02 | 0.42 ± 0.05 | 0.67 ± 0.04 | 8.9 |
| [DEPTA]5− | ✓ | 0:2 |
0.44 ± 0.01 | 1.48 ± 0.04 | 3.25 ± 0.16 | 8.9 |
The thermodynamics of the systems are not the only important aspect to be considered here, since the kinetics are also hugely significant for the overall power output of the thermocell. The range of power values demonstrated by the semi-optimised systems is demonstrated clearly by the overlay of the different power curves shown in Fig. 2. Here, the Fe(Mal), Fe(IDA), Fe(NTA) and Fe(DEPTA) all stand out with high power density. Fig. 2 also shows the complex balance between thermodynamics and kinetics of thermocells; for example, the Fe(NTA) and Fe(DEPTA) systems are roughly equivalent in power, but Fe(NTA) has the higher Se value (i.e. better thermodynamics) and Fe(DEPTA) has higher current (i.e. better kinetics).
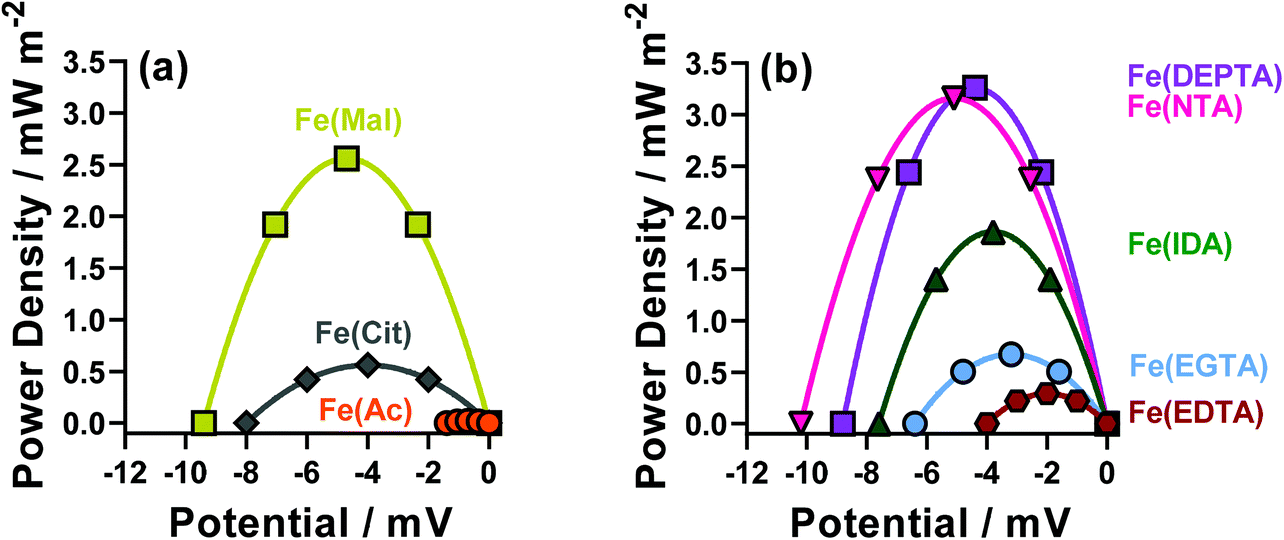 | ||
| Fig. 2 Power curves for the semi-optimised Fe(ligand) systems, for (a) the polycarboxylate ligands acetate (Fe(Ac)), malonate (Fe(Mal)), and citrate (Fe(Cit)) and (b) the poly-aminocarboxylate ligands IDA (Fe(IDA)), NTA (Fe(NTA)), EDTA (Fe(EDTA)), EGTA (Fe(EGTA)) and DEPTA (Fe(DEPTA). | ||
The resulting Seebeck, current and power values from the semi-optimised systems are summarised in Fig. 3; clearly a spectrum of negative Se values are produced by the different ligands (Fig. 3(a)). Typically, higher Se values lead to a higher overpotential driving the redox reaction within the thermocell, leading to higher thermogalvanic current and power,14 but as shown by Fig. 3(b) and (c) (current and power, respectively) the correlation is weak here. Given this observation, the semi-optimised systems were compared using electrochemical and spectroscopic characterisation.
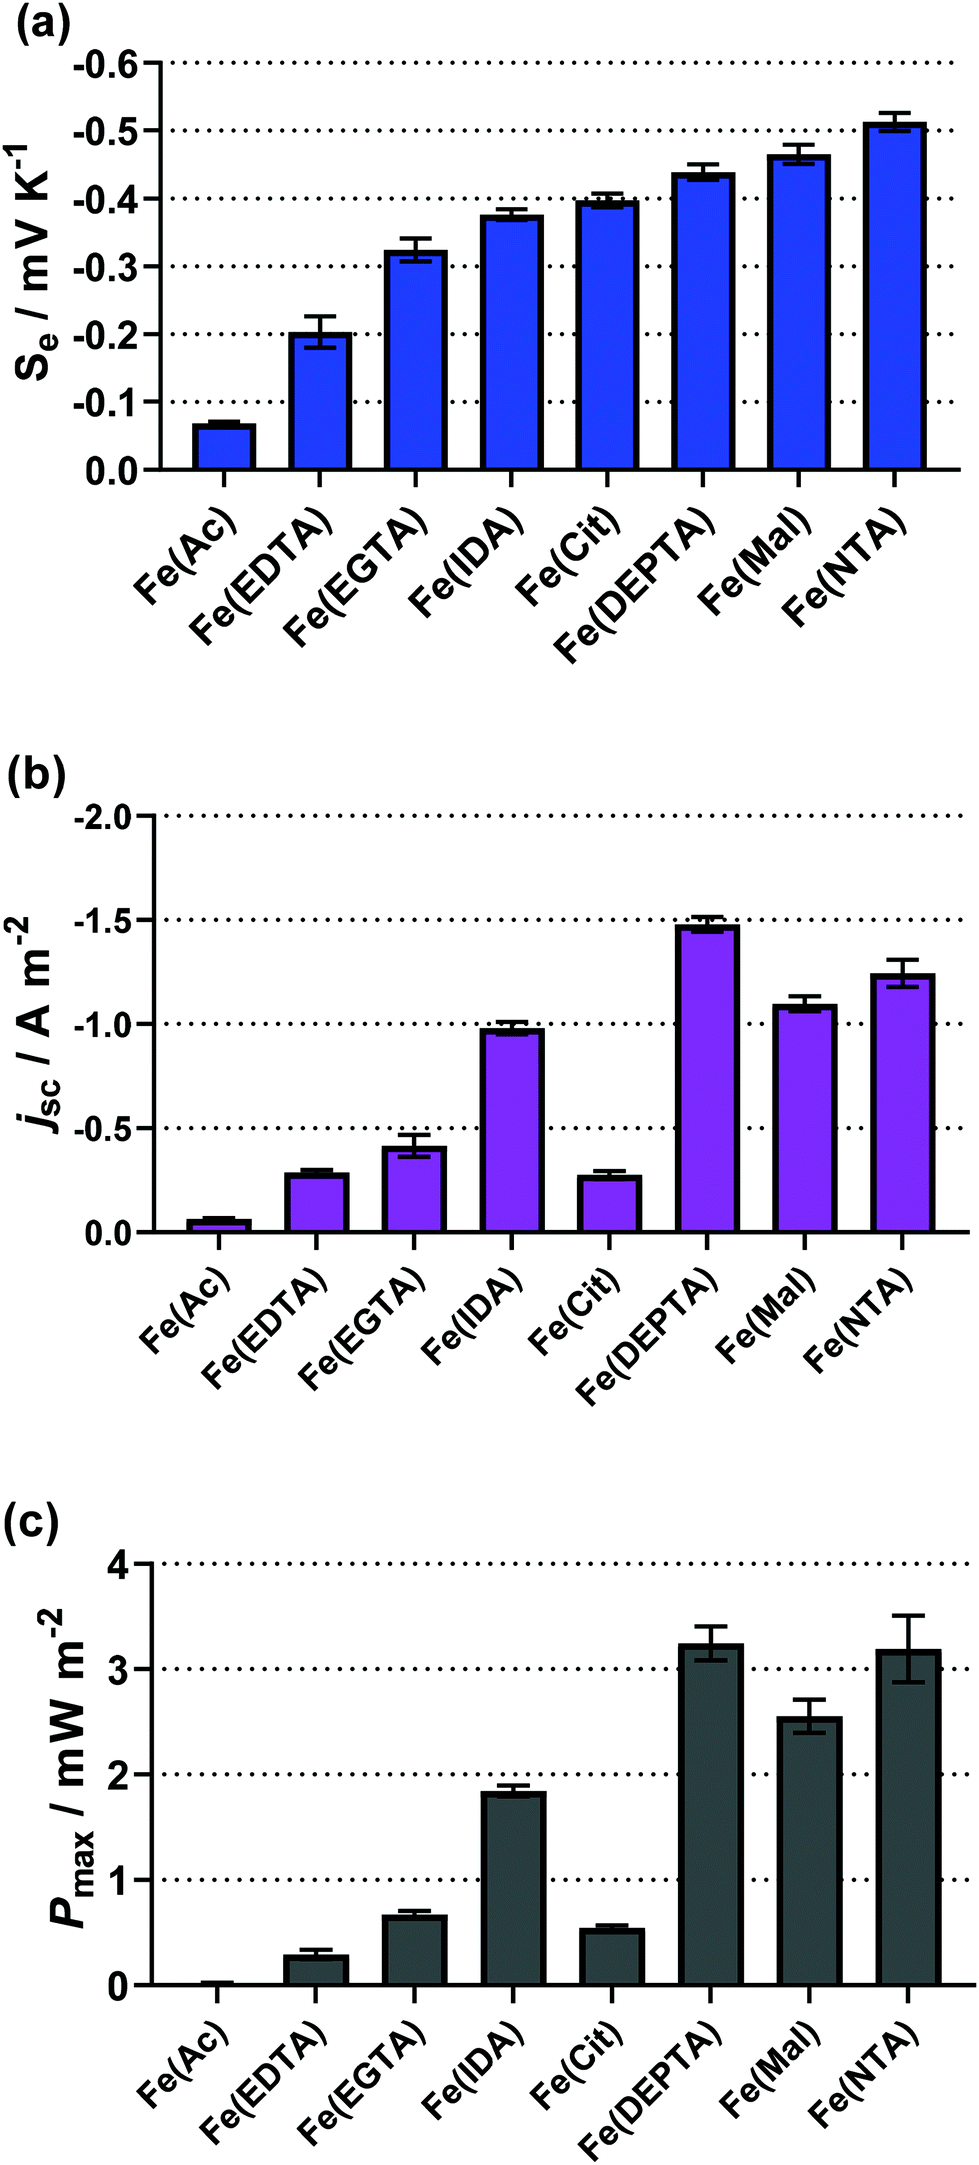 | ||
| Fig. 3 Bar charts showing (a) the observed Seebeck coefficient (Se), (b) the short-circuit current density (jSC) and (c) the maximum power density (Pmax) for the semi-optimised Fe(ligand) systems, visually displaying the values in Table 1. | ||
Cyclic voltammetry and electrochemical impedance spectroscopy
Cyclic voltammograms (CVs) yield significant information regarding the kinetics, thermodynamics and mass transport of redox-active species.33 Therefore, CVs were recorded for the semi-optimised systems on Au electrodes,§ containing 50 mM FeCl2, 50 mM FeCl3, the semi-optimised ligand acid/carboxylate ratio indicated in Table 1, and no other supporting electrolyte. Fig. 4 compares these CVs vs. the equivalent FeCl2/3 system in the absence of any ligand, and the various extracted parameters are summarised in Table 2.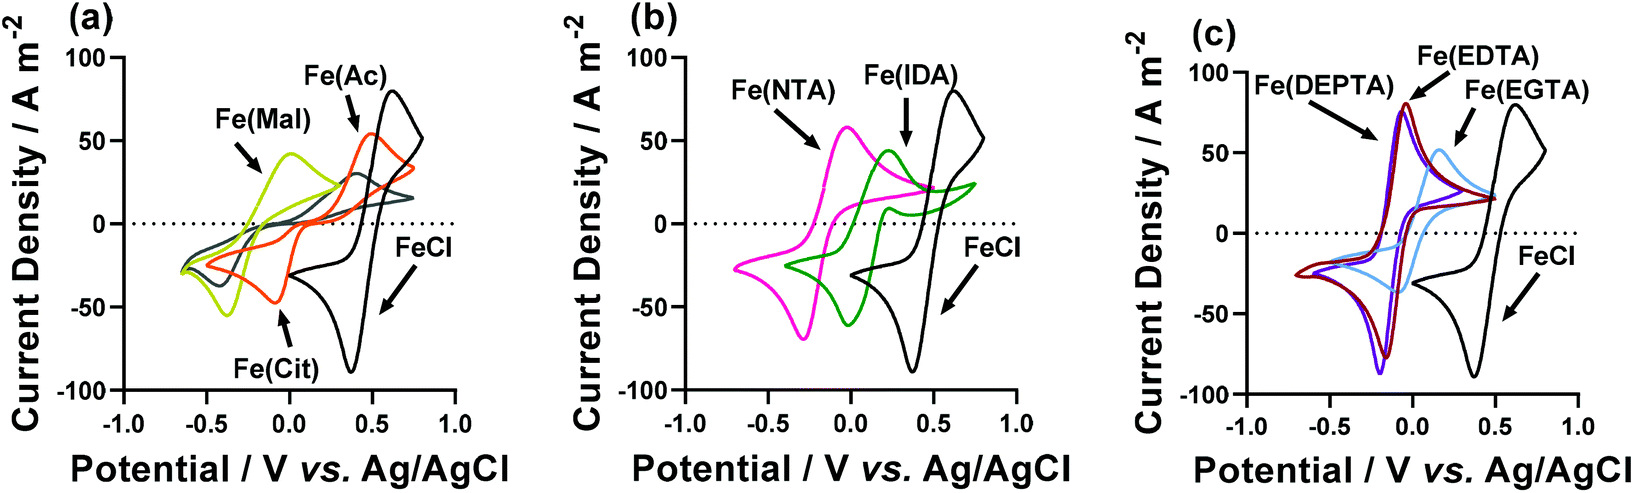 | ||
| Fig. 4 Cyclic voltammograms of (a) Fe(Ac), Fe(Mal) and Fe(Cit), (b) Fe(IDA) and Fe(NTA) and (c) Fe(EDTA), Fe(EGTA) and Fe(DEPTA) redox couples; all are compared to the parent FeCl2/3 species (i.e. 50 mM FeCl2 and 50 mM FeCl3, in the absence of any ligand). All voltammograms were recorded at an Au working electrode, at a scan rate of 50 mV s−1 and ambient temperature. | ||
| Fe(ligand) solution | E 1/2/V vs. Ag/AgCl | ΔE/V | I p(ox)/A m−2 | I p(red)/A m−2 | R S/Ω | R ET/Ω |
|---|---|---|---|---|---|---|
| Parent FeCl2/3 | 0.460 | 0.249 | 80 | −89 | 244 ± 2 | 171 ± 2 |
| Fe(Ac) | 0.102 | 0.579 | 54 | −47 | — | — |
| Fe(Mal) | −0.198 | 0.383 | 42 | −55 | 165 ± 3 | 342 ± 6 |
| Fe(Cit) | −0.070 | 0.828 | 30 | −37 | 220 ± 7 | 3430 ± 117 |
| Fe(IDA) | 0.128 | 0.242 | 44 | −61 | 143 ± 1 | 46 ± 1 |
| Fe(NTA) | −0.167 | 0.310 | 58 | −70 | 122 ± 2 | 255 ± 3 |
| Fe(EDTA) | −0.104 | 0.201 | 81 | −77 | 130 ± 3 | 499 ± 11 |
| Fe(EGTA) | −0.003 | 0.247 | 52 | −37 | 184 ± 4 | 854 ± 16 |
| Fe(DEPTA) | −0.125 | 0.262 | 76 | −87 | 140 ± 1 | 83 ± 1 |
The Fe(Cit) system displayed a high Se, but a very low current density in the thermogalvanic cell (cf.Fig. 3(a) and (b)). The CV demonstrated this system also has a very high ΔE (Fig. 4(a)), indicating that poor electrode kinetics are responsible for the low thermogalvanic current density. Conversely, all the poly-aminocarboxylate complexes (IDA, NTA, EDTA, EGTA and DEPTA) all had ΔE values within 60 mV of the parent FeCl2/3 system; however, the peak current density was either equivalent to that of the parent system (e.g. DEPTA and EDTA), or significantly reduced (e.g. IDA and EGTA). A dynamic coordination environment is tentatively attributed to this observation of significantly lower currents but equivalent ΔE values, with this resulting in an overall broadening of the voltammetric peaks. In an effort to extract more precise kinetic data, the systems were investigated by electrochemical impedance spectroscopy (or EIS).
EIS has been previously utilised to measure the inherent resistances within thermogalvanic cells;5,8,16,17,21,34–38 here EIS analysis was performed ex situ in the three-electrode setup on which the CVs were recorded, using a Pt working electrode to be more comparable to the thermogalvanic results. The extracted solution or mass transport resistance (RS) and electron transfer resistance (RET) are summarised in Table 2.
Unsurprisingly, the RS of all of the ligand systems was found to be lower than that of the parent FeCl2/3 system, given that all contain additional acid and/or carboxylate salts, reducing the ohmic resistance of the solution (and therefore RS).5,8
Regarding the RET, only two systems (the Fe(IDA) and Fe(DEPTA)) were found to have lower RET than the FeCl2/3 system. Conversely, the Fe(EGTA), Fe(EDTA) and Fe(Cit) all had significantly higher RET values. All five demonstrated moderately high Se values but only Fe(DEPTA) was exceptional in power production in the thermogalvanic cell; this demonstrates that EGTA, EDTA and Cit are all kinetically limited. IDA displayed an excellent RET, but did suffer from a significantly reduced current relative to FeCl2/3, suggesting it suffers from either severe mass transport issues or (more likely) coordination dynamics; if dynamic speciation results in multiple species present in solution, the thermogalvanic current represents the fraction of species that are thermogalvanically active, rather than the bulk concentration.8 This is further supported by the extreme sensitivity of the Se value of Fe(IDA) during the semi-optimisation, being able to invert from −0.43 mV K−1 to +0.35 mV K−1 over a narrow range of acid:carboxylate ratios.
The range of Fe(ligand) redox couples investigated demonstrated a wide range of kinetic performances. In thermogalvanic cells, the kinetics (current output) have been routinely improved by increasing electrode surface area, often though the use of nanomaterial-enhanced electrodes.16,17,26,34,37 Current output in a thermocells can also be improved through the use of innovative thermocell design.17 These (electrode-focussed) methods of improving thermocell performance could potentially be used to enhance the output of kinetically limited systems, although that was beyond the scope of this current study.
Potential correlations between thermogalvanic and electrochemical data
Next, the potential for correlation between the electrochemical data (Table 2) and the thermogalvanic data (Table 1) was explored. Currently no means exist to predict thermogalvanic performance (Pmax, jSC, Se) from sets of electrochemical measurements (E1/2, ΔE, Ip,ox, Ip,red, RET, Rs), and discovering predictable relationships would be valuable, given the more ready availability of electrochemical data. The data available in this study is limited, and the Fe(Ac) also had to be excluded due to the impedance data being unquantifiable, reducing it to 7 systems; nevertheless there is a sufficient number of systems to warrant a preliminary investigation into the potential for predictive relationships.Fig. 5(a) displays a correlogram; the circle size and colouring visually represents the linear correlation (r2) between pairs of parameters measured, where larger circles reflect stronger correlation (see “Experimental” for further details). Fig. 5(b–d) demonstrates how linear correlations can be observed between different parameters. Prior to this analysis being undertaken, correlations were already expected within some separate sets of measurements, which were indeed observed. For example, a clear linear correlation between Pmax and jsc reflects the established Pmax = 0.25Sejsc relationship (as shown in Fig. 5(d)). Likewise, ΔE from the cyclic voltammograms correlated with the RET measured by impedance, with both corresponding to electron transfer kinetics.
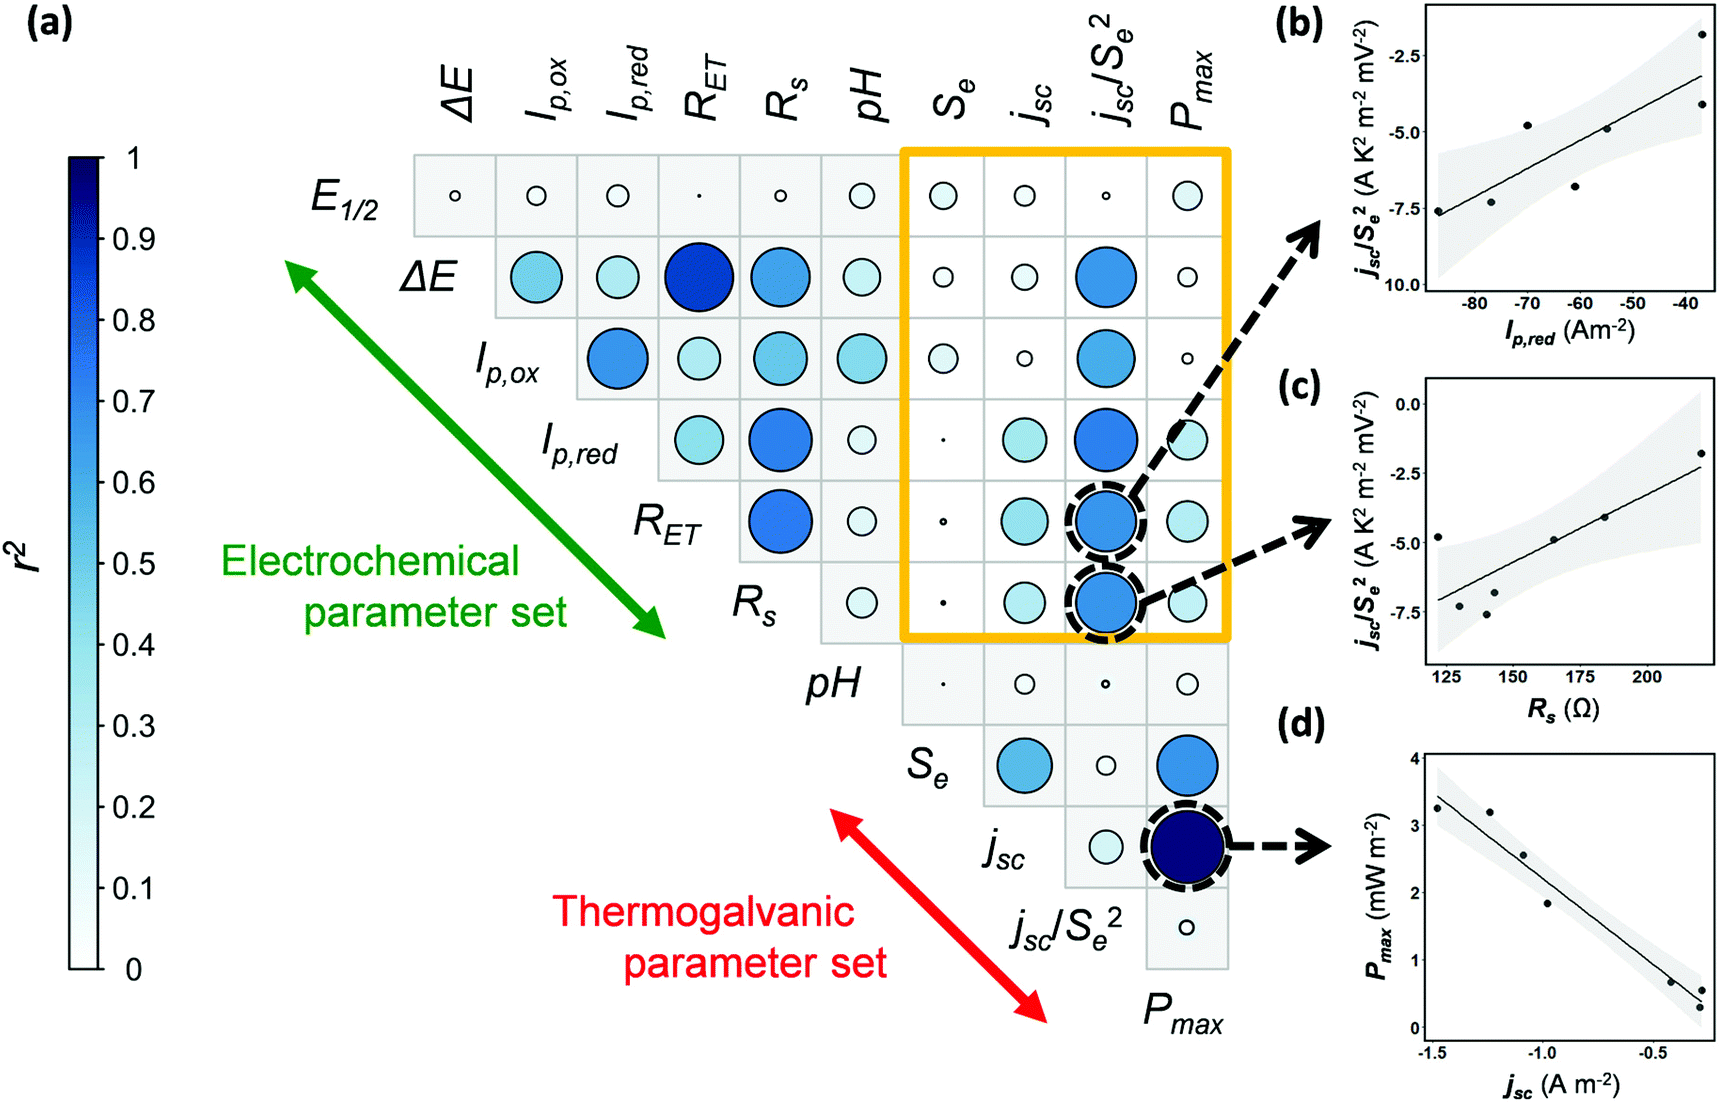 | ||
| Fig. 5 (a) Correlogram exploring correlation between electrochemical and thermogalvanic parameters; the sand-coloured box highlights the range of correlations between the two parameter sets. (b, c and d) Example scatter plots of potential correlation. | ||
The sand-coloured box highlights correlations between the thermogalvanic and electrochemical parameter sets; no linear relationships were known prior to this analysis being undertaken, and little correlation was observed. However, the jsc correlates with concentration, kinetics and the Se (via overpotential),14 hence correlation with an Se-corrected jsc was also explored, as jsc/Se2. Encouragingly this value shows potential correlations with multiple electrochemical parameters relating to current (Ip,ox, Ip,red) and kinetics (ΔE, RET); examples of these are plotted in Fig. 5(b) and (c). While considering the limitations of data available here, these tentative observations raise the possibility that measurements of basic electrochemical properties could be applied to predict and target investigation of thermogalvanic power (via jsc). This is a promising subject for further investigation, especially as high throughput screening and automation (of experimentation and data analysis) become increasingly available to produce larger volumes of data; once larger data sets become available, this kind of multivariate correlation is a promising target for machine learning and related techniques.
Unfortunately, no correlations were observed between the electrochemical values and the Se, hence further investigation focussed upon probing speciation.
Spectroscopic analysis using UV-Vis
A wide range of colours were observed for the different ligand-Fe(II/III) solutions, as demonstrated by the inset photos in Fig. 6. These were therefore investigated by UV-Vis spectroscopy; however, the significant extinction coefficients of the Fe(III) species swamped that of the Fe(II), and also necessitated a 20-fold dilution (from 50 mM FeCl3 down to 2.5 mM FeCl3). The UV-Vis of ligand-Fe(II), ligand-Fe(III), and ligand-Fe(II/III) solutions for all investigated ligands can be found in the ESI (Fig. S6†). Fig. 6 summarises just the UV region of the Fe(III) solutions.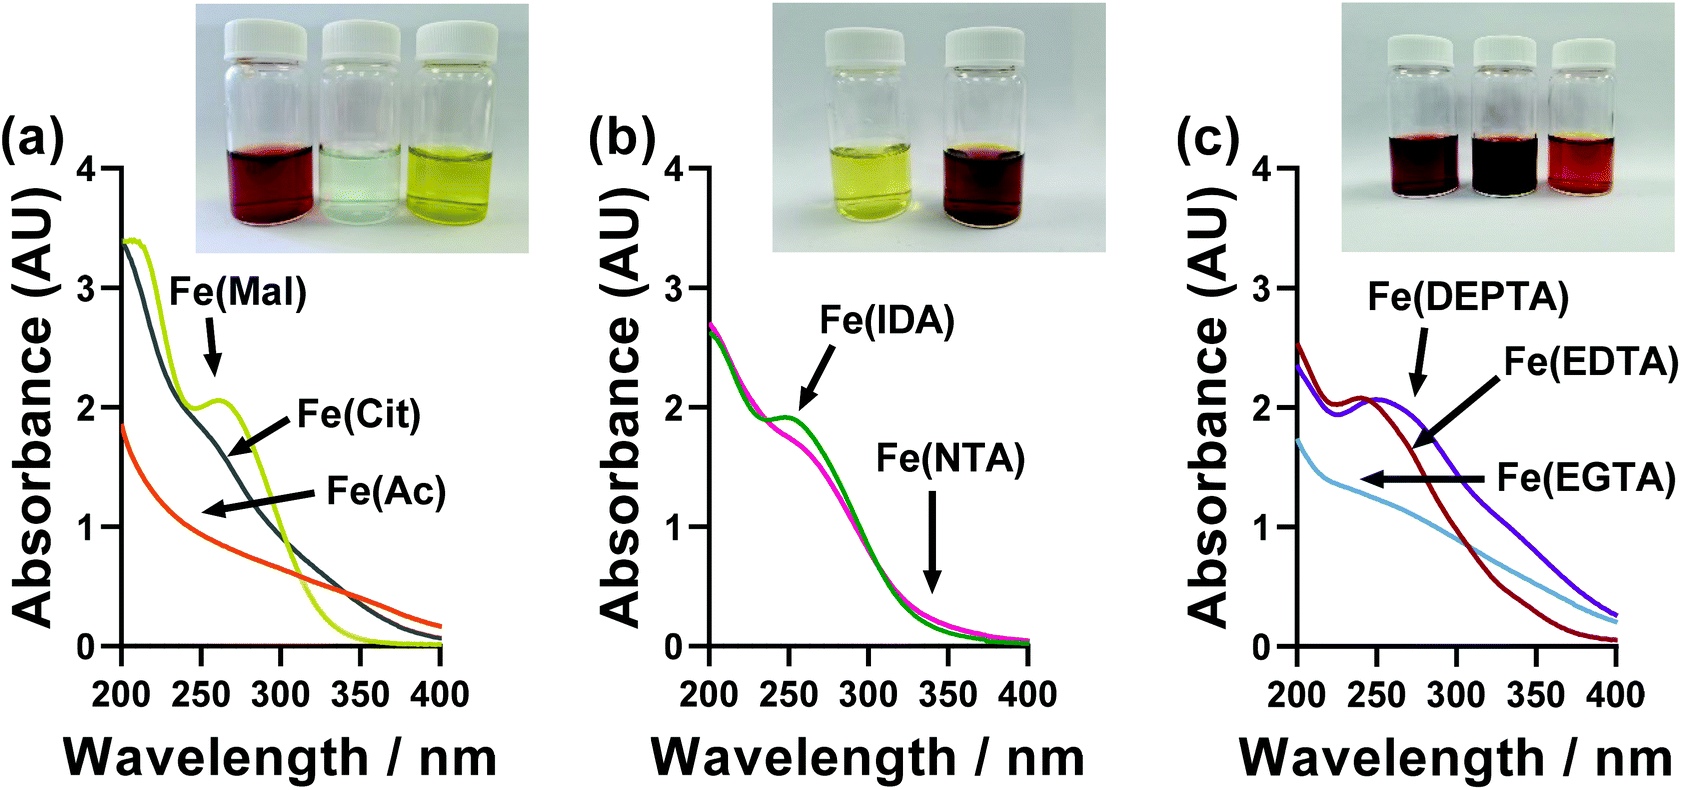 | ||
| Fig. 6 UV-Vis spectroscopic absorption spectra of the semi-optimised Fe(ligand) systems, using only 2.5 mM Fe(III) and a 1 mm pathlength. The data for Fe(II) and Fe(II/III) solutions can be found in Fig. S6.† The inset photographs in each figure are for the 100 mM solutions used in the thermogalvanic measurements, from left to right; Fe(Ac), Fe(Mal), Fe(Cit), Fe(IDA), Fe(NTA), Fe(EDTA), Fe(EGTA) and Fe(DEPTA). | ||
All ligand-Fe(III) solutions displayed a single feature centred on roughly 250 nm, which can be assigned to a π–π* transition, with very variable peak width and sharpness. No quantitative, meaningful data could be extracted from this trend, although it is notable that the systems can be split into those with clearly defined UV absorption peaks (DEPTA, IDA, Mal, EDTA) vs. those with very poorly defined peaks or simply shoulders (Ac, Cit, EGTA, NTA) which qualitatively overlaps with those with RET values less than double (DEPTA, IDA, Mal, NTA) vs. more than double (Ac, Cit, EGTA, EGTA) that of the parent FeCl2/3 system. This again suggests more strongly defined and less dynamic speciation correlates with improved electrochemical and therefore thermogalvanic properties.
Speciation determination and the significant effect of pH
A proportional relationship exists between ΔSrc (calculated from the observed Se, eqn (1)) and (ZOx2 − ZRed2)/r.30,39 Since ΔSrc is known via the Se, this relationship can be used to estimate the formal ionic charge of the redox-active compounds, i.e. ZOx and ZRed. This has been previously utilised in thermogalvanic reports.5Initially, the previously reported redox couples of [Fe(H2O)6]2+/3+, [Fe(HSO4)]+/2+, [Fe(SO4)]0/+, [Fe(SO4)2]−/2− and [Fe(CN)6]3−/4−,5 were all plotted (Fig. 7(a), red circles) and fell along the expected linear trend. Next, the ΔSrc of the Fe-ligand systems was calculated from the Se (Fig. 2(a)), and were also plotted. The Fe(Ac) system could only be rationally fit on the linear relationship if ZOx = 0 and ZRed = −1, allowing speciation to be rationalised as [Fe(Ac)3]0/−. Other ligands fit well on the trend for ZOx = −1 and ZRed = −2, allowing tentative assignment as [FeCit]−/2−, [Fe(Mal)2]−/2−, [Fe(IDA)2]−/2− and [Fe(EGTA)2]−/2−.
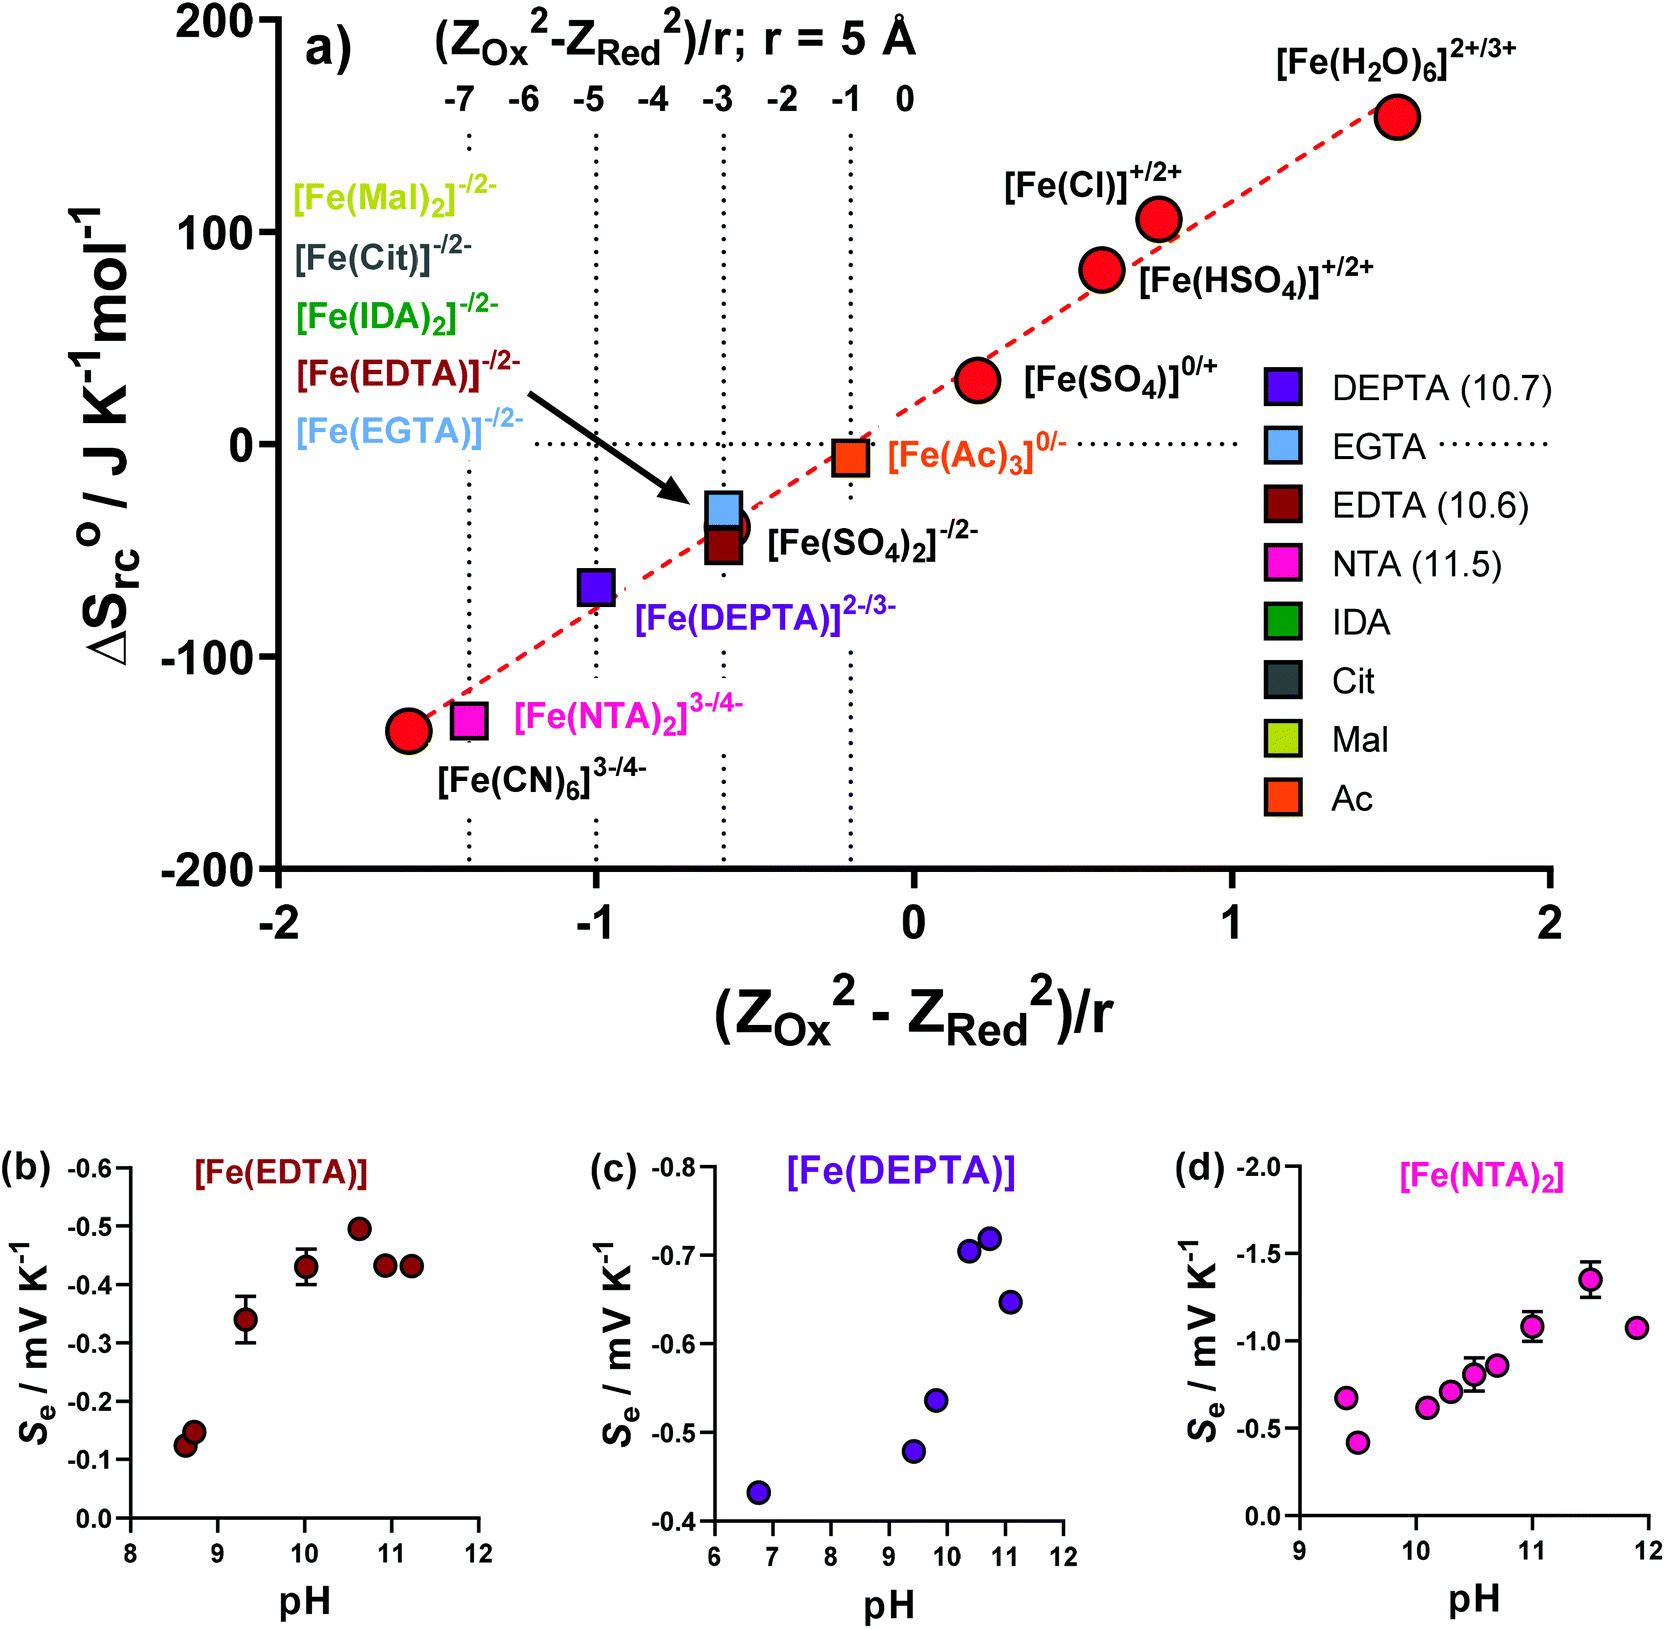 | ||
| Fig. 7 Showing (a) a plot of ΔSrcvs. (ZOx2 − ZRed2)/r for previously reported aqueous Fe(II)/Fe(III) redox systems (red circles) and all Fe(ligand) solutions investigated here (coloured squares). The dotted lines indicate the (ZOx2 − ZRed2) values of 0/−1, −1/−2, −2/−3 and −3/−4 redox couples (using r = 5 Å). From these the likely ionic charge changes in the redox couples have been put next to the complex, e.g. [Fe(NTA)2]3−/4−. The values for Fe(EDTA), Fe(DEPTA) and Fe(NTA) were the pH optimised values (pH values specified in brackets in the legend); (b), (c) and (d) plot the observed trends in Sevs. pH for these three, respectively, using an applied ΔT = 20 K. pH modification was achieved by the direct addition of solid K2CO3 to the semi-optimised systems. | ||
Three systems, Fe(EDTA), Fe(NTA) and Fe(DEPTA), could not be rationalised with any corresponding ZOx and ZRed combination (as shown in Fig. S7†). Theorising that this could be due to an acid–base equilibrium existing between free carboxylic acid groups, the solutions were increasingly raised in pH by the addition of K2CO3, with the Se measured. These results are shown in Fig. 7(b–d), where all three systems show the same trend; the Se increased with pH before decreasing at highly alkaline conditions. The latter observation is attributed to [OH]− beginning to displace the ligands. The highest obtained Se values were successfully able to fit on the linear plot as [Fe(EDTA)]−/2−, [Fe(DEPTA)]2−/3− and [Fe(NTA)2]3−/4−, as shown in Fig. 7(a). Significantly, when pH optimised the [Fe(NTA)2]3−/4− displays a Se coefficient (−1.35 mV K−1) on par with the current standard but flawed redox couple, [Fe(CN)6]3−/4− (ca. −1.4 mV K−1),3,14,16 which is an important first step in replacing [Fe(CN)6]3−/4− with a non-hazardous alternative.5
Given integer ionic charges had been estimated from the thermoelectrochemistry, only a few logical coordination structures were viable. These were modelled as their energy minimised conformational structures; an important caveat is that this preliminary modelling was performed in the absence of solvent molecules and counter ions, and such models were relatively insensitive to changes of the redox state. Nevertheless, the models were useful in probing ligand stoichiometry as well as likely binding sites. The lowest energy conformers identified by the modelling are shown in Fig. 8 for [Fe(DEPTA)]2−/3− and [Fe(NTA)2]3−/4−, and Fig. S8† for all other Fe-ligand complexes.
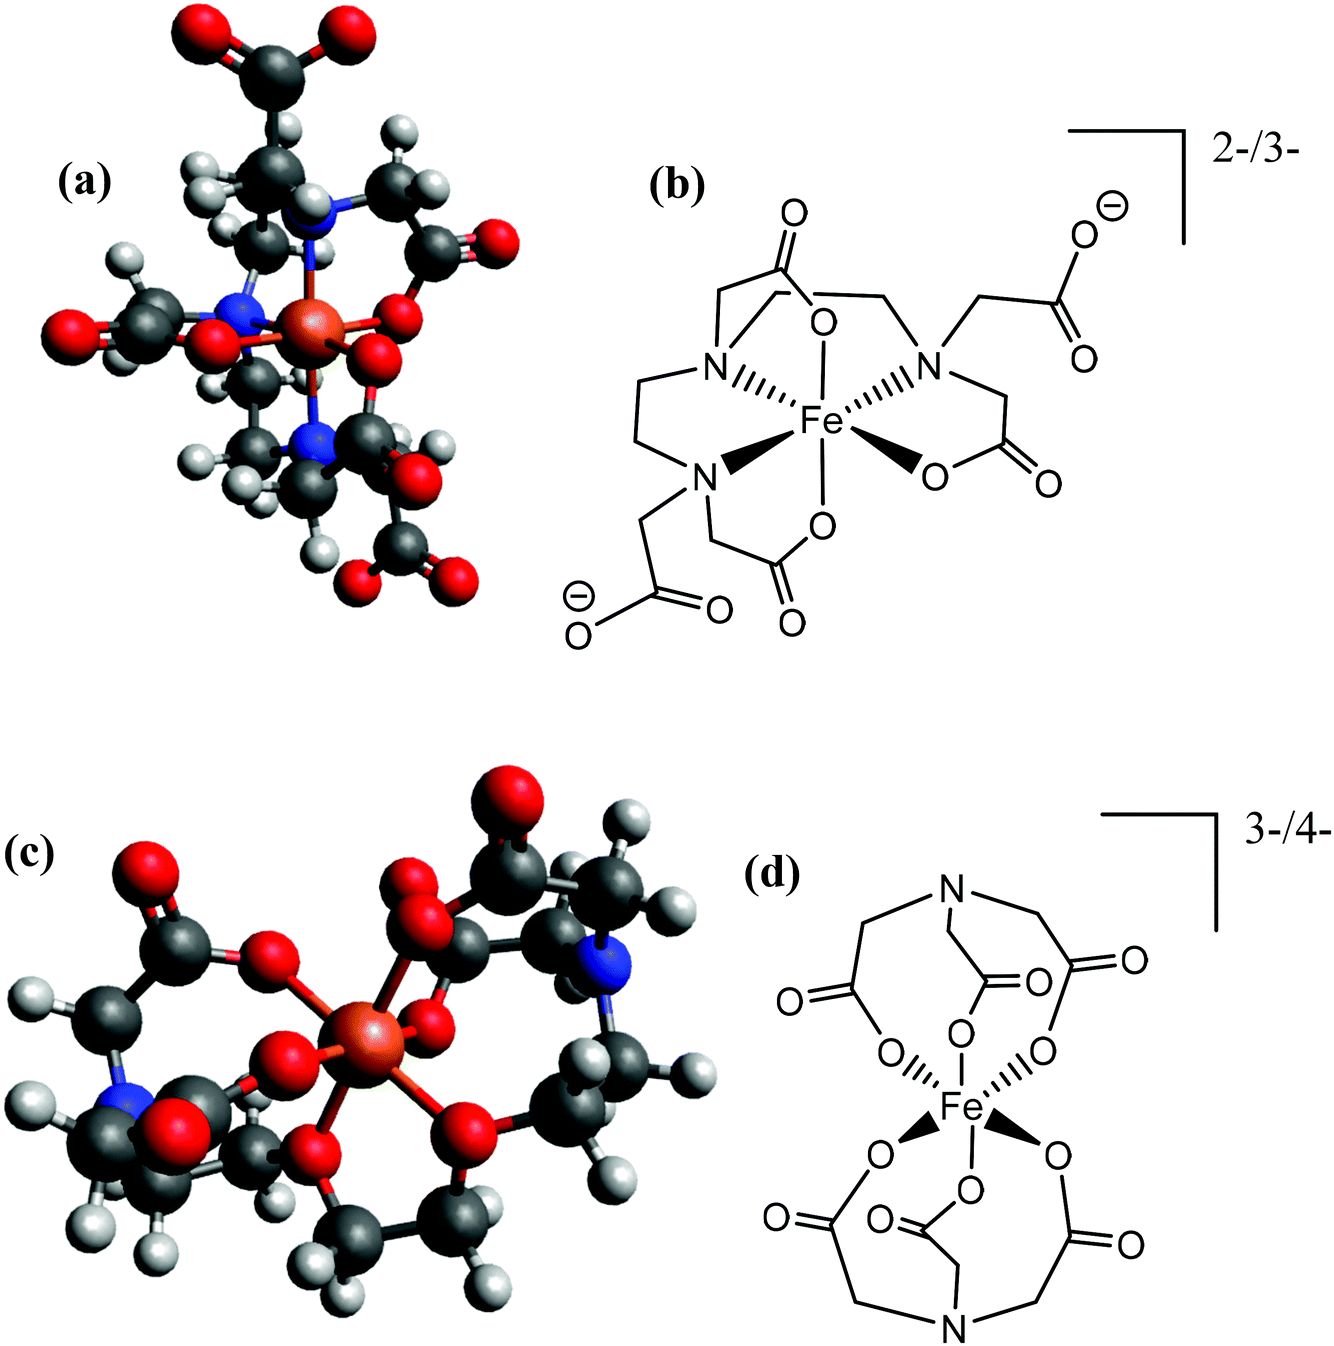 | ||
| Fig. 8 Showing (a and c) energy minimised and (b and d) the equivalent skeletal structures of the (top) [Fe(DEPTA)]2−/3− and (bottom) [Fe(NTA)2]3−/4−. | ||
With respect to the [Fe(Ac)3]0/− system, this is likely to be the only ligand to act as a true bidentate ligand, preventing the coordination of further acetate ligands, and the modelling supported this. Results from modelling the Fe(Cit) indicated that binding through the deprotonated hydroxy group and all three carboxylates is the lowest energy conformer. The iron centre in the [Fe(Cit)]−/2− and [Fe(Mal)2]−/2− systems are likely to bind water molecules as mono-dentate ligands (Fig. S8†); further coordination of [Mal]2− or [Cit]4− would likely form [Fe(Mal)3]3−/4− and [Fe(Cit)2]5−/6− complexes, which were desirable but apparently could not be formed in significant abundance due to steric and electrostatic repulsion. For the IDA, NTA, EDTA, EGTA and DEPTA ligands, the proposed [Fe(IDA)2]−/2−, [Fe(NTA)2]3−/4−, [Fe(EDTA)]−/2−, [Fe(EGTA)]−/2− and [Fe(DEPTA)]2−/3− redox couples correspond to the ligands acting as 6-coordinate hexadentate ligands, which is consistent with prior literature reports.40 Modelling suggests that [Fe(DEPTA)]2−/3− coordinates through the N, leaving two free carboxylates (Fig. 8(a and b)), whereas for [Fe(NTA)2]3−/4− any coordination through the N could not be energetically rationalised (cf.Fig. 8(c and d)). However, this latter case does result in a small, charge-dense complex which is consistent with its excellent Se value.
Impact of pH on the thermogalvanic properties of Fe(DEPTA) & Fe(NTA)
Iron is known to have rich, pH-dependent chemistry.40,41 Aqua-iron species are inherently-acidic8 but often the hydroxophilicity of Fe(III) results in rapid formation of insoluble Fe(OH)x species above a pH of 2.5.5,42Table 1 summarises the as-made pH values of the semi-optimised Fe-ligand systems, which were all pH > 2.5, reaching as high as 9. This demonstrates the significantly higher pH-stability of the Fe(ligand) complexes over the iron(II/III) systems previously investigated.5,8As described above, the Fe(NTA) and Fe(DEPTA) only reached their expected fully-charged redox couples of [Fe(NTA)2]3−/4− and [Fe(DEPTA)]2−/3− upon addition of base. These two also demonstrated some of the highest observed power densities (as semi-optimised systems); therefore, the effect of pH upon power density was investigated as their final optimisation. Fe(Mal) and Fe(IDA) also demonstrated good power densities but relied upon an optimised ratio of acid:carboxylate, and hence could not be optimised further by the addition of base.
Fig. 9(a) and (d) shows the previously discussed impact of pH on Fe(DEPTA) and Fe(NTA), respectively, but now overlaid with the associated thermogalvanic current at this pH; Fig. 9(b) and (e) show the resulting power. In the case of Fe(DEPTA), current remained relatively constant before showing a sudden decrease above pH 10.5, which also matches the observed significant changes in speciation given by the drop in Se. This results in the power produced (Fig. 9(b)) strongly correlating with the trend in Se, peaking at ca. pH 10.3. Conversely, the as-made Fe(NTA) displayed the best current and this decreased dramatically after any addition of base (Fig. 9(d)); the power was therefore dominated by the current, and optimising the Se failed to significantly raise the power (Fig. 9(e)).
 | ||
| Fig. 9 Figures showing the effect of altering the pH upon the thermogalvanic properties of (a–c) Fe(DEPTA) and (d–f) Fe(NTA) plotting (a and d) the Se (as circles) and jsc (as squares), and (b and d) the Pmax. Also shown are the pH-dependent CVs for (c) Fe(DEPTA) and (f) Fe(NTA), with the effect on peak size with increasing pH indicated by the arrows. The pH modification was achieved by the direct addition of solid K2CO3 to the semi-optimised systems, and all other conditions are as per Fig. 4. | ||
In order to investigate this in more detail, the pH effect was monitored using cyclic voltammetry (CV), as shown in Fig. 9(c) and (f). The CVs displayed the excellent current and small peak-to-peak separation expected for the semi-optimised solutions; however, this changed dramatically as the pH increased. In the case of Fe(NTA), even minor addition of base resulted in the complete removal of the reduction peak and the growth of a new peak ca. 500 mV more cathodic. This is attributed to conformational changes in the structure upon undergoing redox chemistry, and explains both the excellent Se values but equally the kinetically-frustrated current.
The Fe(DEPTA) displayed a very similar change with pH, but over a much wider range of pH values; by a pH of ca. 10.5 it had achieved the optimum Se value (i.e. fully [Fe(DEPTA)]2−/3−) but also retained ca. half of the original reversible reduction peak, thus allowing reasonable current and therefore power to be generated.
It should be noted that though the Fe(DEPTA) system has a significantly lower Se than the Fe(NTA) system (especially at high pH), it maintained a synergistic kinetic and thermodynamic effect, thus allowing it to achieve a higher overall power when fully optimised. Given this, the Fe(DEPTA) system was taken forward to be utilised in a combined thermogalvanic device with its parent FeCl2/3 system.
In-series thermocell devices
Individual thermocells are inherently limited to relatively modest maximum voltages; therefore thermogalvanic cells are utilised electrically in-series but thermally in-parallel in an n-type p-type array.5,24,26 A combined device was prepared whereby the n-type cell was the parent FeCl2/3 system, and the p-type the pH-optimised [Fe(DEPTA)]2−/3− system. This combined cell used large, previously characterised electrodes based upon amorphous graphite.14 The resulting power curves for the cells measured both individually and in-series are shown in Fig. 10(a).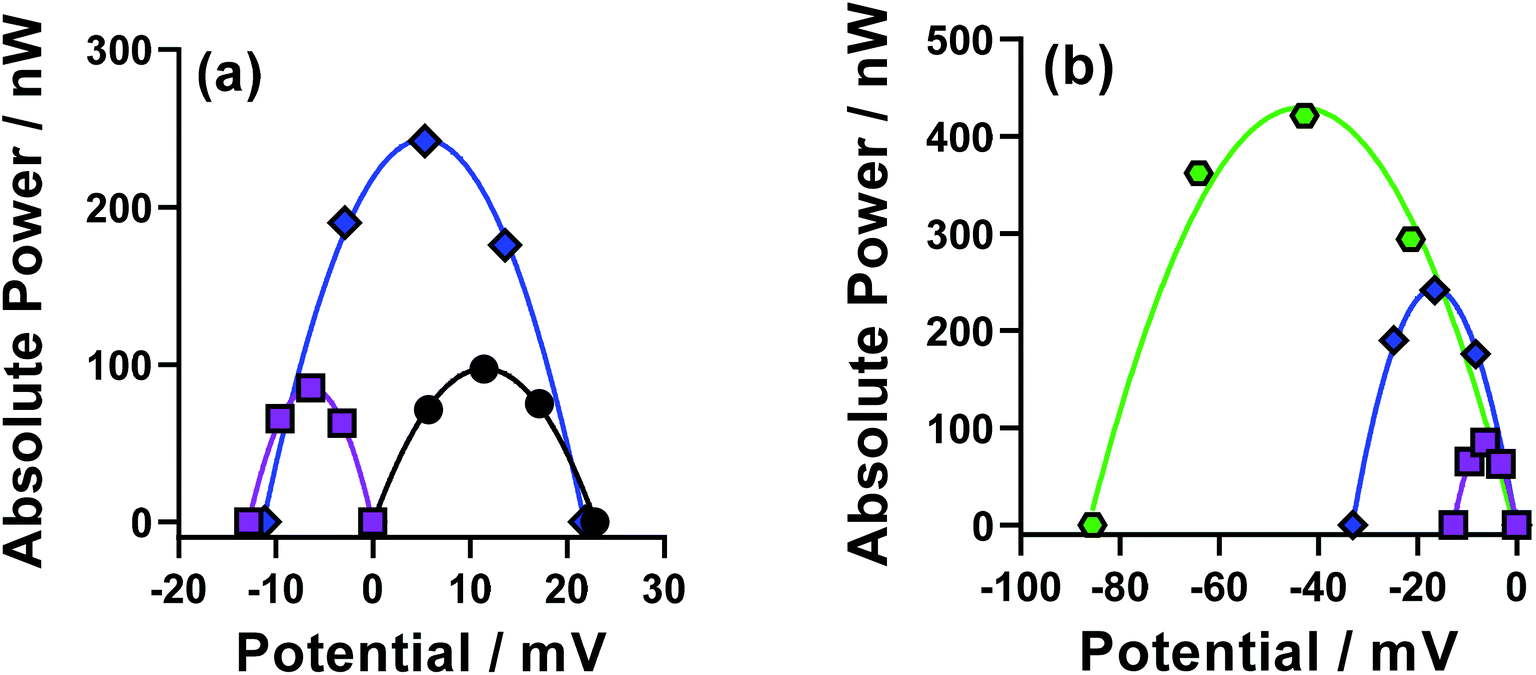 | ||
| Fig. 10 Showing (a) power curves for pH-optimised Fe(DEPTA) (purple squares) and the parent FeCl2/3 solution (black circles) when measured in individual cells, and when the two were combined electrically in-series (blue diamonds). Also shown in (b) the power curves for the individual Fe(DEPTA) cell (purple squares) and in-series Fe(DEPTA)/FeCl2/3 pair (blue diamonds), compared against a 6-cell device comprised of three Fe(DEPTA)/FeCl2/3 pairs connected in-series (green hexagons). All were measured at an applied ΔT = 20 K. | ||
The FeCl2/3 displayed a larger Se (+1.1 mV K−1, black circles) compared to that of the [Fe(DEPTA)]2−/3− (−0.7 mV K−1, purples squares) but the superior kinetics of the [Fe(DEPTA)]2−/3− system resulted in equivalent peak power densities in the power curves. When combined in-series (blue diamonds) the resulting voltage was 92% of the sum of the two, with the slight drop due to additional contact resistances and altered thermal contacts. However, the resulting peak power was ca. 130% of the sum of the two, which was consistently observed but unexpected. It is likely that the equivalent concentrations but asymmetry in the thermodynamic driving force (Se) and kinetics resulted in a synergistic effect on the overall power of the combined device; these devices have been the subject of very limited fundamental investigations to date,24 and frequently employ different concentrations and power outputs in the n-type and p-type cells,5,24 hence clearly more fundamental investigations are required.
Larger devices were investigated by moving up to 6-cells (or 3 n–p–pairs), as shown in Fig. 10(b). Similar observations were observed, with the voltage and power increasing significantly as the device became larger. Notably, this larger device could leak and have the electrolytes mix without any hazardous side-reactions, unlike many [Fe(CN)6]3−/4−-based devices.5 A somewhat analogous device has been reported using iron(II/III) sulphate as both the n-type and p-type redox couple,5 but the device reported here generates 2.4 times higher voltage and 1.6 times higher power, despite using 6 times lower concentration of Fe.
Green chemistry and sustainability of the Fe(ligand) thermogalvanic cell
The 12 principles of green chemistry43 and 12 principles of green chemical engineering44 provide convenient points for assessing the relative ‘greenness’ of the different systems, especially relative to the [Fe(CN)6]3−/4− system. A few are not relevant (e.g. catalysis, atom economy) and several of the chemistry and engineering principles overlap. Broadly the three most relevant concern safety (‘Designing safe chemicals’ and ‘Safer chemistry for accident prevention’ in Chemistry-terms; ‘Inputs/outputs inherently non-hazardous’ in Engineering-terms), degradation (‘Design for degradation’; ‘Durability vs. Immortality’), and efficiency (‘Design for energy efficiency’; ‘Maximise efficiency’).With regards to safety, the oral rat LD50 values were compared in the SDS (Safety Data Sheets) on sigmaaldrich.com; K4[Fe(CN)6] (ca. 3.6 g kg−1 oral rat LD50) and K3[Fe(CN)6] (>5 g kg−1) are actually less toxic than FeCl2 (0.5 g kg−1) and FeCl3 (1.3 g kg−1); however, none of the ligands investigated here were particularly toxic, spanning the range from acetic acid (3.25 g kg−1) through DEPTA (>5 g kg−1) to citric acid (11.7 g kg−1); no toxicity data could be found for complexes such as iron acetate or iron citrate, but notably these are widely employed as dietary supplements, while the more complex polyaminocarboxylate ligands are used to detoxify heavy metals in the environment.45 While K3[Fe(CN)6] and K4[Fe(CN)6] are relatively innocuous, they do have known temperature, light and pH instability issues that can liberate HCN (oral rat LD50ca. 0.0045 g kg−1).46 Whereas all Fe(ligand) systems appear to have no known hazardous side-reactions (under reasonable thermogalvanic operating conditions), p-type [Fe(CN)6]3−/4− cells run in close contact with acidified n-type cells can theoretically release devastatingly lethal quantities of HCN(g), when considering a leak in a complete thermogalvanic device.5
The (bio)degradation of [Fe(CN)6]3−/4− is known to liberate [CN]−, hence both redox states are firmly classed as long-term (chronic) aquatic hazards. Conversely, many of the ligands used here have extensive food, cleaning, agricultural and industrial applications.45 The biodegradation of polyaminocarboxylates is debatable, with significant variation observed as a function of structure45 and environment.47 While they are typically consumed during intensive (a)biotic processing such as sewage treatment47 this might not extend to more natural environments.45 However, photo-degradation of the Fe(III) complexes is a typical environmental fate for these ligands;45,47 naturally-derived and more biodegradable polyaminocarboxylate systems are also being actively investigated.48 Provided these ligands do not mobilise toxic heavy metals (such as Cd(II)45), they are all expected to possess a significantly less deleterious effect upon the environmental than [Fe(CN)6]3−/4−.
Finally, with regards to efficiency, the trends observed in this work are clear; the favourable kinetics of optimised Fe(DEPTA) means it can generate orders of magnitude more power than several other Fe(ligand) systems; Fe(NTA) is also able to match the Se of [Fe(CN)6]3−/4−. However, [Fe(CN)6]3−/4− possesses both favourable thermodynamic and fast kinetics, meaning that (at present) [Fe(CN)6]3−/4− still represents a more energy efficient system, be it on an atomic, volumetric or mass basis.
Sustainability typically requires environmental (green) considerations to be met alongside societal and economic ones. Four metals arguably constitute the bulk of thermogalvanic cell studies; these are iron (typically as Fe2+/3+ or [Fe(CN)6]3−/4−),3,8–10,14,49–51 copper (typically as Cu0/2+),52–56 cobalt (typically as [Co(bpy)3]2+/3+,12,57–61) and lithium (typically as [Li(glyme)]0/+.62–64 Of these metals, only iron is not listed as ‘endangered’ (i.e. facing a threat to future supply)7 which is obviously detrimental from a sustainability perspective. In fact, a large quantity of global cobalt is mined in the Democratic Republic of the Congo, which suffers from political instability and ethical production methods (due to civil war, other violence, and child labour).65,66 This suggests that iron is the more sustainable long-term option, with more precise cost considerations discussed below.
Table 3 presents a relative cost comparison of the semi-optimised systems, as well as the pH-optimised DEPTA system; the values are purely arbitrary, with the £ mW−1 the cost required to generate 1 mW for 1 second (and if used for 1 year it would decrease the cost by ca. 3 × 10⁷), while the reagent costs represent as-brought and don't consider potential economy-of-scale savings. Nevertheless, it represents a relative comparison and demonstrates how the costs span 2 orders of magnitude. The pH optimisation of the Fe(DEPTA) system resulted in a more expensive and complex cell, but the higher performance off-set this and reduced the cost:power ratio. Interestingly, the semi-optimised Fe(IDA) was identified as the most cost-effective thermogalvanic system, with the low cost of the relatively simple carboxylate ligand and the moderate performance; non-pH optimised NTA was also equivalent to the pH-optimised DEPTA. This kind of balance between complexity, cost and power is hugely significant when considering scalability, and identifies both IDA-like and NTA-like systems as meriting further evaluation.
:power ratio is for an arbitrary one second generation of power, under steady-state discharge conditions
| Fe(Ligand) | Power/mW | Cost of materials per thermocell (NaOH neutralised)/£ | Cost:power ratio (NaOH neutralised)/£ mW−1 |
|---|---|---|---|
| Fe(Ac) | 7.76 × 10⁻⁷ | 0.0013 | 1732 |
| Fe(Mal) | 9.00 × 10⁻⁵ | 0.0047 | 52.7 |
| Fe(Cit) | 1.93 × 10⁻⁵ | 0.0038 | 199 |
| Fe(IDA) | 5.17 × 10⁻⁵ | 0.0017 | 32.8 |
| Fe(NTA) | 1.52 × 10⁻⁴ | 0.0051 | 33.8 |
| Fe(EDTA) | 1.03 × 10⁻⁵ | 0.0480 | 468 |
| Fe(EGTA) | 2.37 × 10⁻⁵ | 0.0461 | 1951 |
| Fe(DEPTA) | 1.15 × 10⁻⁴ | 0.0059 | 51.5 |
| Fe(DEPTA) (pH optimised) | 2.05 × 10⁻⁴ | 0.0070 | 33.8 |
Conclusions
This study works towards the overall goal of generating a sustainable thermogalvanically-active redox couple with a negative thermogalvanic Seebeck coefficient, Se, as a replacement of the hazardous but often utilised ferri/ferrocyanide, [Fe(CN)6]3−/4−. To this end, earth-abundant iron was retained but combined with benign, negatively charged ligands from the polycarboxylate and polyaminocarboxylate families. In many respects this has been successful, demonstrating how this approach can generate systems with Se values on par with [Fe(CN)6]3−/4−, or conversely can generate systems with excellent kinetics. Relative cost evaluations revealed an additional area requiring consideration. Nevertheless, this approach still requires further optimisation since no single system was found to possess both excellent thermodynamics and kinetics; from a green chemistry perspective several systems are desirable replacements for [Fe(CN)6]3−/4− in thermogalvanic cells, but none match [Fe(CN)6]3−/4− in terms of performance metrics. All were benchmarked at gold and platinum electrodes (with a complete device prepared using graphite electrodes); electrocatalytic optimisation of electrode surfaces is one route of potentially overcoming this.Conflicts of interest
There are no conflicts to declare.Acknowledgements
M. A. B. acknowledges the EPSRC for funding (Standard Research Studentship (DTP), EP/N509498/1).References
- T. I. Quickenden and Y. Mua, J. Electrochem. Soc., 1995, 142, 3985–3994 CrossRef CAS.
- M. F. Dupont, D. R. MacFarlane and J. M. Pringle, Chem. Commun., 2017, 53, 6288–6302 RSC.
- B. Burrows, J. Electrochem. Soc., 1976, 123, 154–159 CrossRef CAS.
- M. Papapetrou, G. Kosmadakis, A. Cipollina, U. La Commare and G. Micale, Appl. Therm. Eng., 2018, 138, 207–216 CrossRef.
- M. A. Buckingham, K. Laws, J. T. Sengel and L. Aldous, Green Chem., 2020, 22, 6062–6074 RSC.
- C. B. Vining, Nat. Mater., 2009, 8, 83–85 CrossRef CAS PubMed.
- Endangered Elements, https://www.acs.org/content/acs/en/greenchemistry/research-innovation/endangered-elements.html.
- M. A. Buckingham, F. Marken and L. Aldous, Sustainable Energy Fuels, 2018, 2, 2717–2726 RSC.
- K. Kim, S. Hwang and H. Lee, Electrochim. Acta, 2020, 335, 135651 CrossRef CAS.
- J. H. Kim, J. H. Lee, R. R. Palem, M. S. Suh, H. H. Lee and T. J. Kang, Sci. Rep., 2019, 9, 8706 CrossRef PubMed.
- Y. Zhou, Y. Liu, M. A. Buckingham, S. Zhang, L. Aldous, S. Beirne, G. G. Wallace and J. Chen, Electrochem. Commun., 2021, 124, 106938 CrossRef CAS.
- T. J. Abraham, D. R. Macfarlane and J. M. Pringle, Energy Environ. Sci., 2013, 6, 2639–2645 RSC.
- T. J. Abraham, N. Tachikawa, D. R. MacFarlane and J. M. Pringle, Phys. Chem. Chem. Phys., 2014, 16, 2527–2532 RSC.
- M. A. Buckingham, S. Hammoud, H. Li, C. J. Beale, J. T. Sengel and L. Aldous, Sustainable Energy Fuels, 2020, 4, 3388–3399 RSC.
- R. Hu, B. A. Cola, N. Haram, J. N. Barisci, S. Lee, S. Stoughton, G. Wallace, C. Too, M. Thomas, A. Gestos, M. E. dela Cruz, J. P. Ferraris, A. A. Zakhidov and R. H. Baughman, Nano Lett., 2010, 10, 838–846 CrossRef CAS PubMed.
- L. Zhang, T. Kim, N. Li, T. J. Kang, J. Chen, J. M. Pringle, M. Zhang, A. H. Kazim, S. Fang, C. Haines, D. Al-Masri, B. A. Cola, J. M. Razal, J. Di, S. Beirne, D. R. MacFarlane, A. Gonzalez-Martin, S. Mathew, Y. H. Kim, G. Wallace and R. H. Baughman, Adv. Mater., 2017, 29, 1605652 CrossRef PubMed.
- M. S. Romano, N. Li, D. Antiohos, J. M. Razal, A. Nattestad, S. Beirne, S. Fang, Y. Chen, R. Jalili, G. G. Wallace, R. Baughman and J. Chen, Adv. Mater., 2013, 25, 6602–6606 CrossRef CAS PubMed.
- C. Han, X. Qian, Q. Li, B. Deng, Y. Zhu, Z. Han, W. Zhang, W. Wang, S. Feng, G. Chen and W. Liu, Science, 2020, 368, 1091–1098 CrossRef CAS PubMed.
- B. Yu, J. Duan, H. Cong, W. Xie, R. Liu, X. Zhuang, H. Wang, B. Qi, M. Xu, Z. L. Wang and J. Zhou, Science, 2020, 370, 342–346 CrossRef CAS PubMed.
- J. Duan, G. Feng, B. Yu, J. Li, M. Chen, P. Yang, J. Feng, K. Liu and J. Zhou, Nat. Commun., 2018, 9, 1–8 CrossRef PubMed.
- H. A. H. Alzahrani, M. A. Buckingham, F. Marken and L. Aldous, Electrochem. Commun., 2019, 102, 41–45 CrossRef CAS.
- M. A. Buckingham, S. Zhang, Y. Liu, J. Chen, F. Marken and L. Aldous, ACS Appl. Energy Mater., 2021, 4(10), 11204–11214 CrossRef CAS.
- M. A. Buckingham, K. Laws, H. Li, Y. Kuang and L. Aldous, Cell Rep. Phys. Sci., 2021, 2, 100510 CrossRef.
- M. Al Maimani, J. J. Black and L. Aldous, Electrochem. Commun., 2016, 72, 181–185 CrossRef CAS.
- P. Yang, K. Liu, Q. Chen, X. Mo, Y. Zhou, S. Li, G. Feng and J. Zhou, Angew. Chem., Int. Ed., 2016, 55, 12050–12053 CrossRef CAS PubMed.
- Y. Liu, S. Zhang, Y. Zhou, M. A. Buckingham, L. Aldous, P. C. Sherrel, G. G. Wallace, G. Ryder, S. Faisal, D. L. Officer, S. Beirne and J. Chen, Adv. Energy Mater., 2020, 10, 2002539 CrossRef CAS.
- P. L. Domingo, B. Garcia and J. M. Leal, Can. J. Chem., 1990, 68, 228–235 CrossRef CAS.
- H. Basset and A. S. Corbet, J. Chem. Soc. Trans., 1924, 1358–1366 RSC.
- F. Musshoff, K. M. Kirschbaum and B. Madea, Forensic Sci. Int., 2011, 204, e4–e7 CrossRef CAS PubMed.
- J. T. Hupp and M. J. Weaver, Inorg. Chem., 1984, 23, 3639–3644 CrossRef CAS.
- M. A. Buckingham and L. Aldous, J. Electroanal. Chem., 2020, 872, 114280 CrossRef CAS.
- R Core Team, R: A language and environment for statistical computing. R Foundation for Statistical Computing, Vienna, Austria, http://www.r-project.org/, 2013 Search PubMed.
- A. J. Bard and L. R. Faulkner, Electrochemical Methods: Fundamentals and Applications, John Wiley & Sons, INC., 2nd edn, 2001 Search PubMed.
- T. J. Kang, S. Fang, M. E. Kozlov, C. S. Haines, N. Li, Y. H. Kim, Y. Chen and R. H. Baughman, Adv. Funct. Mater., 2012, 22, 477–489 CrossRef CAS.
- J. H. Kim and T. J. Kang, ACS Appl. Mater. Interfaces, 2019, 11, 28894–28899 CrossRef CAS PubMed.
- J. H. Lee, Y. Jung, J. H. Kim, S. J. Yang and T. J. Kang, Carbon, 2019, 147, 559–565 CrossRef CAS.
- H. Im, T. Kim, H. Song, J. Choi, J. S. Park, R. Ovalle-Robles, H. D. Yang, K. D. Kihm, R. H. Baughman, H. H. Lee, T. J. Kang and Y. H. Kim, Nat. Commun., 2016, 7, 10600 CrossRef CAS PubMed.
- H. Ma, X. Wang, Y. Peng, H. Peng, M. Hu, L. Xiao, G. Wang, J. Lu and L. Zhuang, ACS Energy Lett., 2019, 4, 1810–1815 CrossRef CAS.
- J. T. Hupp and M. J. Weaver, J. Phys. Chem., 1984, 88, 1860–1864 CrossRef CAS.
- R. J. Lemire, U. Berner, C. Musikas, D. A. Palmer, P. Taylor and O. Tochiyama, Chemical thermodynamics of iron Part 1, OECD, 2013, vol. 13a Search PubMed.
- N. N. Greenwood and A. Earnshaw, Chemistry of the Elements, Pergamon Press Ltd., Leeds, 1984 Search PubMed.
- J. Majzlan, K.-D. Grevel and A. Navrotsky, Am. Mineral., 2003, 88, 855–859 CrossRef CAS.
- P. Anastas and J. Warner, Green Chemistry: Theory and Practice, Oxford University Press, Oxford [England], 2000 Search PubMed.
- P. T. Anastas and J. B. Zimmerman, Environ. Sci. Technol., 2003, 37, 94A–101A CrossRef PubMed.
- D. Kołodyńska, Environ. Sci. Pollut. Res., 2013, 20, 5939–5949 CrossRef PubMed.
- J. Cernicharo, Encycl. Astrobiol, 2011, vol. 3, pp. 783–783 Search PubMed.
- M. Bucheli-Witschel and T. Egli, FEMS Microbiol. Rev., 2001, 25, 69–106 CrossRef CAS PubMed.
- M. Polhuis, L. M. Katata and A. M. Crouch, Chem. Speciation Bioavailability, 2006, 18, 85–93 CrossRef CAS.
- T. Ikeshoji, Bull. Mater. Sci., 1987, 60, 1505–1514 CAS.
- Y. Mua and T. I. Quickenden, J. Electrochem. Soc., 1996, 143, 2558–2564 CrossRef CAS.
- T. I. Quickenden and Y. Mua, J. Electrochem. Soc., 1995, 142, 3652–3659 CrossRef CAS.
- A. Gunawan, C. H. Lin, D. A. Buttry, V. Mujica, R. A. Taylor, R. S. Prasher and P. E. Phelan, Nanoscale Microscale Thermophys. Eng., 2013, 17, 304–323 CrossRef CAS.
- A. Phys, A. Gunawan, V. Mujica, D. A. Buttry and P. E. Phelan, Appl. Phys. Lett., 2021, 118, 253901 CrossRef.
- A. Gunawan, H. Li, C. H. Lin, D. A. Buttry, V. Mujica, R. A. Taylor, R. S. Prasher and P. E. Phelan, Int. J. Heat Mass Transfer, 2014, 78, 423–434 CrossRef CAS.
- F. L. Meng, M. Gao, T. Ding, G. Yilmaz, W. L. Ong and G. W. Ho, Adv. Funct. Mater., 2020, 30, 2002867 CrossRef CAS.
- S. M. Jung, J. Kwon, J. Lee, K. Shim, D. Park, T. Kim, Y. H. Kim, S. J. Hwang and Y. T. Kim, ACS Appl. Energy Mater., 2020, 3, 6383–6390 CrossRef CAS.
- R. Koerver, D. R. MacFarlane and J. M. Pringle, Electrochim. Acta, 2015, 184, 186–192 CrossRef CAS.
- M. A. Lazar, D. Al-Masri, D. R. Macfarlane and J. M. Pringle, Phys. Chem. Chem. Phys., 2016, 18, 1404–1410 RSC.
- N. Jiao, T. J. Abraham, D. R. MacFarlane and J. M. Pringle, J. Electrochem. Soc., 2014, 161, D3061–D3065 CrossRef CAS.
- A. Taheri, D. R. MacFarlane, C. Pozo-Gonzalo and J. M. Pringle, ChemSusChem, 2018, 11, 2788–2796 CrossRef CAS PubMed.
- A. Sosnowska, E. Laux, H. Keppner, T. Puzyn and M. Bobrowski, J. Mol. Liq., 2020, 316, 113871 CrossRef CAS.
- J. J. Black, A. Dolan, J. B. Harper and L. Aldous, Phys. Chem. Chem. Phys., 2018, 20, 16558–16567 RSC.
- J. J. Black, T. Murphy, R. Atkin, A. Dolan and L. Aldous, Phys. Chem. Chem. Phys., 2016, 18, 20768–20777 RSC.
- K. Kim and H. Lee, Phys. Chem. Chem. Phys., 2018, 20, 23433–23440 RSC.
- G. A. Campbell, Miner. Econ., 2020, 33, 21 CrossRef.
- F. S. Hisan, N. Huda and M. A. P. Mahmud, J. Sustainable Min., 2019, 18, 150 CrossRef.
Footnotes |
| † Electronic supplementary information (ESI) available. See DOI: 10.1039/d1gc02989d |
| ‡ It should be noted here that the free acid of NTA, EDTA, EGTA and DEPTA were all insoluble and could not be utilised in the optimisation study. The IDA free acid was soluble enough to investigate, but was still only partially soluble so could not be investigated beyond 2 equivalents compared to Fe ions. |
| § These voltammograms were recorded at Au electrode rather than Pt, due to proton reduction overlapping with Fe(III) reduction, especially in the Fe(citrate) system. A comparison of the CVs recorded on both Au and Pt are shown in Fig. S2, which shows only the absence of proton reduction was the primary difference. |
| This journal is © The Royal Society of Chemistry 2021 |