DOI:
10.1039/C9NA00230H
(Paper)
Nanoscale Adv., 2019,
1, 3086-3094
In situ construction of dual-morphology ZnCo2O4 for high-performance asymmetric supercapacitors†
Received
10th April 2019
, Accepted 17th June 2019
First published on 22nd June 2019
Abstract
In this study, the controllable preparation of ZnCo2O4 with different morphologies in a reaction system and the orderly weaving of these morphologies into special structures was demonstrated, which might be impossible to achieve using other methods; herein, we successfully prepared a dual-morphology ZnCo2O4/N-doped reduced graphene oxide/Ni foam substrate (ZNGN) electrode by ultrasonic processing, a one-step hydrothermal method and a subsequent annealing process for high-performance supercapacitors. At first, ZnCo2O4 nanosheet orderly formed a honeycomb structure on the surface of Ni foam (NF); this improved the redox surface area of the electrode; then, feather-like ZnCo2O4 was evenly distributed over the honeycomb structure, playing the role of containment and fixation to provide space for material volume expansion during charging and discharging. The electrochemical test showed that the maximum capacitance of the ZNGN electrode was 1600 F g−1 (960C g−1) at the current density of 1 A g−1 in a 6 M KOH solution. Moreover, the asymmetric supercapacitor ZNGN//activated carbon (ZNGN//AC) displayed the excellent energy density of 66.1 W h kg−1 at the power density of 701 W kg−1. Compared with the capacitance (233.3 F g−1 and 326.6C g−1) when ZNGN//AC was fully activated at 4 A g−1, there was almost no loss in capacitance after 2000 charge–discharge cycles, and a 94% capacitance retention was achieved after 5000 cycles. Thus, this excellent electrochemical property highlights the potential application of the dual-morphology ZnCo2O4 electrode in supercapacitors.
1. Introduction
Energy shortage and environmental pollution have become key factors affecting the economic and social development, and thus, the use of renewable energy sources (such as solar, wind and geothermal energy) is expected to alleviate these problems;1–3 however, due to their intermittent nature, these new energy sources cannot replace traditional energy sources to provide stable energy for human beings. Therefore, the preparation of efficient energy storage equipment becomes one of the key points in the development of new energy sources.4–6 As is well-known, supercapacitors are a kind of energy storage devices that exhibit faster charge/discharge and longer cycle life when compared with the traditional capacitors and batteries;7–9 due to these superior performances, a large number of outstanding studies have been reported on electrode materials, electrolytes and current collector materials for supercapacitors.10–13 After the successful application of many electrode materials (metal oxides, conductive polymers and carbon-based materials) in supercapacitors, extensive efforts, including complex element doping and preparation of different morphologies, are being paid towards stimulating the potential of these materials.
For example, ZnCo2O4 has been widely studied in the fields of lithium-ion batteries, supercapacitors, fuel cells and electrocatalysts owing to its rich redox reactions and diverse morphology.14,15 The specific capacitance of spinel ZnCo2O4 is higher than that of Co3O4 or NiCo2O4, and its theoretical capacitance is higher than that of graphene negative electrode materials.16–21 However, the poor electrical conductivity of ZnCo2O4 affects the actual energy storage efficiency of the material, and the volume of ZnCo2O4 easily expands during charging and discharging.22–26 Chen found that the addition of 2D carbon materials (such as rGO and CNTs) could improve the electrode circulation performance of ZnCo2O4.27 Further studies have found that N is one of the most effective candidates to improve the conductivity of graphene.1,11,28 N replaces the oxygen atom and dopes into the broken graphene lattice; this improves the wettability of graphene towards water-containing electrolytes.29,30 In a number of studies on N-doped reduced graphene oxide (N-rGO) or ZnCo2O4 supercapacitors, urea has been used as a nitrogen source and a reaction precipitant; note that Sahoo et al. have found that the N-doped rGO-supported NF (using urea as the N source) serves as a completely different nucleation center for the growth of mixed transition metal oxides and results in the formation of ZnCo2O4 nanoflakes.31 This indicates that the morphology of ZnCo2O4 can be controlled directionally by adding nitrogen-doped graphene to the system. Moreover, ZnCo2O4 nanomaterials have been successfully prepared in various shapes such as petal-like, nano-linear, cubic and core–shell shapes; among these, the core–shell structure is considered to effectively reduce the volume expansion;32,33 however, the issue of the poor conductivity of ZnCo2O4 is not well-solved. Ultra-thin structures are considered to be effective in improving the charge transfer and mass transfer processes; thus, the preparation of ZnCo2O4 with an ultra-thin structure seems to be a suitable strategy.34,35
In our study, ZNGN electrodes were prepared by ultrasonic processing, one-step hydrothermal synthesis and annealing. Note that two different morphologies of ZnCo2O4 with large surface areas were successfully produced on the surface of NF. A layer of ZnCo2O4 nanosheet with uniform pores was grown on NF, and then, a feather-like ZnCo2O4 layer was evenly distributed on the first layer. Herein, not only ZnCo2O4 was successfully used to construct a double-morphological structure, but also the two morphologies were made as thin as possible. Furthermore, the upper layer of the feather-like ZnCo2O4 could be used as an elastic binder to prevent more serious cracking and collapse problems in the lower layer during charging and discharging. The dual-morphologies showed excellent frame stability through a mutual support. The electrochemical test indicated the high specific capacitance of 1600 F g−1 (960C g−1) at 1 A g−1, and more importantly, the asymmetric supercapacitor ZNGN//AC had the high energy density of 66.1 W h kg−1 at the power density of 701 W kg−1, energy density of 43.66 W h kg−1 at the high power density of 7016 W kg−1 and good cycling stability (almost 0% fading after 2000 cycles, and a capacitance retention rate over 94% after 5000 cycles at 4 A g−1).
2. Experiment
2.1. Materials and reagents
In this experiment, graphite powder, phosphoric acid (H3PO4), sulfuric acid (H2SO4), hydrogen peroxide (H2O2, 30%), potassium permanganate (KMnO4), hydrochloric acid (HCl), zinc acetate hexahydrate (C4H10O6Zn, 99.9%), cobalt acetate(II) hexahydrate (C4H14CoO8, 99.9%), urea (CH4N2O, 99%), potassium hydroxide (KOH), acetone (CH3COCH3, 99.5%) and ethanol (C2H5OH, 99.5%) were obtained from China Beijing Fine Chemical Co. LTD. NF was obtained from Kunshan Toll Hui Electronics Technology Co. LTD, China. All reagents were of analytical grade and used directly without further purification; moreover, deionized water was used during the experiment.
2.2. Preparation of electrode materials
2.2.1. Preparation of the ZNGN electrode material.
Prior to all the chemical processes, graphite oxide was prepared via a modified Hummers' method.36 Moreover, NF (2 cm × 1 cm) was continuously washed and sonicated for 30 minutes with 3 mM HCl, acetone, ethanol and deionized water. The first step during the working electrode preparation was as follows: 1 mM GO suspension and 2 mM urea were mixed in 10 mL distilled water and ultrasonically dispersed for 8 hours; then, 1 mM zinc acetate dihydrate and 2 mM cobalt(II) acetate tetrahydrate were added to the solution and stirred for 10 minutes using a magnetic stirrer. After this, the solution and the clean NF were transferred to a 25 mL polytetrafluoroethylene-lined autoclave and heated at 120 °C for 14 hours. After the reaction was completed, the autoclave was cooled down to room temperature, and the NF electrode was washed with DI water and ethanol followed by drying at 60 °C for 6 hours. Finally, the electrode was annealed in air at 350 °C for 2 hours. For comparison with ZNGN, ZnCo2O4/N-doped reduced graphene oxide (ZNG), N-doped reduced graphene oxide/NF (NGN) and ZnCo2O4/NF (ZN) were prepared under the same conditions.
2.2.2. Preparation of the ZNGN//AC asymmetric supercapacitor.
AC, acetylene black and PVDF were uniformly mixed in the ratio of 8![[thin space (1/6-em)]](https://www.rsc.org/images/entities/char_2009.gif) :1:1, applied to NF, pressed into a sheet by a tableting machine, and vacuum dried at 50 °C for 24 hours. The positive and negative electrodes were separated by a filter paper and pressed together after they were completely overlapped and wrapped in Parafilm.
:1:1, applied to NF, pressed into a sheet by a tableting machine, and vacuum dried at 50 °C for 24 hours. The positive and negative electrodes were separated by a filter paper and pressed together after they were completely overlapped and wrapped in Parafilm.
2.3. Material characteristics
The structure and phase characterization were performed using the Bruker D8 Advance X-ray powder diffractometer (XRD, Germany) with Cu Kα radiation (40 kV, 40 mA, l = 0.15418 nm) over the 2θ range of 10–80° in the continuous scan mode at the scan speed of 5° min−1. The surface functional groups were examined via X-ray photoelectron spectroscopy (XPS, Model PHI 5300, Physical Electronics, USA). The surface morphology of the material was characterized by a field emission scanning electron microscope (FESEM, S-4800, Hitachi, Japan) equipped with an energy dispersive spectrometer (EDS). Raman spectroscopy was performed using the Renishaw InVia confocal Raman spectrometer with the Leica DMLM microscope and an argon-ion laser (wavelength 514.5 nm, model Stellar-REN, Modu-Laser) as the excitation source.
2.4. Electrochemical characterization
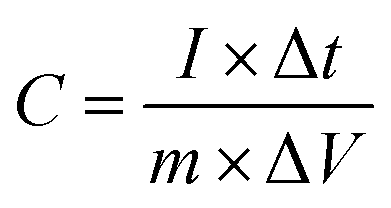
Surface electrochemical measurements were performed using a standard three-electrode cell in a 6 M KOH electrolyte (CHI 760E, CH Instruments). ZNGN was used as the working electrode, a platinum electrode (1 cm × 1 cm) was used as the counter electrode, and a saturated calomel electrode (SCE) was used as the reference electrode. The test involved cyclic voltammetry (CV), constant current charge/discharge (GCD) and electrochemical impedance spectroscopy (EIS). The CV curves were measured at various scan rates (5–100 mV s−1), the GCD performance was tested in the potential window density from −0.2 to 0.4 V at different currents ranging from 2 to 25 A g−1, and EIS was obtained with the amplitude of 5 mV ranging from 100 kHz to 0.01 kHz. All these measurements were conducted at room temperature. The specific capacitance was calculated from the GCD curves according to eqn (1):| |  | (1) |
where, C (F g−1) represents the specific capacitance, I (A) is the discharge current, Δt (s) is the discharge time, m (g) is the mass of the active material, and ΔV (V) represents the potential window.
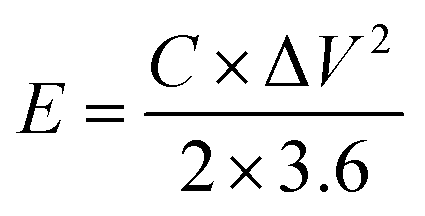
The specific capacitance of ZNGN//AC was calculated using the following eqn (2) and (3):
| |  | (2) |
where
E (W h kg
−1) refers to the energy density,
C (F g
−1) is the specific capacitance calculated from the discharge curve, and Δ
V (V) represents the potential window.
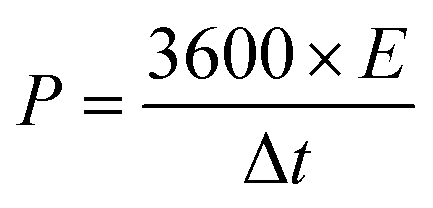
| |  | (3) |
where
P (W kg
−1) refers to the power density,
E (W h kg
−1) stands for the energy density, and Δ
t (s) is the discharge time.
3. Results and discussion
3.1. Morphology and structural analysis
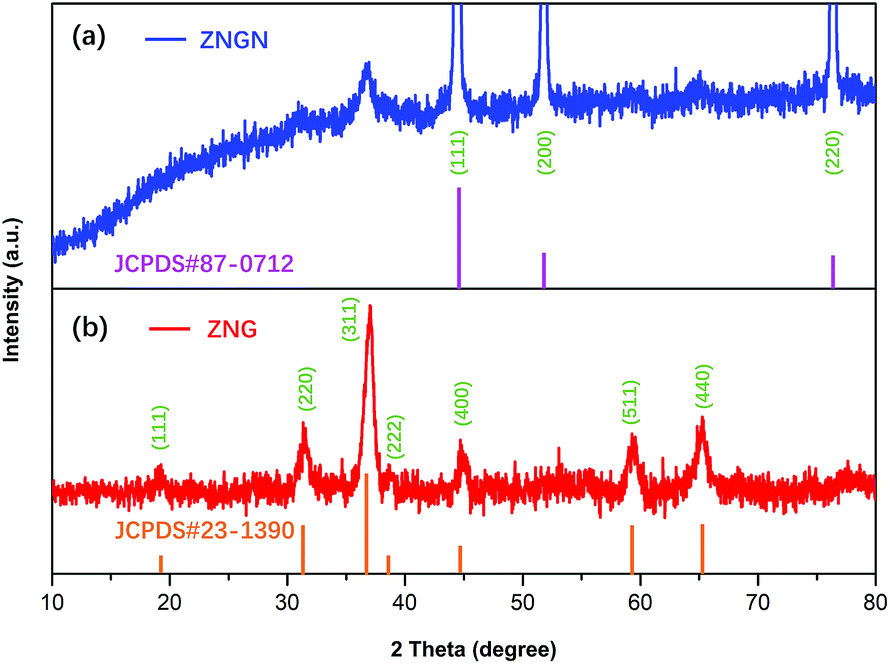
The crystal structure and phase composition of the prepared samples were analyzed by XRD, and the results are shown in Fig. 1. The peaks of ZNG at 19.2°, 31.3°, 37.0°, 39.0°, 44.7°, 59.4° and 65.2° can be well indexed to the (111), (220), (311), (222), (400), (511) and (440) reflections, respectively, which are consistent with the standard XRD pattern of the cubic ZnCo2O4 phase (JCPDS card number 23-1390). The peaks at 44.7°, 52.0° and 76.5° indexed to the (111), (200) and (220) reflections of the ZNGN sample belonged to the NF base material (JCPDS card number 87-0712) reflections, and the remaining peaks displaying a weak intensity could be assigned to the growth product of ZnCo2O4, respectively; since no significant impurity peaks, such as those of the ZnO phase, were found in these two samples, the resultant phase purity XRD pattern of the sample was obtained. Moreover, since the graphene peak shown in Fig. 1 is not obvious, the components in the sample have been further analyzed by TEM (Fig. S1a†). It can be clearly seen from Fig. S1b† that the diffraction rings in the selected-area electron diffraction (SAED) pattern are assigned to the (111), (220), (311), (400) and (511) planes; this is in good agreement with the XRD results of ZnCo2O4.37 Moreover, the lattice fringe with the pitch of ∼0.24 nm in the HRTEM image (Fig. S1b†) is the interplanar spacing between (311) faces of cubic ZnCo2O4.32 Importantly, the presence of graphene is clearly observed in Fig. S1d.†
 |
| | Fig. 1 XRD patterns of (a) ZNGN and (b) ZNG. | |
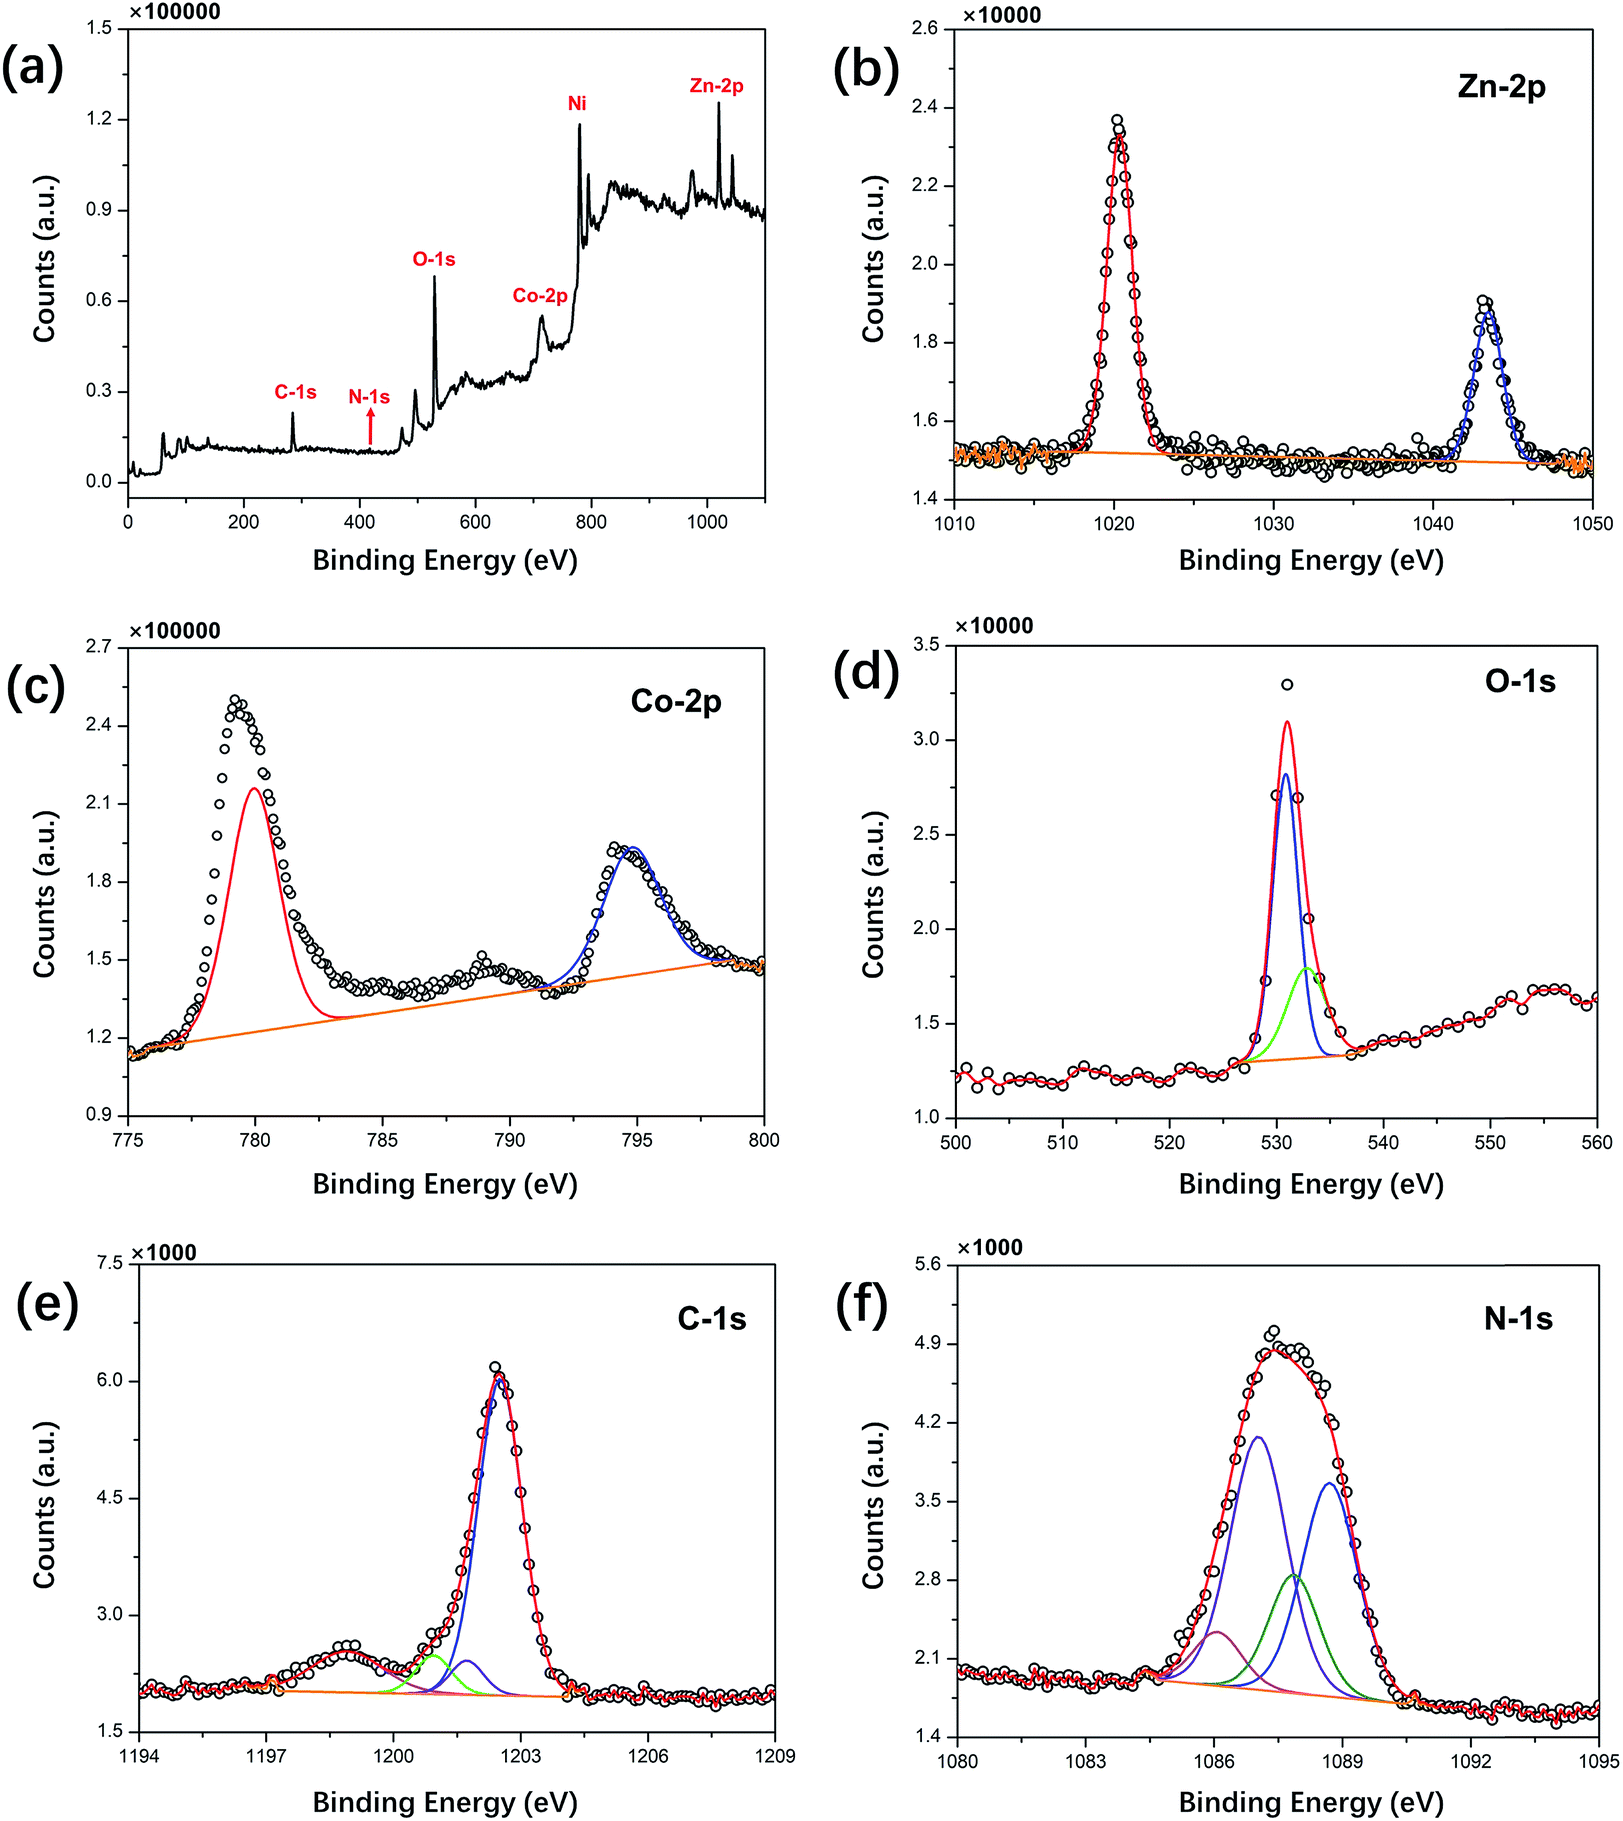
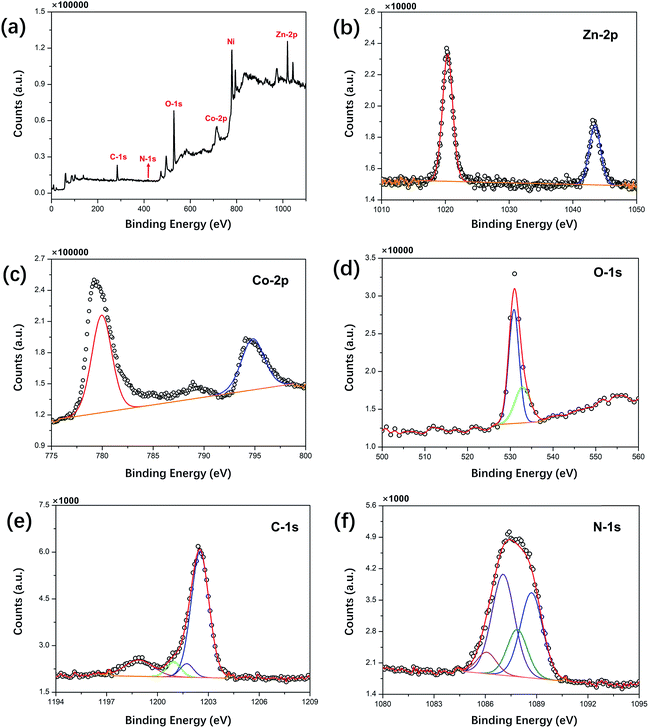
The chemical composition of ZNGN was further analyzed via the XPS spectrum (Fig. 2a–f). The full-width scan spectrum (Fig. 2a) represents the characteristic peaks of Zn-2p, Co-2p, O-1s, C-1s and N-1s, indicating the presence of the Zn, Co, O, C and N elements in ZNGN, respectively. In addition, to confirm the incorporation of N into graphene during the reaction (Fig. S2†), we prepared N-rGO according to the experimental procedure used for ZNGN and conducted the XPS test. By fitting, the peaks at 1021.6 and 1044.6 eV in the high-resolution Zn-2p core level spectrum corresponded to Zn-2p3/2 and Zn-2p1/2, which indicated the Zn(II) oxidation state of ZnCo2O4 (Fig. 2b).38 Similarly, the two strong peaks observed at 779.6 eV and 794.9 eV are attributed to Co-2p3/2 and Co-2p1/2, respectively, confirming the state of Co(III) in ZnCo2O4 (Fig. 2c).39 The O-1s spectrum contains two peaks of 530.4 eV and 532.8 eV, corresponding to the metal oxygen bond and defect location/physical adsorption oxygen, which confirm the existence of oxygen species (Fig. 2d).40 In Fig. 2e, the spectrum of C-1s can be fitted to the C–C/C![[double bond, length as m-dash]](https://www.rsc.org/images/entities/char_e001.gif) C, C–N, CN, and O–CO peaks, indicating that N has been doped into graphene.1 Furthermore, Fig. 2f displays that the N-1s spectrum is divided into pyridyl nitrogen (from 398.1 to 399.3 eV), pyrrole nitrogen (from 399.8 to 401.2 eV) and graphitic nitrogen (from 401.1 to 402.7 eV).31
C, C–N, CN, and O–CO peaks, indicating that N has been doped into graphene.1 Furthermore, Fig. 2f displays that the N-1s spectrum is divided into pyridyl nitrogen (from 398.1 to 399.3 eV), pyrrole nitrogen (from 399.8 to 401.2 eV) and graphitic nitrogen (from 401.1 to 402.7 eV).31
 |
| | Fig. 2 XPS survey spectra of (a) ZNGN, (b) Zn-2p, (c) Co-2p, (d) O-1s, (e) C-1s and (f) N-1s. | |
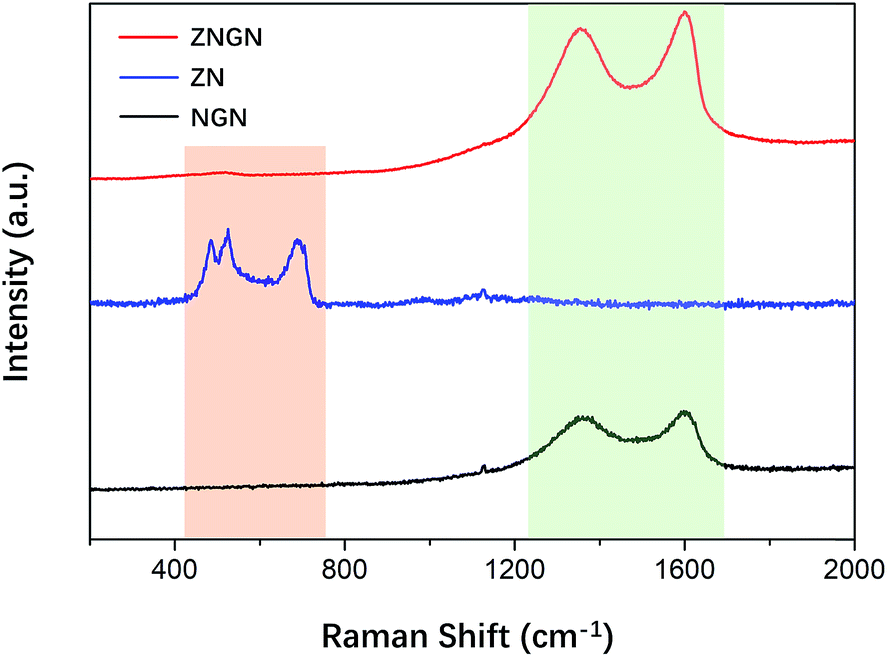
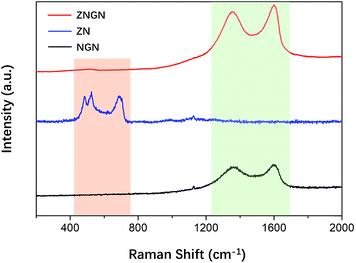
To verify that graphene was loaded onto ZNGN, Raman spectroscopy of ZNGN, ZN and NGN was conducted, and the results are shown in Fig. 3. The Raman spectrum of NGN shows the characteristic peaks of the D and G bands of reduced graphene oxide at 1364 cm−1 and 1599 cm−1, respectively.41,42 In the case of ZN, the peaks at 472.6 cm−1, 518.5 cm−1 and 689.0 cm−1 are assigned to Eg, F2g and A1g of ZnCo2O4, respectively.43 Compared with NGN, ZNGN has two more sharp peaks at the same position because GO in ZNGN has more defects due to the loss of oxygen functional groups during the process of reduction and N-doping. In addition, the intensity of the characteristic peaks (from 400 to 700 cm−1) of ZnCo2O4 in ZNGN gradually increases due to good interaction between N-rGO and ZnCo2O4.44 Therefore, ZnCo2O4 and N-rGO were uniformly mixed to grow on the NF.
 |
| | Fig. 3 Raman spectra of ZNGN, ZN, and NGN. | |
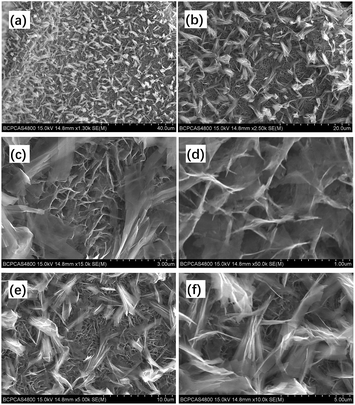
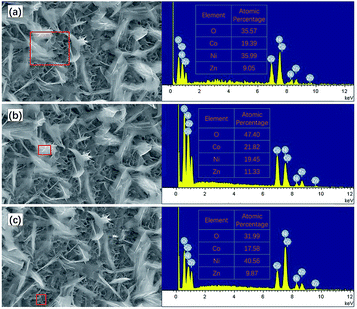
The microstructure of the ZNGN electrode was studied by SEM (Fig. 4). In Fig. 4a and b, it is clear that the double-morphology ZnCo2O4 is uniformly and orderly distributed on the NF. Upon further expanding the magnification, it can be observed that a layer of the ZnCo2O4 nanosheet is grown next to the NF that leads to a highly porous 3D superstructure (Fig. 4c); each of the holes is surrounded by a film of about 8–10 nm thickness and 600 nm depth (Fig. 4d). Obviously, this morphology will provide a large contact area for the redox reaction. More importantly, as shown in Fig. 4e and f, a layer of feather-like ZnCo2O4 is uniformly distributed on the pore structure, with the lengths and widths of about 50 μm and 10 μm, respectively. Moreover, the feather-like ZnCo2O4 can be used as a bridge to reinforce the underlying ZnCo2O4 nanosheet, reducing the impact of volume expansion and fracture on the material. It can be clearly seen that both morphologies have a thin three-dimensional structure. In addition, the Brunauer–Emmett–Teller (BET) analysis was conducted to further understand the specific surface area and pore diameter distribution of the materials (Fig. S3†). The dual-morphology ZnCo2O4 exhibited the specific surface area of 88.2 m2 g−1, and the pore size distribution was concentrated between 0 and 6 nm (Fig. S3,† inset). Overall, the typical ZnCo2O4 dual-morphology structure can significantly increase the redox surface area and also plays the role of mutual load fixation to prevent the collapse of the structure during the process of charging and discharging. EDS was used to analyse the double morphology products, and the chemical composition of the products was confirmed to be ZnCo2O4 (Fig. 5a). As shown in Fig. 5b, since the distribution of the feather-like ZnCo2O4 in the uppermost layer was less affected by the nickel substrate, the proportion of the Zn, Co and O elements was enhanced. Conversely, the lower layer of the ZnCo2O4 nanosheet was greatly affected by the nickel substrate, resulting in higher content of nickel (Fig. 5c). To further confirm the uniform growth of ZnCo2O4 and N-rGO on the NF, we performed the EDS element mapping analysis on the ZNGN electrode, and all the results are shown in Fig. S4.† The uniform distribution of Zn, Co, O, C and Ni can be clearly observed from the mapped image.
 |
| | Fig. 4 SEM images of dual-morphology ZnCo2O4 on NF (a and b), ZnCo2O4 nanosheet (c and d) and feather-like ZnCo2O4 (e and f). | |
 |
| | Fig. 5 EDS results of (a) dual-morphology ZnCo2O4, (b) feather-like ZnCo2O4, and (c) ZnCo2O4 nanosheet . | |
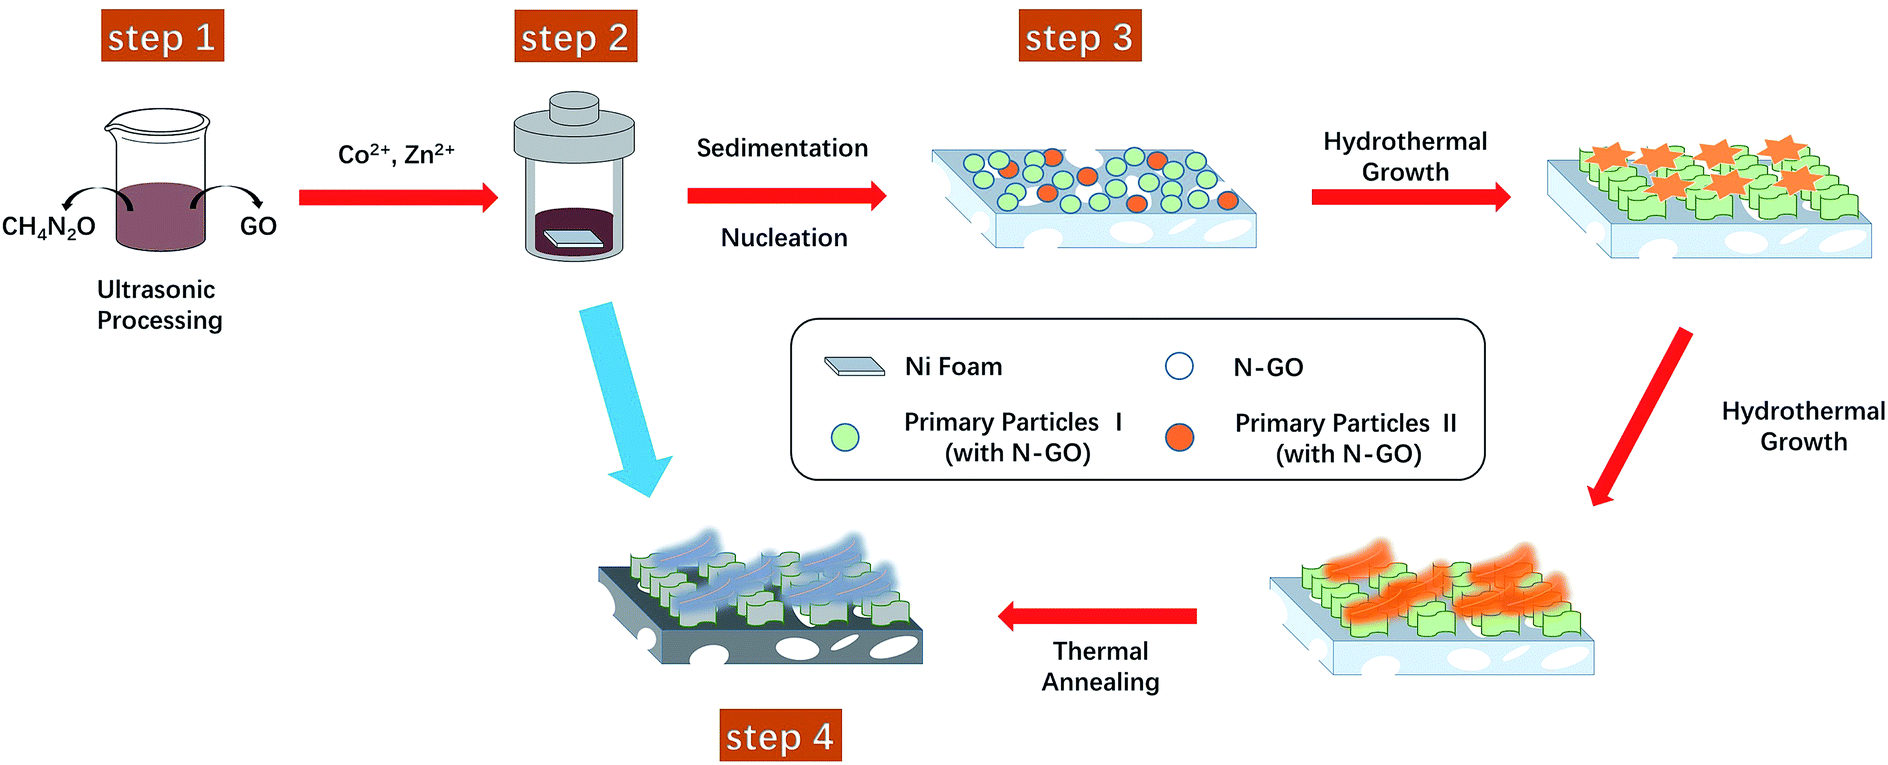
Based on the abovementioned discussion, we have presented a possible growth step in Fig. 6. At first, GO and urea were sonicated for 8 hours at room temperature (step 1). Previous studies have shown that the strong adhesion of GO to NF and the favorable interaction between GO plates lead to the uniform growth of a ZnCo2O4 nanowire array on the rGO-loaded NF; on the other hand, N-doped rGO leads to the formation of ZnCo2O4 nanosheets.31 Therefore, different morphologies of ZnCo2O4 can be prepared by effectively introducing different kinds of GO into the Zn–Co acetate reaction system. Herein, we speculate that the ultrasonic treatment of urea and GO can change the structure of GO, and the duration of ultrasonication determines the amount of GO undergoing the structural change. To verify this hypothesis, we conducted further studies with ultrasonication duration as a variable, and the SEM results are provided in Fig. S5 in the ESI.† Obviously, the ZnCo2O4 nanorods grew in the system without the ultrasonic treatment; the dual-morphology (nanosheet and feather-like) ZnCo2O4 was grown in the system treated with ultrasonication for 8 hours; after the ultrasonic treatment for 48 hours, the feather-like ZnCo2O4 was conglomerated into flower balls (feather-flower ZnCo2O4). In addition to changing the structure of GO, urea serves two more purposes: (1) it acts as a source of N element in N-rGO and (2) as a precipitant to form ZnCo2O4. Then, the Zn–Co acetate and GO/urea solutions were mixed and transferred to a 25 mL Teflon-lined autoclave, and all particles were uniformly bonded by various interactions including van der Waals forces, hydrogen bonding, and π–π stacking interactions (step 2); after this, in the early stages of the hydrothermal treatment, the first primary particles formed from the GO-urea precursors and Zn–Co acetate grew into the ZnCo2O4 nanosheet on the NF via aggregation and self-assembly. As the reaction progressed, the second primary particles formed by the structurally altered GO and other particles in the system grew into the feather-like ZnCo2O4 in a manner such that the interfacial energy was minimized (step 3). The reaction of the hydrothermal process was conducted as follows:20
| | | NH2CONH2 + H2O → 2NH3 + CO2 | (4) |
| | | CO2 + H2O → CO32− + 2H+ | (5) |
| | | NH3 + H2O → NH4+ + OH− | (6) |
| | | ⅔Co2+ + ⅓Zn2+ + OH− + ½CO32− + nH2O → Zn1/3Co2/3(OH)(CO3)1/2nH2O | (7) |
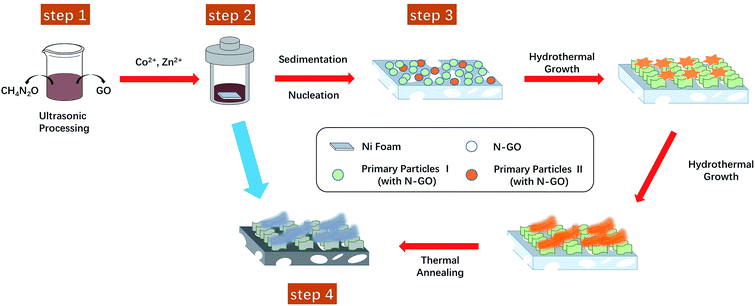 |
| | Fig. 6 Schematic of the fabrication process of the 3D hierarchical dual-morphology ZnCo2O4 on NF. | |
Finally, ZnCo-glycolate was converted to ZnCo2O4 by annealing (step 4).
| | | 6Zn1/3Co2/3(OH)(CO3)1/2nH2O + O2 → 2ZnCo2O4 + 3CO2↑ + (6n + 3) H2O | (8) |
3.2. Electrochemical properties
The electrochemical properties were investigated in a 6 M KOH electrolyte via cyclic voltammetry (CV), galvanostatic charge–discharge (GCD) and electrochemical impedance spectroscopy (EIS).
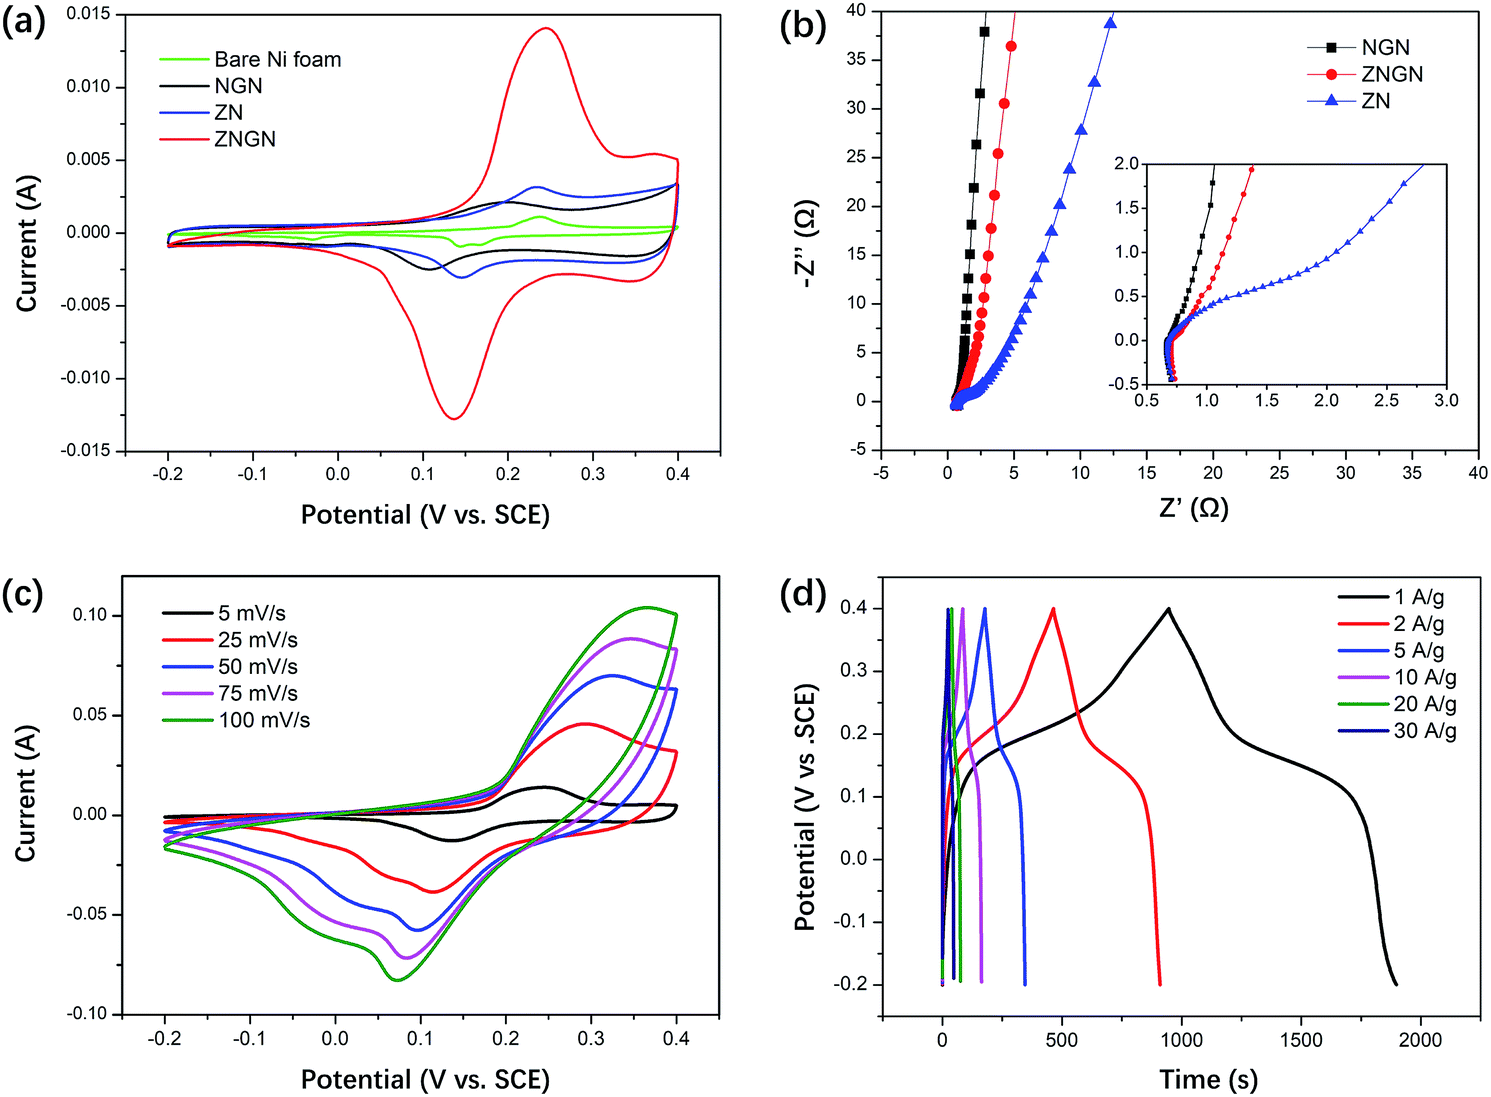
Fig. 7a shows the CV curves of NF, NGN, ZN and ZNGN at the scan rate of 5 mV s−1 in the potential range from −0.2 to 0.4 V (vs. Ag/AgCl). It is clear that ZNGN provides highest capacitance because it has the largest CV area among all the test electrodes. We speculate that the superior performance of the capacitor is attributed to the large redox surface area of the double-morphology ZnCo2O4. In Fig. 7b, the X-axis intercept of the curve in the high-frequency region represents the bulk resistance Rs, which constitutes the resistance of the active material and electrolyte as well as the resistance of the collector substrate and the active material. It is clear that the Rs values of the three electrodes are small and have little difference. From the charge transfer impedance (Rct) at intermediate frequency, it can be observed that the addition of rGO can effectively improve the conductivity of ZnCo2O4. The inclined line at low frequency indicates the Warburg impedance region (Wo), and the higher curve slope indicates that the ions in the electrolyte more easily diffuse to the electrode surface.20 To further confirm the conductivity of the dual-morphology ZnCo2O4, we conducted an EIS test on the three forms shown in Fig. S5,† and the results are provided in the ESI (Fig. S6†). It is obvious in Fig. S6† that the dual-morphology ZnCo2O4 shows good electrical conductivity, which may be due to its thin sheet structure. The CV curve of the ZNGN electrode has a potential window ranging from −0.2 to 0.4 V for the scan rate ranging from 5 to 100 mV s−1, as shown in Fig. 7c. As the scanning speed increased, the anode peak of the CV curve shifted to high potential, whereas the cathode peak shifted to low potential. Because the redox reaction rate of the electrode surface is extremely fast at high scan rates, higher/lower voltages are required for the electrons to participate in the oxidation/reduction reaction. As shown in Fig. 7d, the GCD tests of the ZNGN electrodes were performed at different current densities. The maximum capacitance was calculated to be 1600 F g−1 (960C g−1) at the current density of 1 A g−1, and those of the other electrodes were 1506, 1473, 1383, 1266 and 1249 F g−1 at the current densities of 2, 5, 10, 20 and 30 A g−1, respectively. Apparently, the capacitance decreased with an increase in current density; this might be due to the accumulation of charges and ions on the surface of the electrode.
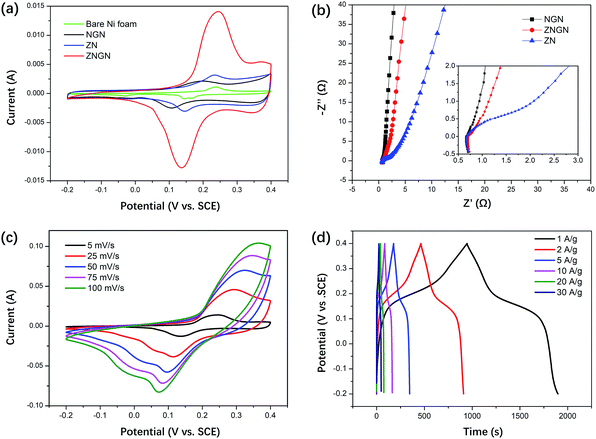 |
| | Fig. 7 Electrochemical properties of NF, NGN, ZN and ZNGN in 6 M KOH: (a) CV curves of bare Ni foam, NGN, ZN and ZNGN at 100 mV s−1 scan rate in the potential range from −0.2 to 0.4 V; (b) Nyquist plots of NGN, ZNGN and ZN; (c) CV curves of ZNGN at different scan rates ranging from 5 to 100 mV s; and (d) comparison of the galvanostatic charge/discharge curves at different current densities in the potential window from −0.2 to 0.4 V. | |
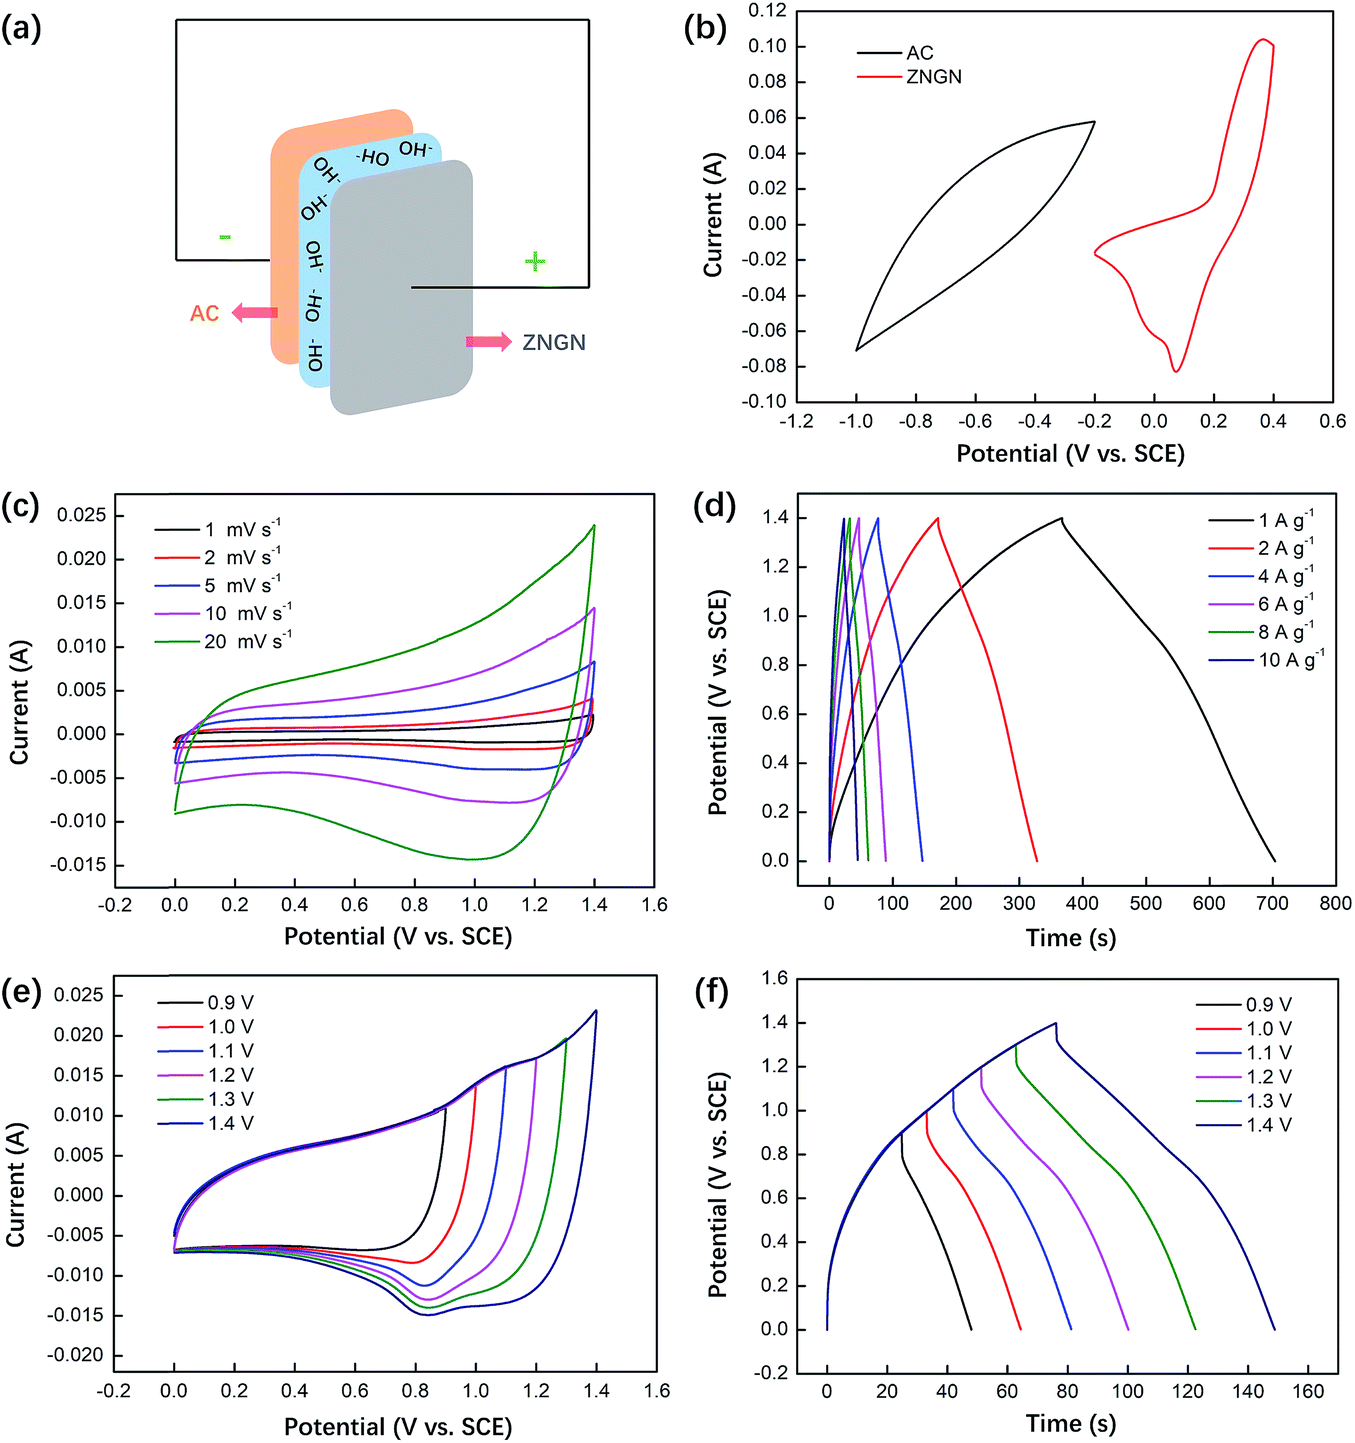
To further test the performance of the material, an asymmetric supercapacitor was assembled, in which ZNGN acted as the anode and AC acted as the cathode (Fig. 8a). The potential voltage window of AC ranged from −1 to −0.2 V and that of ZNGN ranged from −0.2 to 0.4 V (Fig. 8b); this indicated that the scalable window of the asymmetric supercapacitor was up to 1.4 V. The CV measurements were performed on the asymmetric capacitors at the scanning rate from 1 to 20 mV s−1, and there was no clear change in the curve shape with an increase in the scanning rate; this indicated a good rate performance of the device (Fig. 8c).45 The GCD test results show that the maximum capacitance is 242.1 F g−1 (338.9C g−1) at the current density of 1 A g−1, and those of the other electrodes are 224.3, 203.4, 188.6, 170.3 and 160.0 F g−1 at the current densities of 2, 4, 6, 8 and 10 A g−1 (Fig. 8d), respectively. In addition to this, the CV and GCD curves of the asymmetric capacitor devices at different voltages are shown in Fig. 8e and f, respectively. It can be seen that the CV and GCD shapes do not change with an increase in voltage from 0.9 to 1.4 V; this proves that ZNGN//AC can operate at the high operating voltage of 1.4 V.31
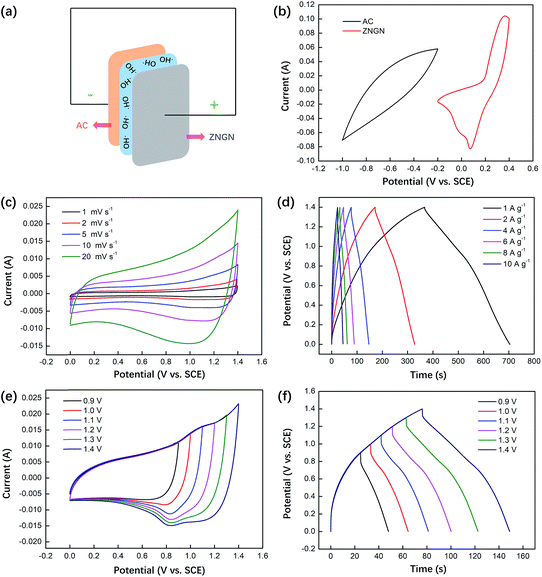 |
| | Fig. 8 Electrochemical properties of the ZNGN//AC asymmetric supercapacitor device: (a) schematic of the device configuration; (b) comparative CV curves of the ZNGN and AC electrodes at the scan rate of 100 mV s−1 in a three-electrode system; (c) CV curves of the device at different scan rates ranging from 1 to 20 mV s; (d) galvanostatic charge–discharge profiles at different current densities ranging from 1 to 10 A g−1 in the potential window from 0 to 1.4 V; (e) CV curves of the device at different voltage windows at the scanning rate of 20 mV s; and (f) GCD curves of the device at different voltage windows at 4 A g−1. | |
In addition to capacitance, cycling stability is an important parameter for evaluating supercapacitors and the dual-morphology ZnCo2O4. The 5000-cycle performance of the asymmetric supercapacitor at the current density of 4 A g−1 is shown in Fig. 9a. The first 300 cycles activated all the potential of the capacitor until the capacitance started to decrease after 2000 cycles possibly due to the degradation of the active electrode material. By comparing the capacitance value obtained at the 300th cycle with that obtained at the 5000th cycle (233.3 F g−1 and 326.6C g−1), it was observed that 94% of the performance was retained after 5000 cycles. To perform detailed monitoring of the 5000 cycles, we performed a GCD test every 1000 cycles, and the data is provided in the ESI (Fig. S7†). Moreover, in the SEM image obtained after the cycling tests, it can be clearly seen that the layer of the ZnCo2O4 nanosheet has cracks, whereas the upper layer does not break and still retains the complete morphology (highlighted by the yellow dotted circle in Fig. 9a). This indicates that the double morphology has a certain inhibitory effect on film breakage during charging and discharging. Furthermore, the Ragone plot of the asymmetric capacitor device assembled using the dual-morphology ZnCo2O4 was compared with the energy density and power density values obtained in the recently reported studies, as shown in Fig. 9b. The supercapacitor prepared in this experiment shows the high energy density of 66.1 W h kg−1 at the power density 701.0 W kg−1 and 43.66 W h kg−1 at the high power density of 7016 W kg−1, indicating its excellent energy storage properties, which may due to its high surface area and a large porous structure. In addition, its performance is better than that of many previously reported zinc cobalt oxide electrodes such as ZnCo2O4/N-doped rGO/NF//rGO (48.1 W h kg−1 at 900.0 W kg−1),31 ZnCo2O4 nanowire cluster arrays//AC (41 W h kg−1 at 384 W kg−1),46 ZnCo2O4/MnO2//AC (29.41 W h kg−1 at 628.48 W kg−1),47 Co3O4/ZnCo2O4/CuO//AC (35.82 W h kg−1 at 799.95 W kg−1),48 ZnCo2O4/NGN/CNT//NGN/CNT (31.19 W h kg−1 at 750 W kg−1),49 and flower-ZnCo2O4//flower-ZnCo2O4 (40 W h kg−1 at 1016 W kg−1).50 Moreover, the comparison of the remaining performance parameters is provided in Table S1 in the ESI.† The excellent performance of the electrode in terms of capacitance and stability indicates the feasibility and practicability of the dual-morphology ZnCo2O4 frame structure in future applications.
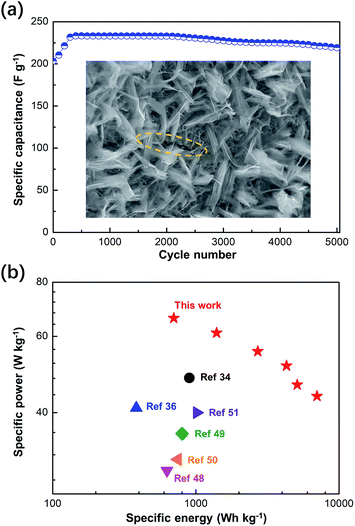 |
| | Fig. 9 (a) Cycle life and SEM images of the assembled ZNGN//AC device for 5000 cycles, (b) Ragone plot of the device assembled using the dual-morphology ZnCo2O4 when compared with the recently reported values in the literature. The crack produced after 5000 cycles is highlighted by the yellow dotted circle in (a). | |
Conclusions
To improve the specific surface area and structural stability of active materials, we designed and successfully prepared the dual-morphology ZnCo2O4 electrode material via one-step hydrothermal and annealing processes. The first morphology is a layer of ZnCo2O4 nanosheet closely grown on the NF substrate, which makes the porous material to increase the reaction surface area. The second morphology is a layer of feather-like ZnCo2O4, which is used as a bridge for joining and fixing the first layer of the material. Moreover, the ZnCo2O4 electrode showed the high specific capacitance of 1600 F g−1 (960C g−1) at 1 A g−1 in a 6 M KOH solution. After assembling of the ZNGN//AC asymmetric supercapacitor, the capacitance reached 242.1 F g−1 (338.9C g−1) at 1 A g−1. The maximum energy density of 66.1 W h kg−1 (at the power density of 701.0 W kg−1) and 43.66 W h kg−1 (at the power density of 7016 W kg−1) were obtained at the operating voltage of 1.4 V. Moreover, it has been confirmed that the special dual-morphology can protect the electrode material from breakage after 5000 cycles of charge/discharge (almost 0% fading after 2000 cycles). This developed preparation method can further stimulate the ability of materials to construct complex structures with different morphologies at the nanometer scale, which can be used in various energy-related applications.
Conflicts of interest
The authors declare no competing financial interests.
Acknowledgements
We gratefully acknowledge the National Natural Science Foundation of China (No. 21271027) for their support to this work.
Notes and references
- H.-L. Guo, P. Su, X. Kang and S.-K. Ning, J. Mater. Chem. A, 2013, 1, 2248–2255 RSC.
- M. F. El-Kady, V. Strong, S. Dubin and R. B. Kane, Science, 2012, 335, 1326 CrossRef CAS.
- X. Lu, Y. Zeng, M. Yu, T. Zhai, C. Liang, S. Xie, M. S. Balogun and Y. Tong, Adv. Mater., 2014, 26, 3148–3155 CrossRef CAS PubMed.
- D. Zhang, Y. Zhang, Y. Luo and P. K. Chu, Nano Energy, 2015, 13, 47–57 CrossRef CAS.
- C. Pan, L. Dong, G. Zhu, S. Niu, R. Yu, Q. Yang, Y. Liu and Z. L. Wang, Nat. Photonics, 2013, 7, 752–758 CrossRef CAS.
- Y. Fu, X. Cai, H. Wu, Z. Lv, S. Hou, M. Peng, X. Yu and D. Zou, Adv. Mater., 2012, 24, 5713–5718 CrossRef CAS.
- G. Yu, X. Xie, L. Pan, Z. Bao and Y. Cui, Nano Energy, 2013, 2, 213–234 CrossRef CAS.
- M. Yu, Y. Huang, C. Li, Y. Zeng, W. Wang, Y. Li, P. Fang, X. Lu and Y. Tong, Adv. Funct. Mater., 2015, 25, 324–330 CrossRef CAS.
- M. Yu, W. Qiu, F. Wang, T. Zhai, P. Fang, X. Lu and Y. Tong, J. Mater. Chem. A, 2015, 3, 15792–15823 RSC.
- K. Jost, C. R. Perez, J. K. McDonough, V. Presser, M. Heon, G. Dion and Y. Gogotsi, Energy Environ. Sci., 2011, 4, 5060 RSC.
- Y. Gogotsi and P. Simon, Science, 2011, 334, 917 CrossRef CAS PubMed.
- L. L. Zhang and X. S. Zhao, Chem. Soc. Rev., 2009, 38, 2520–2531 RSC.
- L. Sun, Z. Yi, J. Lin, F. Liang, Y. Wu, Z. Cao and L. Wang, J. Phys. Chem. C, 2016, 120, 12337–12343 CrossRef CAS.
- P. Poizot, S. Laruelle, S. Grugeon, L. Dupont and J. M. Tarascon, Nature, 2000, 407, 496–499 CrossRef CAS PubMed.
- C. Zhou, Y. Zhang, Y. Li and J. Liu, Nano Lett., 2013, 13, 2078–2085 CrossRef CAS PubMed.
- Y. Teng, L. X. Song, L. B. Wang and J. Xia, J. Phys. Chem. C, 2014, 118, 4767–4773 CrossRef CAS.
- M. Yu, J. Chen, Y. Ma, J. Zhang, J. Liu, S. Li and J. An, Appl. Surf. Sci., 2014, 314, 1000–1006 CrossRef CAS.
- T. Y. Wei, C. H. Chen, H. C. Chien, S. Y. Lu and C. C. Hu, Adv. Mater., 2010, 22, 347–351 CrossRef CAS PubMed.
- X. Wang, W. S. Liu, X. Lu and P. S. Lee, J. Mater. Chem., 2012, 22, 23114 RSC.
- H. Chen, Q. Zhang, J. Wang, Q. Wang, X. Zhou, X. Li, Y. Yang and K. Zhang, Nano Energy, 2014, 10, 245–258 CrossRef CAS.
- C. Wu, J. Cai, Q. Zhang, X. Zhou, Y. Zhu, L. Li, P. Shen and K. Zhang, Electrochim. Acta, 2015, 169, 202–209 CrossRef CAS.
- H. Wu, Z. Lou, H. Yang and G. Shen, Nanoscale, 2015, 7, 1921–1926 RSC.
- G. Zhou, J. Zhu, Y. Chen, L. Mei, X. Duan, G. Zhang, L. Chen, T. Wang and B. Lu, Electrochim. Acta, 2014, 123, 450–455 CrossRef CAS.
- F. Bao, X. Wang, X. Zhao, Y. Wang, Y. Ji, H. Zhang and X. Liu, RSC Adv., 2014, 4, 2393–2397 RSC.
- R. Zhang, J. Liu, H. Guo and X. Tong, Mater. Lett., 2014, 115, 208–211 CrossRef CAS.
- S. Wang, J. Pu, Y. Tong, Y. Cheng, Y. Gao and Z. Wang, J. Mater. Chem. A, 2014, 2, 5434–5440 RSC.
- L. Peng, Y. Feng, P. Lv, D. Lei, Y. Shen, Y. Li and W. Feng, J. Phys. Chem. C, 2012, 116, 4970–4978 CrossRef CAS.
- K. Gopalakrishnan, A. Govindaraj and C. N. R. Rao, J. Mater. Chem. A, 2013, 1, 7563 RSC.
- H.-F. Yen, Y.-Y. Horng, M.-S. Hu, W.-H. Yang, J.-R. Wen, A. Ganguly, Y. Tai, K.-H. Chen and L.-C. Chen, Carbon, 2015, 82, 124–134 CrossRef CAS.
- G. Tian, L. Liu, Q. Meng and B. Cao, J. Power Sources, 2015, 274, 851–861 CrossRef CAS.
- S. Sahoo and J.-J. Shim, J. Ind. Eng. Chem., 2017, 54, 205–217 CrossRef CAS.
- D. Zhang, Y. Zhang, X. Li, Y. Luo, H. Huang, J. Wang and P. K. Chu, J. Mater. Chem. A, 2016, 4, 568–577 RSC.
- Z. Zhang, X. Zhang, Y. Feng, X. Wang, Q. Sun, D. Yu, W. Tong, X. Zhao and X. Liu, Electrochim. Acta, 2018, 260, 823–829 CrossRef CAS.
- J. Jiang, Y. Li, J. Liu, X. Huang, C. Yuan and X. W. Lou, Adv. Mater., 2012, 24, 5166–5180 CrossRef CAS PubMed.
- D. Wang, D. Choi, J. Li, Z. Yang, Z. Nie, R. Kou, D. Hu, C. Wang, L. V. Saraf, J. Zhang, I. A. Aksay and J. Liu, ACS Nano, 2009, 3, 907–914 CrossRef CAS PubMed.
- N. I. Kovtyukhova, P. J. Ollivier, B. R. Martin, T. E. Mallouk, S. A. Chizhik, E. V. Buzaneva and A. D. Gorchinskiy, Chem. Mater., 1999, 11, 771–778 CrossRef CAS.
- W. Luo, X. Hu, Y. Sun and Y. Huang, J. Mater. Chem., 2012, 22, 8916 RSC.
- W. Fu, Y. Wang, W. Han, Z. Zhang, H. Zha and E. Xie, J. Mater. Chem. A, 2016, 4, 173–182 RSC.
- S. N. Tiruneh, B. K. Kang, S. H. Kwag, Y. Lee, M. Kim and D. H. Yoon, Chem.–Eur. J., 2018, 24, 3263–3270 CrossRef CAS PubMed.
- H. Chen, G. Jiang, W. Yu, D. Liu, Y. Liu, L. Li, Q. Huang and Z. Tong, J. Mater. Chem. A, 2016, 4, 5958–5964 RSC.
- W. Chen, H. Jiang, Y. Hu, Y. Dai and C. Li, Chem. Commun., 2014, 50, 8856–8859 RSC.
- Y. Chen, K. Fu, S. Zhu, W. Luo, Y. Wang, Y. Li, E. Hitz, Y. Yao, J. Dai, J. Wan, V. A. Danner, T. Li and L. Hu, Nano Lett., 2016, 16, 3616–3623 CrossRef CAS PubMed.
- H. Zhang, H. Li, H. Wang, K. He, S. Wang, Y. Tang and J. Chen, J. Power Sources, 2015, 280, 640–648 CrossRef CAS.
- S. Sahoo and J.-J. Shim, ACS Sustainable Chem. Eng., 2016, 5, 241–251 CrossRef.
- S. Sun, S. Wang, S. Li, Y. Li, Y. Zhang, J. Chen, Z. Zhang, S. Fang and P. Wang, J. Mater. Chem. A, 2016, 4, 18646–18653 RSC.
- B. Guan, D. Guo, L. Hu, G. Zhang, T. Fu, W. Ren, J. Li and Q. Li, J. Mater. Chem. A, 2014, 2, 16116–16123 RSC.
- D. Yu, Z. Zhang, Y. n. Meng, Y. Teng, Y. Wu, X. Zhang, Q. Sun, W. Tong, X. Zhao and X. Liu, Inorg. Chem. Front., 2018, 5, 597–604 RSC.
- S. Zhou, Z. Ye, S. Hu, C. Hao, X. Wang, C. Huang and F. Wu, Nanoscale, 2018, 10, 15771–15781 RSC.
- W. Bai, H. Tong, Z. Gao, S. Yue, S. Xing, S. Dong, L. Shen, J. He, X. Zhang and Y. Liang, J. Mater. Chem. A, 2015, 3, 21891–21898 RSC.
- G. Rajeshkhanna and G. Ranga Rao, Electrochim. Acta, 2018, 261, 265–274 CrossRef CAS.
Footnote |
| † Electronic supplementary information (ESI) available. See DOI: 10.1039/c9na00230h |
|
| This journal is © The Royal Society of Chemistry 2019 |

 Open Access Article
 This Open Access Article is licensed under a Creative Commons Attribution-Non Commercial 3.0 Unported Licence
 *,
Ge
He
,
Anqi
Lv
,
Yanmei
Shen
and
Wenguo
Xu
*
*,
Ge
He
,
Anqi
Lv
,
Yanmei
Shen
and
Wenguo
Xu
*