Versatile fluorescence detection of microRNA based on novel DNA hydrogel-amplified signal probes coupled with DNA walker amplification†
Chunli
Li
,
Hongkun
Li
,
Junjun
Ge
and
Guifen
Jie
 *
*
Key Laboratory of Optic-electric Sensing and Analytical Chemistry for Life Science, MOE, Shandong Key Laboratory of Biochemical Analysis, Key Laboratory of Analytical Chemistry for Life Science in Universities of Shandong, College of Chemistry and Molecular Engineering, Qingdao University of Science and Technology, Qingdao 266042, P. R. China. E-mail: guifenjie@126.com
First published on 14th March 2019
Abstract
A novel DNA hydrogel-amplified versatile fluorescence platform combined with hybridization chain reaction (HCR) and DNA walking multiple amplification was developed for ultrasensitive detection of miRNA. The DNA hydrogel was loaded with large amounts of SYBR Green (SG) I dyes or CdTe quantum dots (QDs) to assemble versatile signal probes.
Specific, rapid, and ultrasensitive detection of cancer prognostic miRNAs is very important for successful clinical implementation.1 The current miRNA detection methods mainly include fluorescence,2 electrochemical,3 electrochemiluminescence (ECL),4 and fluorescent assays that have the advantages of simplicity, fast analysis, cost-effectiveness and high sensitivity.5 As a highly fluorescent DNA probe, SG I is specifically bound to double-stranded (ds) DNA at high ratios to assemble cascade fluorescent nanotags for enhancement of recognition events6 in bioanalysis. QDs have achieved great success in biolabeling and bioimaging7,8 due to their excellent optical properties, such as broader excitation spectra, higher quantum yields, and stronger anti-photobleaching ability.
In order to improve miRNA determination sensitivity, many signal amplification strategies have been developed, including duplex-specific nuclease9 (DSN) signal amplification, rolling circle amplification10 (RCA), cycling amplification and hybridization chain reaction11,12(HCR). Among them, HCR, as an enzyme-free process amplification strategy, has been extensively developed and it shows great promise for detecting various nucleic acid analytes,13 However, some of the proposed assays possess some drawbacks such as high background noise and label-requirement, which would lower the reliability of miRNA detection.14
DNA hydrogel, often as a network of polymer chains, is constructed by crosslinking nucleic acid-tethered polymer chains. DNA hydrogel has garnered increasing attention in sensing and medical fields owing to its loading capacity, mechanical stability, biodegradability, high biocompatibility and stimuli-responsive behaviour.15,16
Herein, a versatile fluorescence strategy based on DNA hydrogel and DNA walking multiple signal amplification is developed for ultrasensitive detection of miRNA-141. Firstly, the presence of target miRNA induced to generate a large number of DNA S3 by walking amplification. Secondly, S3 was linked to hairpin DNA H1 on the SiO2 microsphere, followed by HCR of hairpin DNA H2 (in P1) and H3 (in P2) on SiO2 to form the DNA cross-linked hydrogel. After large amounts of highly fluorescent SG I dyes or CdTe QDs were loaded onto the hydrogel, significantly amplified fluorescence signals were achieved for sensitive detection of miRNAs.
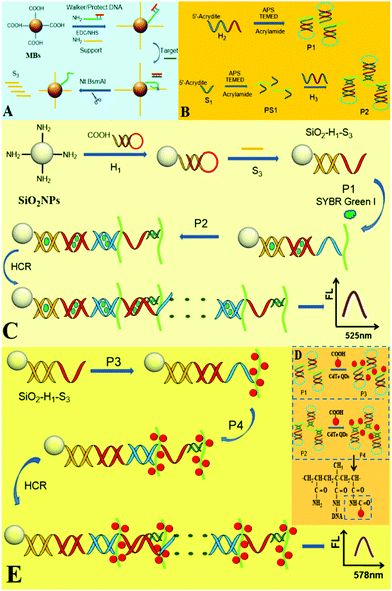
The design principle for the fluorescence detection of miRNA based on the DNA hydrogel-amplified versatile signal probes coupled with DNA walker amplification is shown in Scheme 1. The first part (A) displays the walker amplification process. The protecting (P) probe was first paired with the walker (W) probe to lock it. In the presence of the target miRNA, miRNA hybridized with the P probe to release the W probe, and then the W probe hybridized with the support probe to form a recognition site. Upon shearing of the support probe, the released W probe hybridized with another support probe along the DNA-MB track. Due to the amplification of the walking machine, a large number of DNA S3 were produced. The second part (B) showed the synthesis process of polymers P1 and P2 (polyacrylamide/DNA chains). The acrydite/DNA (H2) and acrylamide were polymerized by C![[double bond, length as m-dash]](https://www.rsc.org/images/entities/char_e001.gif) C to synthesize P1 (Scheme S1, ESI†);17 The acrydite/DNA (S1) and acrylamide were first polymerized to form polymer (PS1), and then H3 hybridized with S1 on the polyacrylamide chains. DNA with phosphate groups (the blue segment in P1 and the dark green segment in P2) were linked to the amino groups of polyacrylamide (green curved line). In part C, after H1 is first conjugated to the SiO2 microsphere, the single-stranded (ss) S3 (produced in A) opened H1 by hybridization, and then red ssDNA of H1 opened the red segment of P1(H2), followed by hybridization of blue ssDNA in P1(H2) with the blue segment in P2(H3) to expose red ssDNA, which thus initiated HCR between P1 and P2 on the SiO2 microsphere to assemble a novel DNA hydrogel. After large amounts of SG-I dyes were intercalated into many long dsDNAs of the hydrogel, the DNA hydrogel-SG I amplified fluorescence platform was fabricated for ultrasensitive detection of the target. Moreover, when a large number of CdTe QDs with carboxyl groups were liked to P1 and P2 with many amino groups to form P3 and P4 (part D), the formed DNA hydrogel-CdTe QD platform provided an enormously amplified fluorescence signal for the highly sensitive assay of miRNAs (part E). Thus, the designed novel DNA hydrogel-amplified versatile fluorescence signal probes were successfully combined with DNA walker amplification for ultrasensitive detection of the target miRNA.
C to synthesize P1 (Scheme S1, ESI†);17 The acrydite/DNA (S1) and acrylamide were first polymerized to form polymer (PS1), and then H3 hybridized with S1 on the polyacrylamide chains. DNA with phosphate groups (the blue segment in P1 and the dark green segment in P2) were linked to the amino groups of polyacrylamide (green curved line). In part C, after H1 is first conjugated to the SiO2 microsphere, the single-stranded (ss) S3 (produced in A) opened H1 by hybridization, and then red ssDNA of H1 opened the red segment of P1(H2), followed by hybridization of blue ssDNA in P1(H2) with the blue segment in P2(H3) to expose red ssDNA, which thus initiated HCR between P1 and P2 on the SiO2 microsphere to assemble a novel DNA hydrogel. After large amounts of SG-I dyes were intercalated into many long dsDNAs of the hydrogel, the DNA hydrogel-SG I amplified fluorescence platform was fabricated for ultrasensitive detection of the target. Moreover, when a large number of CdTe QDs with carboxyl groups were liked to P1 and P2 with many amino groups to form P3 and P4 (part D), the formed DNA hydrogel-CdTe QD platform provided an enormously amplified fluorescence signal for the highly sensitive assay of miRNAs (part E). Thus, the designed novel DNA hydrogel-amplified versatile fluorescence signal probes were successfully combined with DNA walker amplification for ultrasensitive detection of the target miRNA.
The UV–vis absorption spectra were used to investigate the fabrication process of the fluorescence platform. As shown in Fig. S1A (ESI†), SiO2 microspheres show no UV absorbance peak (curve a), while DNA shows an obvious UV absorption peak at 260 nm (curve b). After H1 was bound to SiO2 microspheres, an obvious UV absorption peak appeared at 261 nm, and the peak became wider (curve c). Curve d shows the absorption spectrum of the acrydite monomer, where a weak absorption peak at 202 nm can be observed.18 The acrydite–DNA wavelength region is seen in curve e, where two absorption peaks appeared at 202 nm (the acrylamide group) and 263 nm (DNA), which is consistent with curve d. When acrydite–DNA was copolymerized, the absorption peak at 263 nm (DNA) cannot be seen due to the changed ionic strength of solution and molecular weight of DNA copolymer. As shown in Fig. S1B (ESI†), CdTe QDs show no obvious UV absorbance peak (curve a). When the DNA-modified acrydite polymer (P1) was labeled with CdTe QDs (P3), only the absorption peak at 202 nm could be seen, and this result is consistent with curve f as shown in Fig. S2A (ESI†).
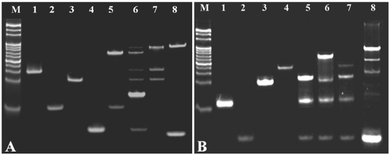
The feasibility of the cycling amplification system was investigated by polyacrylamide gel electrophoresis (PAGE) analysis. As shown in Fig. 1A, lane M is a mark; lanes 1 to 4 showed the walker DNA, protecting DNA, support DNA, and miRNA-141. When the walker DNA (1.5 μM) was mixed with the protecting DNA (4 μM), a new higher band was obtained (lane 5), corresponding to the formed duplex strand DNA, and a lower band corresponding to the surplus protecting DNA. When the walker DNA, protecting DNA, support DNA, and miRNA-141 were all mixed, many new bright bands were observed (lane 6), indicating that several hybridization reactions were performed in the amplification system. The walker DNA first hybridized with the protecting DNA, and then the added miRNA-141 hybridized with the protecting DNA to release the walker to bind with the support DNA. By comparison, when the walker DNA was mixed with the support DNA, an obvious bright band appears at the top of lane 7, which is consistent with the top band appearing in lane 6, indicating that the walker–support dsDNA was formed. Then, nicking endonuclease was added to the above mixture, and a new bright band at the bottom of lane 8 appeared, corresponding to the ssDNA (S3) observed upon shearing the support DNA. The above results indicated that the cycling amplification process is successful.
The feasibility of the HCR system was investigated by PAGE analysis. As shown in Fig. 1B, lane M is a mark; lanes 1–4 were H1, S3, H2, and H3/S1. The hairpin probe H1 exhibited a clear band, in the presence of S3, and H1 was opened upon hybridization, generating a new band at the top of lane 5. By comparison, when H2 was introduced into the mixture of H1 and S3, the hairpin structure of H2(P1) was further opened by the single stranded section of H1, so another new band appeared at the top of lane 6. However, when H3/S1(P2) was added to the mixture of H1 and S3, there was no obvious new band (lane 7), indicating that the hybridization process did not occur. Upon introducing H2 and H3/S1 to the mixture of H1 and S3, a new bright band appeared at the top of lane 8. The above results demonstrated that HCR was successfully performed, and the DNA hydrogel-based amplification fluorescence platform can be fabricated for versatile detection of the target miRNA.
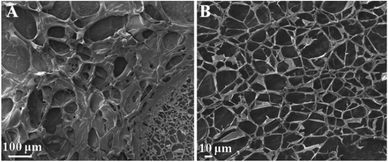
The structure of the formed hydrogel was further investigated by scanning electron microscopy (SEM). As shown in Fig. 2A and B, the freeze-dried hydrogel shows very large pores surrounded by the polymer, consistent with the formation of a hydrogel matrix. During the freeze-drying process of hydrogel samples, the pores are formed by the formation and sublimation of ice crystals, and the uniform pores reflect the formation of a highly cross-linked network structure during gelation (Fig. 2B).
Fig. 3A and B show the SEM and transmission electron microscopy (TEM) images of SiO2 microspheres, respectively. It can be seen that the particle size of SiO2 microspheres is uniform and the average diameter is about 150 nm, and the surface of the microspheres is smooth.
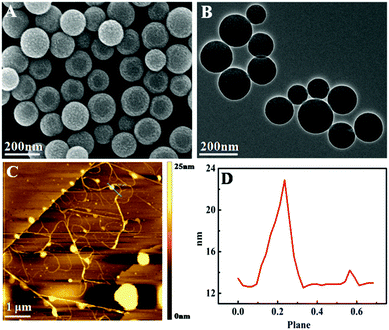 | ||
| Fig. 3 (A) SEM image of SiO2 microspheres; (B) TEM image of SiO2 microspheres; (C) AFM image of SiO2–DNA hydrogel by HCR; and (D) height profile of SiO2–DNA hydrogel by HCR. | ||
To further confirm the DNA hydrogel formation by the HCR process, the morphology of the assembled products was directly visualized by atomic force microscopy (AFM) imaging. As shown in Fig. 3C, when S3, P1, and P2 were incubated with SiO2–H1, abundant long linear polymers were generated by HCR on microspheres, and the thickness of the DNA nanowire was about 23 nm. The HCR products were polydisperse both in size and direction due to the polydirectional assembly of hairpin DNA, and a few smaller linear polymers were produced. The AFM results indicate that the DNA hydrogel was successfully prepared.
In addition, the HCR reaction on the surface of SiO2 microspheres was characterized using TEM. As shown in Fig. S2A (ESI†), the surface of the microsphere is rough compared with that shown in Fig. 3B, as a large amount of dsDNA was formed upon HCR on the microsphere, which proves that the DNA hydrogel was successfully assembled on the microsphere surface. The DNA hydrogel-CdTe QD fluorescence platform on the SiO2 microsphere was also characterized. Fig. S2B (ESI†) shows that the average diameter of the QDs is about 5.0 nm, and the particle size is uniform. After the CdTe QD fluorescence probes (P3 and P4) were formed, Fig. S2C (ESI†) shows that a large amount of polymer material was formed on the surface of the microspheres. These results verified that the QD signal probe (P3 and P4) labeled DNA hydrogel was successfully assembled on the SiO2 microspheres for fluorescence analysis.
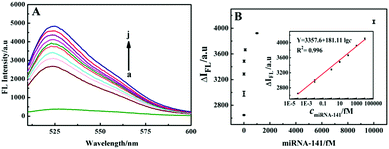
To evaluate the analytical performance of the system for detection of miRNA-141, the FL signal responses to different concentrations of miRNA-141 under optimal conditions (see ESI,† Fig. S5) were recorded. As shown in Fig. 4A, the FL signal of the SG I-based system increased with increasing concentrations of miRNA-141 from 10−6 fM to 100 pM. Fig. 4B shows that the fluorescence intensity has good linear relationship with the logarithm of miRNA-141 concentration from 10−4 fM to 10 pM with a regression equation of Y = 3357.6 + 181.11![[thin space (1/6-em)]](https://www.rsc.org/images/entities/char_2009.gif) lg
lg![[thin space (1/6-em)]](https://www.rsc.org/images/entities/char_2009.gif) c, and a detection limit (LOD) of 10−4 fM. Three parallel experiments were performed with 10 fM miRNA-141, and the relative standard deviation (RSD) was 4.3%, indicating that the SG I-based method has good precision for the target assay.
c, and a detection limit (LOD) of 10−4 fM. Three parallel experiments were performed with 10 fM miRNA-141, and the relative standard deviation (RSD) was 4.3%, indicating that the SG I-based method has good precision for the target assay.
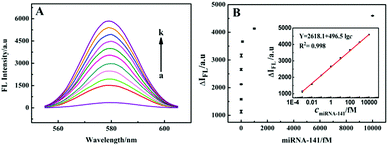
Furthermore, the analytical performance of the system for miRNA-141 detection based on the CdTe QD signal probe was studied. As shown in Fig. 5A, the FL signal increased with the increase of miRNA-141 concentration from 10−3 fM to 1.0 nM, and showed a linear relationship with the logarithm of miRNA-141 concentration from 10−3 fM to 10 pM (Fig. 5B). The linear regression equation is Y = 2618.1 + 496.5![[thin space (1/6-em)]](https://www.rsc.org/images/entities/char_2009.gif) lg
lg![[thin space (1/6-em)]](https://www.rsc.org/images/entities/char_2009.gif) c, and the LOD is 1.1 × 10⁻⁴ fM. A series of three repeated measurements of the 1.0 fM target were carried out, and the calculated relative RSD was 5.2%, suggesting that the method has good reproducibility for miRNA-141 detection. With such ultralow detection limits and very wide linear ranges, the proposed fluorescence methods are more sensitive compared to the other existing miRNA detection methods (Table S2, ESI†), which was mainly attributed to the multiple amplification of the HCR-based DNA hydrogel and DNA walking machine.
c, and the LOD is 1.1 × 10⁻⁴ fM. A series of three repeated measurements of the 1.0 fM target were carried out, and the calculated relative RSD was 5.2%, suggesting that the method has good reproducibility for miRNA-141 detection. With such ultralow detection limits and very wide linear ranges, the proposed fluorescence methods are more sensitive compared to the other existing miRNA detection methods (Table S2, ESI†), which was mainly attributed to the multiple amplification of the HCR-based DNA hydrogel and DNA walking machine.
To investigate the selectivity of the DNA hydrogel-based fluorescence strategy for miRNA assay, different miRNAs including miRNA-21, miRNA-155, miRNA-182, and mismatched miRNA-141 were employed as interfering substances under the same experimental conditions, and the results are exhibited in Fig. S6 (ESI†). When miRNA-141 was present, a significant enhancement of FL intensity was observed, while the FL responses of other miRNAs were obviously very low. These results demonstrate that the fluorescence strategy possesses good selectivity for detection of target miRNA-141.
To investigate the applicability of the fluorescence strategy in real sample analysis, recovery experiments were performed by adding various concentrations of miRNA-141 to the lysates obtained from 22Rvl cancer cells. The results are shown in Table S3 (ESI†), where from 1 to 4 the data indicate the fluorescence recovery rate from 97.19% to 102.57% using SG I dyes, and from 5 to 8 the data indicate the fluorescence recovery rate from 93.45% to 104.7% using CdTe QDs. The results show acceptable recovery, indicating that the proposed method is promising and has potential applications in the analysis of clinical samples.
In conclusion, we have successfully fabricated a new type of DNA hydrogel by polydirectional HCR on SiO2 microspheres, and used it as a versatile fluorescence signal amplifier for ultrasensitive detection of miRNA-141 by coupling with DNA walking amplification. This hydrogel possesses many long multi-branched dsDNAs and can bind large amounts of SG I dyes or CdTe QDs, which significantly amplified fluorescence signals and showed much improved detection sensitivity. Taking the advantages of multiple amplification of DNA walking, HCR, DNA hydrogel, and SiO2 microsphere, the proposed strategy has demonstrated good performance with very wide linear detection ranges and ultralow detection limits, which was much superior to that of the other reported methods (Table S2, ESI†). More importantly, this method can be applied to miRNA-141 detection in human prostate cancer with favorable precision, suggesting promising applications of the sensing strategy in disease diagnosis and biomedical analysis.
This work was supported by the National Natural Science Foundation of China (No. 21575072).
Conflicts of interest
There are no conflicts of interest to declare.Notes and references
- K. W. Witwer, Clin. Chem., 2015, 61, 56–63 CrossRef CAS.
- C. Hong, A. Baek, S. S. Hah, W. Jung and D.-E. Kim, Anal. Chem., 2016, 88, 2999–3003 CrossRef CAS.
- Y. Zhou, H. Yin, J. Li, B. Li, X. Li, S. Ai and X. Zhang, Biosens. Bioelectron., 2016, 79, 79–85 CrossRef CAS.
- Q. Kuang, C. L. Li, Z. W. Qiu, G. F. Jie, S. Y. Niu and T. Y. Huang, Sens. Actuators, B, 2018, 274, 116–122 CrossRef CAS.
- X. Ran, Z. Z. Wang, Z. J. Zhang, F. Pu, J. S. Ren and X. G. Qu, Chem. Commun., 2016, 52, 557–560 RSC.
- R. Wang, F. Zhang, L. Wang, W. Qian, C. Qian, J. Wu and Y. Ying, Anal. Chem., 2017, 89, 4413–4418 CrossRef CAS.
- G. F. Jie, Y. Zhao, X. C. Wang and C. F. Ding, Sens. Actuators, B, 2017, 252, 1026–1034 CrossRef CAS.
- D. V. Talapin, J. S. Lee, M. V. Kovalenko and E. V. Shevchenko, Chem. Rev., 2010, 110, 389–458 CrossRef CAS.
- Q. Xi, D. M. Zhou, Y. Y. Kan, J. Ge, Z. K. Wu, R. Q. Yu and J. H. Jiang, Anal. Chem., 2014, 86, 1361–1365 CrossRef CAS.
- Q. Tian, Y. Wang, R. Deng, L. Lin, Y. Liu and J. Li, Nanoscale, 2015, 7, 987–993 RSC.
- H. Lu, J. Pan, Y. Wang, S. Ji, W. Zhao, X. Luo, J. Xu and H.-Y. Chen, Anal. Chem., 2018, 90, 10434–10441 CrossRef CAS.
- S. Bi, S. Yue and S. Zhang, Chem. Soc. Rev., 2017, 46, 4281–4298 RSC.
- Z. Wu, G. Q. Liu, X. L. Yang and J. H. Jiang, J. Am. Chem. Soc., 2015, 137, 6829–6836 CrossRef CAS.
- K. Zhang, K. Wang, X. Zhu, F. Xu and M. H. Xie, Biosens. Bioelectron., 2017, 87, 358–364 CrossRef CAS.
- L. Peng, C. S. Wu, M. You, D. Han, Y. Chen, T. Fu, M. Ye and W. Tan, Chem. Sci., 2013, 4, 1928–1938 RSC.
- C. H. Lu, X. J. Qi, R. Orbach, H. H. Yang, I. Mironi-Harpaz, D. Seliktar and I. Willner, Nano Lett., 2013, 13, 1298–1302 CrossRef CAS.
- Y. Hu, W. Guo, J. S. Kahn, M. A. Aleman-Garcia and I. Willner, Angew. Chem., 2016, 128, 4282–4286 CrossRef.
- Z.-H. Yang, Y. Zhuo, R. Yuan and Y.-Q. Chai, Nanoscale, 2017, 9, 2556–2562 RSC.
Footnote |
| † Electronic supplementary information (ESI) available: Experimental section, and supporting figures and tables. See DOI: 10.1039/c9cc00565j |
| This journal is © The Royal Society of Chemistry 2019 |

