Anatase TiO2 nanosheets with exposed (001) facets: improved photoelectric conversion efficiency in dye-sensitized solar cells
Jiaguo
Yu
*,
Jiajie
Fan
and
Kangle
Lv
State Key Laboratory of Advanced Technology for Materials Synthesis and Processing, Wuhan University of Technology, Wuhan, 430070, P. R. China. E-mail: jiaguoyu@yahoo.com; Fax: +0086-27-87879468; Tel: +0086-27-87871029
First published on 20th September 2010
Abstract
Dye-sensitized solar cells (DSSCs) are fabricated based on anatase TiO2 nanosheets (TiO2-NSs) with exposed {001} facets, which were obtained by a simple one-pot hydrothermal route using HF as a morphology controlling agent and Ti(OC4H9)4 as precursor. The prepared samples were characterized by scanning electron microscopy, transmission electron microscopy, X-ray diffraction, X-ray photoelectron spectroscopy, UV-vis absorption spectroscopy and N2 adsorption-desorption isotherms. The photoelectric conversion performances of TiO2-NSs solar cells are also compared with TiO2 nanoparticles (TiO2-NPs) and commercial-grade Degussa P25 TiO2 nanoparticle (P25) solar cells at the same film thickness, and their photoelectric conversion efficiencies (η) are 4.56, 4.24 and 3.64%, respectively. The enhanced performance of the TiO2-NS solar cell is due to their good crystallization, high pore volume, large particle size and enhanced light scattering. The prepared TiO2 nanosheet film electrode should also find wide-ranging potential applications in various fields including photocatalysis, catalysis, electrochemistry, separation, purification and so on.
1. Introduction
In recent years, dye-sensitized solar cells (DSSCs) based on TiO2 nanocrystalline porous films have attracted considerable attention because of their low costs and facile fabrication procedures.1–8 At present, they have become a potential low-cost, efficient alternative to the conventional silicon p–n junction solar cells on the market. Generally, DSSCs contain three parts: the dye-sensitized nanocrystalline porous TiO2 film photoanode deposited on a transparent conducting glass, an electrolyte solution penetrating throughout the porous TiO2 film, and the platinized transparent conducting oxide (TCO) glass as the counter electrode. The overall light-to-electricity conversion efficiency is influenced by many factors, including the Pt counter electrode,9 the transmittance and the conductivity of the conducting glass,10,11 the composition of electrolyte solution,12 type of dye sensitizer,13 morphology and textures of porous TiO2 film and so on.7,8,14,15Among various oxide semiconductor photocatalysts, titania has proven to be the most suitable for widespread solar energy conversion and environmental applications due to its biological and chemical inertness, strong oxidizing power, cost effectiveness, long-term stability against photocorrosion and chemical corrosion.8,16–18 It is well known that the morphology, porous structure and crystallinity of TiO2 play important roles in the photoelectric conversion efficiency of DSSCs.7,8,19–26 Therefore, different morphological TiO2, such as nanoparticles,8,21 nanotubes,22–24 nanowires,25 and nanofibers,26 have been applied to fabricate the porous photoanode films. Moreover, many mesoporous TiO2 powders have also been applied to fabricate the porous electrode for DSSCs.27–30 The total photoelectric conversion efficiency has already increased to 11.1% from its original 7.9%.1,29 This enhancement in efficiency is due to the fact that more dye molecules are adsorbed on the surface of TiO2.
The rapid transport and transfer of photogenerated electrons in the porous TiO2 films is pivotal to improve the photoelectric conversion efficiency of DSSCs and reduce the recombination rate of photo-generated electron-hole pairs.7,31 Fabrication of films by one-dimensional (1D) nano-structures has proven to be an effective way to enhance the performance of DSSCs because 1D nano-structures can facilitate electron transport and enhance the light harvesting due to scattering light.7,31–34 However, in most conventional DSSCs, 10–20 nanometre-sized TiO2 nanoparticles are used. The sizes are much smaller than the wavelength of visible light. The film is thus transparent with little light scattering. Incorporation of large nanoparticles (100 to 400 nm) has been employed as light-scattering centers to increase the optical length in the film, and an enhanced light-harvesting has been demonstrated both experimentally7,35 and theoretically.36–38 Therefore, it is reasonable to infer that two-dimensional (2D) nanosheets with sizes approaching 100 nanometres should have a similar effect and such materials are expected to exhibit high light-collection efficiency and a fast motion of charge carriers because their 2D nano-structures can enhance the light harvesting and electron transport rate.
Very recently, the role of fluorine (or fluorine effect) has attracted increasing attention of researchers in the photocatalytic field because of its capability to improve the photocatalytic activity and to control particle morphology of TiO2.39–49 Lu and co-workers reported the synthesis of anatase TiO2 microcrystals with highly energetic {001} facets through the use of hydrofluoric acid as a shape controlling agent.48 Han and co-workers used a similar strategy to synthesize anatase TiO2 nanosheets with 89% exposed {001} facets using hydrofluoric acid solution as the solvent.49 Since the (001) surface of anatase TiO2 nanosheets is much more reactive than the thermodynamically stable (101) surface, the obtained nanosheets will offer a new chance to design highly active photocatalytic materials and devices.50–52 However, to the best of our knowledge, there are few reports focusing on the fabrication of DSSCs based on 2D anatase TiO2 nanosheets (TiO2-NSs) with exposed {001} facets and their photoelectric conversion efficiencies (η). In this work, anatase TiO2-NSs with exposed {001} facets were for the first time applied to prepare the photoanodes of DSSCs and their performances are investigated and discussed and compared with TiO2 nanoparticles (TiO2-NPs) and the commercial photocatalyst Degussa P-25 (P25, a nonporous TiO2 nanopowder) powders.
2. Experimental
2.1 Preparation of anatase TiO2 nanosheets
Anatase TiO2-NSs were prepared by a hydrothermal method similar to that described by Xie et al.49 In a typical experiment, 50 mL of Ti(OC4H9)4 and 6 mL of hydrofluoric acid solution (with a concentration 40 wt%) were mixed in a dried Teflon-lined autoclave with a capacity of 200 mL at room temperature, and then kept at 180 °C for 24 h. The nominal atomic ratio of fluorine to titanium was 1. After hydrothermal reaction, the white precipitates were collected, washed three times with ethanol and distilled water, and then dried in an oven at 80 °C for 6 h. To investigate the effects of particle morphology on photoelectric conversion efficiency of DSSCs, TiO2-NPs are also prepared at the same conditions except 6 mL of hydrofluoric acid was replaced by 6 mL of distilled water.2.2 Fabrication of DSSC cells
To prepare TiO2-NSs photoanodes similar to our recent report,31,53 TiO2 pastes were prepared by mixing 1.5 g TiO2-NSs, 6.5 mL dry alcohol, 2.0 mL distilled water, 0.50 mL acetylacetone and 1.12 mL Triton X-100 in an agate mortar and then grinding by hand for 15 min. The TiO2 films were prepared by the doctor blade method. The F-doped SnO2-coated glass (FTO glass) (Nippon sheet glass, 14–20 Ω/square) was used as substrates. For comparison, the electrodes were also prepared using the prepared TiO2-NPs and P25. The films were annealed at 450 °C for 30 min and their thickness was about 10 μm. After calcination, the films were cooled to 80 °C for dye sensitization.Dye sensitization was performed by immersing TiO2 films in 0.3 mM N719 ruthenium dye (Lausanne, Switzerland) ethanol solution for at least 12 h at room temperature in a sealed beaker. After that, the sensitized porous TiO2 films were washed by anhydrous alcohol, and then dried in an oven at 80 °C for 2 h. Solar cells were assembled in a typical sandwich-type cell by placing a platinum-coated conducting glass on the dye-sensitized electrode separated by a ca. 50 μm polymer spacer. The assembled cell was then clipped together as an open cell. An electrolyte was made with 0.3 M LiI, 0.05 M I2, 0.6 M 1-propyl-3-methylimidazolium iodide, and 0.5 M tert-butylpyridine in dry acetonitrile. The electrolyte was injected into the open cell from the edges and a thin layer of electrolyte was attracted into the inter-electrode space by capillary forces, and the cell was tested immediately.
2.3 Characterization and measurements
The morphology observation was performed on a S-4800 field emission scanning electron microscopy (FESEM, Hitachi, Japan), which was linked with an Oxford Instruments X-ray analysis system, at an accelerating voltage of 10 kV. X-Ray diffraction (XRD) patterns were obtained on a D/MAX-RB X-ray diffractometer (Rigaku, Japan) using Cu Kα irradiation at a scan rate (2θ) of 0.05° s−1 and were used to determine the phase structures of the obtained samples and their crystallite size. The accelerating voltage and applied current were 40 kV and 80 mA, respectively. The crystallite size of anatase titania nanoparticles was quantitatively calculated using the Scherrer formula (d = 0.9λ/Bcos θ, where d, λ, B and θ are crystallite size, Cu Kα wavelength (0.15418 nm), full width at half maximum (FWHM) intensity of the (101) peak in radians and Bragg's diffraction angle, respectively) after correcting the instrumental broadening. Because there is a minor diffraction peak of SnO2 on the base of the anatase (101) peak, the analysis on the anatase (101) peak was performed after the separation of the SnO2 peak. Nitrogen adsorption-desorption isotherms were obtained on an ASAP 2020 (Micromeritics Instruments, USA) nitrogen adsorption apparatus. All the samples were degassed at 180 °C prior to Brunauer-Emmett-Teller (BET) measurements. The BET specific surface area (SBET) was determined by a multipoint BET method using the adsorption data in the relative pressure P/P0 range of 0.05–0.25. The desorption isotherm was used to determine the pore size distribution by using the Barret-Joyner-Halender (BJH) method.54 The nitrogen adsorption volume at P/P0 = 0.995 was used to determine the pore volume and average pore size. Transmission electron microscopy (TEM) analyses were conducted by a JEM-2100F electron microscope (JEOL, Japan), using a 200 kV accelerating voltage. The X-ray photoelectron spectroscopy (XPS) measurement was made in an ultrahigh vacuum VG ESCALAB 210 electron spectrometer equipped with a multichannel detector. The spectra were excited using Mg Kα (1253.6 eV) radiation (operated at 200 W) of a twin anode in the constant analyser energy mode with a pass energy of 30 eV. All the binding energies were referenced to the C1s peak at 284.8 eV of the surface adventitious carbon. UV-vis diffused reflectance spectra of the samples were obtained by a UV-vis spectrophotometer (UV-2550, Shimadzu, Japan). BaSO4 was used as a reflectance standard in a UV-vis diffuse reflectance experiment. The concentration of dye loaded on DSSCs was determined by desorbing the dye from the photoanode surface in a 0.1 M NaOH water–ethanol (v/v = 1![[thin space (1/6-em)]](https://www.rsc.org/images/entities/char_2009.gif) :1) mixed solution and then measuring the absorption of the resultant solution on a UV-vis spectrophotometer (UV-2550, Shimadzu, Japan). The concentration of the dye adsorbed was calculated by the molar extinction coefficient (1.41 × 10⁴ dm3 mol−1 cm−1 at 515 nm as reported previously) and absorption.15
:1) mixed solution and then measuring the absorption of the resultant solution on a UV-vis spectrophotometer (UV-2550, Shimadzu, Japan). The concentration of the dye adsorbed was calculated by the molar extinction coefficient (1.41 × 10⁴ dm3 mol−1 cm−1 at 515 nm as reported previously) and absorption.15
The photocurrent-voltage I–V characteristic curves were measured using an electrochemical analyzer (CHI660C Instruments) controlled by a computer. The light was produced by a solar simulator (Newport 91160) at 100 mW cm−2 (1 sun) intensity. The active area of DSSC was 4 × 4 mm2. The photoelectric conversion efficiency (η) was calculated according to eqn (1):
 | (1) |
The incident monochromatic photoelectric conversion efficiency (IPCE) was measured using Newport's QE/IPCE Measurement Kit, where a monochromator (Newport Cornerstone 130 1/8 m) was used to obtain the monochromatic light from a 300 W Xe lamp (Newport, model no. 6258). The IPCE scan is taken based on an AC (8 Hz) measurement. The IPCE was defined as eqn (2):
 | (2) |
In the above two formulas, η is the global efficiency, VOC, ISC, and FF are open circuit voltage, short circuit current density, and fill factor, respectively. Pin and λ are the light energy and wavelength of the incident monochromatic light, respectively. The measurements were repeated three times for each sample, and the experimental error was found to be within ca. 5%.
3. Results and discussion
TiO2-NSs with exposed {001} facets are fabricated by a simple HF-mediated hydrothermal method (see experimental section). Fig. 1a shows a typical SEM image of TiO2-NSs photoanode surface. A large amount of nanosheets with side length of ca. 70–80 nm, and thickness of ca. 8 nm can be clearly observed. TEM images further confirm that the prepared nanosheets consist of well-defined sheet-shaped structures with a rectangular outline, an average side size of about 70–80 nm and thickness of ca. 8 nm (Fig. 1c and d). The HRTEM image (Fig. 1d) directly shows that the lattice spacing parallel to the top and bottom facets is ca. 0.235 nm, corresponding to the (001) planes of anatase TiO2, which indicates the top and bottom facets of the nanosheets are the (001) and (00![[1 with combining macron]](https://www.rsc.org/images/entities/char_0031_0304.gif) ) planes, respectively. On the basis of the above SEM, TEM and HRTEM results, we can roughly calculate the percentage of exposed {001} facets on the TiO2-NSs. The percentage of exposed {001} facets is about 75%. Usually, the percentage of exposed {001} facets for the TiO2-NPs is less than 10% (ca. 6%).48,49 This indicates that HF plays a key role in the formation of TiO2-NSs with exposed {001} facets. It has been proposed that F− interacts strongly with {001} facets, reducing the surface energy and kinetically inhibiting the crystal growth along {001} facets, thus resulting in the exposure of {001} facets and formation of TiO2-NSs.48
) planes, respectively. On the basis of the above SEM, TEM and HRTEM results, we can roughly calculate the percentage of exposed {001} facets on the TiO2-NSs. The percentage of exposed {001} facets is about 75%. Usually, the percentage of exposed {001} facets for the TiO2-NPs is less than 10% (ca. 6%).48,49 This indicates that HF plays a key role in the formation of TiO2-NSs with exposed {001} facets. It has been proposed that F− interacts strongly with {001} facets, reducing the surface energy and kinetically inhibiting the crystal growth along {001} facets, thus resulting in the exposure of {001} facets and formation of TiO2-NSs.48
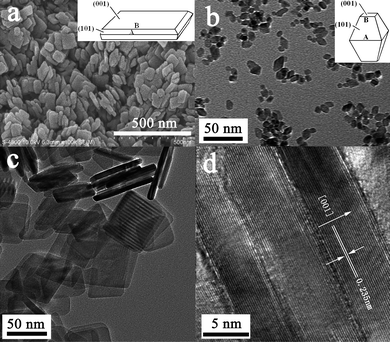 | ||
| Fig. 1 SEM (a), TEM (b and c) and HRTEM (d) images of TiO2-NSs (a, c and d) and TiO2-NPs (b) films calcined at 450 °C. | ||
The phase structure, crystallite size, and crystallinity of TiO2 are of great influence on its photoelectric conversion efficiency (η) of DSSCs.53,55 XRD was used to characterize the difference of phase structures and crystallite sizes of the samples. Fig. 2a shows the XRD pattern of the pure substrate. Strong and sharp diffraction peaks can be observed and all peaks are attributed to the diffraction peaks of SnO2 (JCPDS No. 46-1088; space group: P42/mnm (136); a = 4.750 Å, c = 3.198 Å).53,56Fig. 2b, c and d show XRD patterns of the samples of TiO2-NSs, TiO2-NPs and P25 films calcined at 450 °C, respectively. For the samples of TiO2-NSs and TiO2-NPs, the anatase phase [JCPDS No. 21-1272, space group: I41/amd (141); a = 3.785 Å, c = 9.514 Å] is dominant, but there are several small peaks that exist in their patterns, corresponding to the SnO2 phase. For the P25 film, a small amount of rutile phase [JCPDS No. 21-1276, space group: P42/mnm (136); a = 4.593 Å, c = 2.959 Å] is observed. Further observation indicates that TiO2-NSs show sharper diffraction peaks than TiO2-NPs and P25, indicating its better crystallization and larger crystallites due to the enhanced effect of F−.34 The calculated anatase crystallite sizes according to the Scherrer formula for TiO2-NSs, TiO2-NPs and P25 are 29.4, 10.5 and 24.5 nm, respectively. Table 1 lists the average crystalline sizes and relative crystallinity of the samples of TiO2-NSs, TiO2-NPs and P25 films calcined at 450 °C. It can be seen that the sample of TiO2-NSs has larger average crystalline sizes and better crystallinity. This is in good agreement with the above TEM results.57
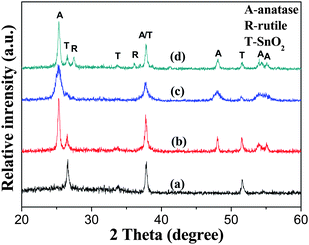 | ||
| Fig. 2 XRD patterns of FTO glass substrate (a), TiO2-NSs (b), TiO2-NPs (c) and P25 (d) films calcined at 450 °C. | ||
| Samples | S BET/m2 g−1 | Pore volume/cm3 g−1 | Average pore size/nm | Porosity (%) | Crystallite size/nm | Relative crystallinity |
|---|---|---|---|---|---|---|
| a A: anatase. Relative anatase crystallinity: the relative intensity of the diffraction peak from the anatase (101) plane (reference = TiO2-NPs). | ||||||
| TiO2-NSs | 44 | 0.42 | 32.7 | 62.1 | 29.4 (A) | 1.54 |
| TiO2-NPs | 101 | 0.36 | 14.2 | 58.4 | 10.5 (A) | 1 |
| P25 | 45 | 0.15 | 13.6 | 36.9 | 24.5 (A) | 1.23 |
Nitrogen adsorption-desorption isotherms were measured to determine the specific surface areas and pore size distribution of the samples of TiO2-NSs and TiO2-NPs (see Fig. 3). The isotherms corresponding to the sample of TiO2-NPs are of type IV according to Brunauer-Deming-Deming-Teller (BDDT) classification, as indicated by a hysteresis loop at high relatively pressures associated with capillary condensation of gases within mesopores (2–50 nm).54,57,58 The hysteresis loop is of type H2, which is consistent with pores with narrow necks and wider bodies (ink-bottle pores). The pore size distribution (inset in Fig. 3) calculated from the desorption branch of the nitrogen isotherm by the BJH method shows a wide range from 2 to 60 nm with a maximum pore diameter of about 9.0 nm.54,57,58 The presence of fluoride in the synthesis system exerts a significant influence on the pore structure and BET surface areas of the obtained products (Table 1). For the sample of TiO2-NSs, the average pore size and pore volume increase and the BET surface areas decrease due to growth of TiO2 crystallites (see Table 1). Furthermore, the shapes of the hysteresis loops change from type H2 to H3, indicating the presence of slit-like pores. The isotherms show high absorption at high relative pressure (P/P0) range (approaching 1.0), indicating the formation of large mesopores and macropores. In fact, the single-crystal nanosheets do not contain mesopores and macropores. Therefore, the existing nanopores (or pore volume) are from the aggregation of nanosheets.58 Such organized porous structures might be extremely useful in solar cells as they would provide efficient transport pathways to electrolyte molecules.
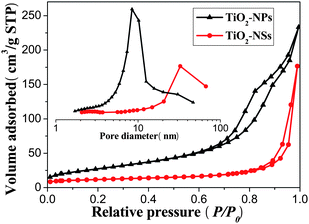 | ||
| Fig. 3 Nitrogen adsorption-desorption isotherms and the corresponding pore size distribution curves (inset) of the TiO2-NSs and TiO2-NPs powders scraped from their 450 °C calcined films. | ||
Comparison of the I–V characteristics of DSSCs made from TiO2-NSs, TiO2-NPs and P25 films is shown in Fig. 4. The three cells have very similar VOC and FF, however, their ISC and η are different. TiO2-NSs cell exhibit the largest ISC and highest η (4.56%). This can be attributed to the following reasons. First, the pore volume of TiO2-NSs film is larger than that of TiO2-NPs and P25 film, which can enhance transfer and diffusion of electrolyte. It is well known that the efficient diffusion of I3−/I− to regenerate the dye is important to the photovoltaic response of the solar cells. Second, comparing with TiO2-NPs and P25, the 2D nanosheets with exposed {001} facets can enhance the efficiency because theoretical and experimental studies have indicated that the (001) surface of anatase TiO2 is much more reactive than the thermodynamically more stable (101) surface, implying that the dye molecules are more easily and tightly adsorbed on the surface of TiO2-NSs.48,58 Third, good crystallization of TiO2-NSs, meaning fewer defects (i.e. imperfections, impurities, dangling bonds, or microvoids) located on the surface and in the bulk of particles, is beneficial to reduce the recombination of photo-generated electrons and holes at defects.58 Finally, light scattering from 2D TiO2-NSs extends the distance that light travels within the photoelectrode film and provides the photons with more opportunities to be absorbed by the dye molecules, resulting in a significant increase in the light-harvesting capability of the photoelectrode,7 because the scattering only occurs when the particle size is comparable to the wavelength of incident light. For TiO2-NPs and P25 DSSC, the light scattering effect is usually ignored due to their size being smaller than 30 nm, which is far away from the wavelength of visible light. All these factors contribute to the enhancement of photovoltaic conversion performance of TiO2-NSs DSSCs. Fig. 5 displays comparison of IPCE of DSSCs made from TiO2-NSs, TiO2-NPs and P25 as a function of wavelength. The IPCE is in good agreement with the photoelectric conversion efficiency of the solar cells (see Fig. 4 and Table 2). The maximum value of the IPCE spectra appears at ca. 530–540 nm, and the IPCE of TiO2-NSs solar cell is about 19.3% at 540 nm, obviously higher than that of the TiO2-NPs (16.3%) and P25 (10.7%) solar cells. The surface concentration of N719 dye adsorbed on TiO2-NSs, TiO2-NPs and P25 photoanodes is 1.43 × 10⁻⁷, 2.14 × 10⁻⁷ and 1.12 × 10⁻⁷ mol. cm−2, respectively. Although the TiO2-NSs film adsorbs fewer dye molecules than TiO2-NPs film, the former containing less dye still shows a higher efficiency, indicating that the sheet-like morphology and exposed (001) facets indeed play an important role in the enhancement of solar cell performance.
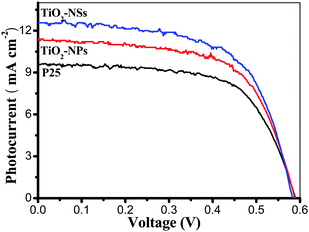 | ||
| Fig. 4 Comparison of the I–V characteristics of DSSCs made from TiO2-NSs, TiO2-NPs and P25 films calcined at 450 °C. | ||
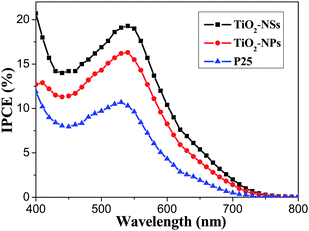 | ||
| Fig. 5 IPCE of DSSCs made from TiO2-NSs, TiO2-NPs and P25 films calcined at 450 °C. | ||
| Samples | I SC/mA cm−2 | V OC/V | FF | η (%) |
|---|---|---|---|---|
| TiO2-NSs | 12.5 | 0.583 | 0.627 | 4.56 |
| TiO2-NPs | 11.3 | 0.588 | 0.638 | 4.24 |
| P25 | 9.61 | 0.589 | 0.643 | 3.64 |
UV-vis diffuse reflectance spectra of the samples of TiO2-NSs, TiO2-NPs and P25 are compared and shown in Fig. 6. The onsets of the absorption edges for TiO2-NSs and TiO2-NPs are at ca. 390 nm, which is consistent with the intrinsic bandgap absorption of pure anatase TiO2 (∼3.2 eV). It is apparent that the diffuse reflectance spectra of P25 exhibit a red shift of absorption edge due to the presence of the rutile phase. All the samples exhibit relatively strong absorption in the visible light region due to the adsorption of dye molecules on the surface of TiO2 compared with pure TiO2 samples.59 Further observation indicates that the absorption in the visible-light range has a great difference for the three samples. The TiO2-NSs sample presents the strongest visible-light absorption from 400 to 800 nm. Contrarily, the P25 sample shows the weakest visible-light absorption. Undoubtedly, UV-vis diffuse reflectance spectra of the samples further support our above explanation based on light-scattering.
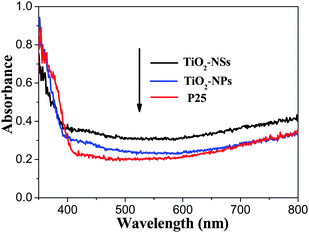 | ||
| Fig. 6 UV-vis diffuse reflectance spectra of the TiO2-NSs, TiO2-NPs and P25 films calcined at 450 °C. | ||
The TiO2-NSs was prepared in the electrolyte containing HF, so the surface of TiO2-NSs was readily fluorinated. To further clarify whether surface fluorination influences the performance of solar cells, the chemical composition and chemical status of TiO2-NSs before and after 450 °C calcination were analyzed by XPS. Fig. 7a shows comparison of the XPS survey spectra of TiO2 NSs before and after 450 °C calcination. Sharp photoelectron peaks appear at binding energies of 458 (Ti 2p) and 531 eV (O 1s) in both cases, along with a C 1s peak at 285 eV due to contamination from the XPS instrument itself. For uncalcined TiO2-NSs, the F1s peak at 684.5 eV is observed due to surface fluorination. After 450 °C calcination, the XPS peak of F1s almost disappears due to evaporation of F element, suggesting that the F− in TiO2 is not stable and is easily removed by calcination treatment. High resolution XPS spectra (Fig. 7b) of F1s further indicate that no signal for F− in the lattice (BE = 688.5 eV) is found, implying all F− is adsorbed on the surface of TiO2-NSs.60–64 This is not surprising because the hydrothermal environment is not beneficial to doping and can accelerate crystallization of TiO2 by an in situ dissolution-recrystallization process, resulting in the reduction of the number of defects and impurities within TiO2 crystals.58,60 The amount of F in TiO2-NSs samples before and after 450 °C calcination is ca. 5.1 and 0.5 (at)%, respectively, indicating that most F element is removed by a 450 °C calcination. Consequently, we have not considered the effect of element F on solar cell performance in this study.
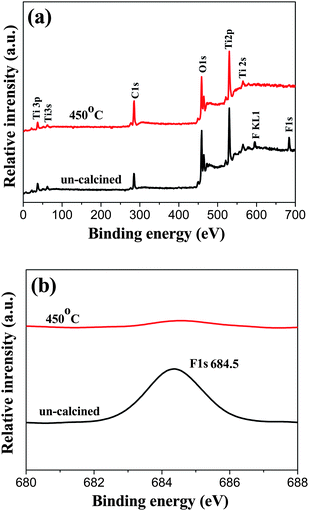 | ||
| Fig. 7 XPS survey spectra (a) and high-resolution XPS spectra of the F1s region (b) of the TiO2-NSs powders scraped from the uncalcined and 450 °C calcined TiO2-NSs films. | ||
4. Conclusions
In summary, anatase TiO2 nanosheets and nanoparticles can be fabricated by the hydrothermal method in the presence and absence of HF, respectively. The photoelectric conversion efficiencies of DSSCs based on TiO2 nanosheets, nanoparticles and P25 are compared at the same film thickness, and their photoelectric conversion efficiencies (η) are 4.56, 4.24 and 3.64%, respectively. The enhanced performance of the TiO2 nanosheet cell is due to its good crystallization, high pore volume, large particle size and enhanced light scattering. The prepared TiO2 nanosheet film electrode is also of great interest in photocatalysis, catalysis, electrochemistry, separation, purification and so on. This investigation for the first time confirms that anatase TiO2 nanosheets (TiO2-NSs) with exposed {001} facets can improve photoelectric conversion efficiency of DSSCs due to enhancement of light scattering and high activity of {001} facets.Acknowledgements
This work was partially supported by the National Natural Science Foundation of China (50625208, 20773097 and 20877061), CHCL09006 and the National Basic Research Program of China (2007CB613302).References
- B. O’Regan and M. Gratzel, Nature, 1991, 353, 737 CrossRef CAS.
- M. Gratzel, Nature, 2001, 414, 338 CrossRef CAS.
- M. K. Nazeeruddin, A. Kay, I. Rodicio, R. Humphry-Baker, E. Muller, P. Liska, N. Vlachopoulos and M. Gratzel, J. Am. Chem. Soc., 1993, 115, 6382 CrossRef CAS.
- A. Hagfeldt and M. Gratzel, Chem. Rev., 1995, 95, 49 CrossRef CAS.
- I. Robel, V. Subramanian, M. Kuno and P. V. Kamat, J. Am. Chem. Soc., 2006, 128, 2385 CrossRef CAS.
- M. Gratzel, J. Photochem. Photobiol., C, 2003, 4, 145 CrossRef CAS.
- B. Tan and Y. Y. Wu, J. Phys. Chem. B, 2006, 110, 15932 CrossRef CAS.
- D. Zhao, T. Y. Peng, L. L. Lu, P. Cai, P. Jiang and Z. Q. Bian, J. Phys. Chem. C, 2008, 112, 8486 CrossRef CAS.
- X. Fang, T. Ma, G. Guan, M. Akiyama, T. Kida and E. Abe, J. Electroanal. Chem., 2004, 570, 257 CrossRef CAS.
- N. J. Podraza, C. Chen, D. Sainju, O. Ezekoye, M. W. Horn, C. R. Wronski and R. W. Collins, Mater. Res. Soc. Symp. Proc., 2005, 865, 273 CAS.
- W. J. Lee, E. Ramasamy, D. Y. Lee, B. K. Min and J. S. Song, Proc. SPIE-Int. Soc. Opt. Eng., 2006, 6038, 413.
- K. Hara, T. Nishikawa, M. Kurashige, H. Kawauchi, T. Kashima, K. Sayama, K. Aika and H. Arakawa, Sol. Energy Mater. Sol. Cells, 2005, 85, 21 CAS.
- M. K. Nazeeruddin, P. Pechy, T. Renouard, S. M. Zakeeruddin, R. Humphry-Baker, P. Comte, P. Liska, L. Cevey, E. Costa, V. Shklover, L. Spiccia, G. B. Deacon, C. A. Bignozzi and M. Gratzel, J. Am. Chem. Soc., 2001, 123, 1613 CrossRef CAS.
- Y. Kondo, H. Yoshikawa, K. Awaga, M. Murayama, T. Mori, K. Sunada, S. Bandow and S. Iijima, Langmuir, 2008, 24, 547 CrossRef CAS.
- Z. S. Wang, H. Kawauchi, T. Kashima and H. Arakawa, Coord. Chem. Rev., 2004, 248, 1381 CrossRef CAS.
- J. G. Yu, Y. R. Su and B. Cheng, Adv. Funct. Mater., 2007, 17, 1984 CrossRef CAS.
- J. G. Yu, L. J. Zhang, B. Cheng and Y. R. Su, J. Phys. Chem. C, 2007, 111, 10582 CrossRef CAS.
- J. G. Yu, W. G. Wang, B. Cheng and B. L. Su, J. Phys. Chem. C, 2009, 113, 6743 CrossRef CAS.
- S. Nakade, Y. Saito, W. Kubo, T. Kitamura, Y. Wada and S. Yanagida, J. Phys. Chem. B, 2003, 107, 8607 CrossRef CAS.
- Y. Saito, S. Kambe, T. Kitamura, Y. Wada and S. Yanagida, Sol. Energy Mater. Sol. Cells, 2004, 83, 1 CrossRef CAS.
- M. Gratzel, J. Photochem. Photobiol., A, 2004, 168, 235 CrossRef.
- S. Uchida, R. Chiba, M. Tomiha, N. Masaki and M. Shirai, Electrochemistry, 2002, 70, 418 CAS.
- M. Adachi, Y. Murata, I. Okada and S. Yoshikawa, J. Electrochem. Soc., 2003, 150, G488 CrossRef CAS.
- (a) G. K. Mor, K. Shankar, M. Paulose, O. K. Varghese and C. A. Grimes, Nano Lett., 2006, 6, 215 CrossRef CAS; (b) J. Wang and Z. Q. Lin, Chem. Mater., 2010, 22, 579 CrossRef CAS; (c) J. Wang, L. Zhao, V. S. Y. Lin and Z. Q. Lin, J. Mater. Chem., 2009, 19, 3682 RSC.
- M. Adachi, Y. Murata, J. Takao, J. Jiu, M. Sakamoto and F. Wang, J. Am. Chem. Soc., 2004, 126, 14943 CrossRef CAS.
- M. Y. Song, D. K. Kim, K. J. Ihn, S. M. Jo and D. Y. Kim, Nanotechnology, 2004, 15, 1861 CrossRef CAS.
- S. Ngamsinlapasathian, S. Pavasupree, Y. Suzuki and S. Yoshikawa, Sol. Energy Mater. Sol. Cells, 2006, 90, 3187 CrossRef CAS.
- M. D. Wei, Y. Konishi, H. S. Zhou, M. Yanagida, H. Sugihara and H. Arakawa, J. Mater. Chem., 2006, 16, 1287 RSC.
- Y. Chiba, A. Islam, Y. Watanabe, R. Komiya, N. Koide and L. Y. Han, Jpn. J. Appl. Phys., 2006, 45, L638 CrossRef CAS.
- K. Hou, B. Z. Tian, F. Y. Li, Z. Q. Bian, D. Y. Zhao and C. H. Huang, J. Mater. Chem., 2005, 15, 2414 RSC.
- L. Zhao, J. G. Yu, J. J. Fan, P. C. Zhai and S. M. Wang, Electrochem. Commun., 2009, 11, 2052 CrossRef CAS.
- M. Law, L. E. Greene, J. C. Johnson, R. Saykally and P. Yang, Nat. Mater., 2005, 4, 455 CrossRef CAS.
- Y. Ohsaki, N. Masaki, T. Kitamura, Y. Wada, T. Okamoto, T. Sekino, K. Niihara and S. Yanagida, Phys. Chem. Chem. Phys., 2005, 7, 4157 RSC.
- J. Jiu, S. Isoda, F. Wang and M. Adachi, J. Phys. Chem. B, 2006, 110, 2087 CrossRef CAS.
- M. K. Nazeeruddin, R. Splivallo, P. Liska, P. Comte and M. Gratzel, Chem. Commun., 2003, 1456 RSC.
- A. Usami, Chem. Phys. Lett., 1997, 277, 105 CrossRef CAS.
- J. Ferber and J. Luther, Sol. Energy Mater. Sol. Cells, 1998, 54, 265 CrossRef CAS.
- G. Rothenberger, P. Comte and M. Gratzel, Sol. Energy Mater. Sol. Cells, 1999, 58, 321 CrossRef CAS.
- H. Park and W. Choi, J. Phys. Chem. B, 2004, 108, 4086 CrossRef CAS.
- J. C. Yu, J. G. Yu, W. K. Ho, Z. T. Jiang and L. Z. Zhang, Chem. Mater., 2002, 14, 3808 CrossRef CAS.
- (a) J. C. Yu, W. K. Ho, J. G. Yu, S. K. Hark and K. Iu, Langmuir, 2003, 19, 3889 CrossRef CAS; (b) J. G. Yu and L. Shi, J. Mol. Catal. A: Chem., 2010, 326, 8 CrossRef CAS.
- C. Minero, G. Mariella, V. Maurino, D. Vione and E. Pelizzetti, Langmuir, 2000, 16, 8964 CrossRef CAS.
- C. Minero, G. Mariella, V. Maurino and E. Pelizzetti, Langmuir, 2000, 16, 2632 CrossRef CAS.
- C. M. Wang and T. E. Mallouk, J. Am. Chem. Soc., 1990, 112, 2016 CrossRef.
- A. Hattori, M. Yamamoto, H. Tada and S. Ito, Chem. Lett., 1998, 707 CrossRef CAS.
- H. G. Yang and H. C. Zeng, J. Phys. Chem. B, 2004, 108, 3492 CrossRef CAS.
- J. G. Yu, S. W. Liu and H. G. Yu, J. Catal., 2007, 249, 59 CrossRef.
- H. G. Yang, C. H. Sun, S. Z. Qiao, J. Zou, G. Liu, S. C. Smith, H. M. Cheng and G. Q. Lu, Nature, 2008, 453, 638 CrossRef CAS.
- X. G. Han, Q. Kuang, M. S. Jin, Z. X. Xie and L. S. Zheng, J. Am. Chem. Soc., 2009, 131, 3152 CrossRef CAS.
- Y. Q. Dai, C. M. Cobley, J. Zeng, Y. M. Sun and Y. N. Xia, Nano Lett., 2009, 9, 2455 CrossRef CAS.
- F. Amano, T. Yasumoto, O. O. Prieto-Mahaney, S. Uchida, T. Shibayama and B. Ohtani, Chem. Commun., 2009, 2311 RSC.
- J. G. Yu and J. Zhang, Dalton Trans., 2010, 39, 5860 RSC.
- J. G. Yu, J. J. Fan and L. Zhao, Electrochim. Acta, 2010, 55, 597 CrossRef CAS.
- K. S. W. Sing, D. H. Everett, R. A. W. Haul, L. Moscou, R. A. Pierotti, J. Rouquerol and T. Siemieniewska, Pure Appl. Chem., 1985, 57, 603 CrossRef CAS.
- N. G. Park, J. V. D. Lagemeaat and A. J. Frank, J. Phys. Chem. B, 2000, 104, 8989 CrossRef CAS.
- J. G. Yu and M. H. Zhou, Nanotechnology, 2008, 19, 045606 CrossRef.
- J. G. Yu, G. H. Wang, B. Cheng and M. H. Zhou, Appl. Catal., B, 2007, 69, 171 CrossRef CAS.
- Q. J. Xiang, K. L. Lv and J. G. Yu, Appl. Catal., B, 2010, 96, 557 CrossRef CAS.
- J. G. Yu, Q. J. Xiang and M. H. Zhou, Appl. Catal., B, 2009, 90, 595 CrossRef CAS.
- J. G. Yu, Q. J. Xiang, J. R. Ran and S. Mann, CrystEngComm, 2010, 12, 872 RSC.
- D. Li, H. Haneda, S. Hishita and N. Ohashi, Chem. Mater., 2005, 17, 2588 CrossRef CAS.
- D. G. Huang, S. J. Liao, J. M. Liu, Z. D. ang and L. Petrik, J. Photochem. Photobiol., A, 2006, 184, 282 CrossRef CAS.
- D. Li, H. Haneda, S. Hishita, N. Ohashi and N. K. Labhsetwar, J. Fluorine Chem., 2005, 126, 69 CrossRef CAS.
- S. W. Liu, J. G. Yu and M. Jaroniec, J. Am. Chem. Soc., 2010, 132, 11914 CrossRef CAS.
| This journal is © The Royal Society of Chemistry 2010 |