
 Open Access Article
 This Open Access Article is licensed under a
 Creative Commons Attribution 3.0 Unported Licence
Orcinol and resorcinol induce local ordering of water molecules near the liquid–vapor interface†
Huanyu
Yang
 ab,
Ivan
Gladich
c,
Anthony
Boucly
ad,
Luca
Artiglia
ae and
Markus
Ammann
*a
ab,
Ivan
Gladich
c,
Anthony
Boucly
ad,
Luca
Artiglia
ae and
Markus
Ammann
*a
aLaboratory of Environmental Chemistry, Paul Scherrer Institut, 5232 Villigen, Switzerland. E-mail: markus.ammann@psi.ch
bInstitute of Atmospheric and Climate Science, ETH Zürich, 8092 Zürich, Switzerland
cQatar Environment & Energy Research Institute, Hamad Bin Khalifa University, P.O. Box 34110, Doha, Qatar
dElectrochemistry Laboratory, Paul Scherrer Institut, 5232 Villigen, Switzerland
eLaboratory for Catalysis and Sustainable Chemistry, Paul Scherrer Institut, 5232 Villigen, Switzerland
First published on 23rd August 2022
Abstract
Resorcinol and orcinol are simple members of the family of phenolic compounds present in particulate matter in the atmosphere; they are amphiphilic in nature and thus surface active in aqueous solution. Here, we used X-ray photoelectron spectroscopy to probe the concentration of resorcinol (benzene-1,3-diol) and orcinol (5-methylbenzene-1,3-diol) at the liquid–vapor interface of aqueous solutions. Qualitatively consistent surface propensity and preferential orientation was obtained by molecular dynamics simulations. Auger electron yield near-edge X-ray absorption fine structure (NEXAFS) spectroscopy was used to probe the hydrogen bonding (HB) structure, indicating that the local structure of water molecules near the surface of the resorcinol and orcinol solutions tends towards a larger fraction of tetrahedrally coordinated molecules than observed at the liquid–vapor interface of pure water. The order parameter obtained from the molecular dynamics simulations confirm these observations. This effect is being discussed in terms of the formation of an ordered structure of these molecules at the surface leading to patterns of hydrated OH groups with distances among them that are relatively close to those in ice. These results suggest that the self-assembly of phenolic species at the aqueous solution–air interface could induce freezing similar to the case of fatty alcohol monolayers and, thus, be of relevance for ice nucleation in the atmosphere. We also attempted at looking at the changes of the O 1b1, 3a2 and 1b2 molecular orbitals of liquid water, which are known to be sensitive to the HB structure as well, in response to the presence of resorcinol and orcinol. However, these changes remained negligible within uncertainty for both experimentally obtained valence spectra and theoretically calculated density of states.
Environmental significanceIce nucleation is one of the key processes in the atmosphere to control cloud occurrence and properties as well as precipitation. Ice nucleation is still poorly understood at the molecular level. Some specific organic compounds are known as particularly good ice nuclei through their ability to order water in their vicinity through patterns of OH groups in a way to facilitate heterogeneous nucleation of ice. Here, we show that orcinol and resorcinol, simple models of a ubiquitously occurring class of organic compounds in the atmosphere, form ordered structures at the liquid–vapor interface of aqueous solutions that induce a higher fraction of tetrahedrally coordinated water molecules in the nearby liquid. This ordering may help to nucleate ice in the atmosphere. |
1. Introduction
Liquid–vapor interfaces are ubiquitous in the atmosphere, ranging from cloud water droplets, liquid aerosols, to fresh water and oceans. They provide a huge space for phase transfer processes, heterogeneous chemical reactions, and nucleation of solid or other liquid phases. In particular, the nucleation of ice is of paramount importance in atmospheric chemistry and physics.1 Freezing of clouds is essential in the formation of precipitation, and ice clouds are covering large parts of the upper troposphere and thus affect the radiative balance of the Earth.2 Despite its importance and a large body of literature on experimental and theoretical investigations, the nucleation of ice is still insufficiently understood.Based on theory and mostly non-linear vibrational spectroscopy experiments, it has been suggested that the local structure of water near ice nucleation (IN) active substrates may be characterized by a comparably large fraction of tetrahedrally coordinated water molecules.3 In pure liquid water this would only occur at low temperatures, towards temperatures at which homogeneous nucleation could occur. This property of IN active substrates to order water may be a component involved in heterogeneous nucleation of ice at higher temperature. In the context of organic species in the atmosphere, such ordering effects have been discussed for IN active proteins and organic surfactants,4,5 possibly related to a pattern of hydrophilic groups intermitted by hydrophobic moieties in these materials. OH groups are well known to facilitate such ordering effects. For instance, phloroglucinol (benzene-1,3,5-triol), probably one of the most IN active materials overall,6–8 in its dihydrate crystal form, exhibits a pattern of hydrophilic OH groups on one of its faces (orthogonal to the stacks of the aromatic rings) that provides close lattice match to ice, while hydrophobic moieties modulate the interaction strength to facilitate water ordering in tetrahedral coordination.9 A long record of studies exists on the freezing behavior of long chain fatty alcohols, which is linked to their ability to form ordered 2D structures leading to OH group patterns commensurable with the lattice of ice.10–19 The role of such fatty alcohol monolayers as IN active material has also been suggested to be of minor relevance, because the intermolecular forces driving this ordering are relative weak and especially for the complex mixtures of organic material in atmospheric aerosol particles would rarely allow the formation of ordered monolayers or large enough patches.18 For fatty alcohols (or related species) the formation of strongly ordered 2D phases is limited to insoluble, long-chain representatives of alcohols. In turn, aromatic compounds are known to undergo π stacking leading to pronounced self-aggregation on surfaces. For instance, such self-aggregation induces structural order among phenol molecules on the liquid water surface and, at the same time, among the hydrated OH groups underneath, which leads to changes in the nearby water structure.20 Thus, such surface active aromatic solutes with hygroscopic functional groups such as OH may promote IN, counteracting their effect as solutes that lower the freezing temperature.21
Phenolic compounds (aromatic compounds with varying OH substitution) occur as constituents in atmospheric particles in the ng to μg m−3 range.22,23 Phenolic species and methylated derivatives may be formed from oxidation of aromatic precursors such as benzene,24 phenol or cresols.25 A large primary source of phenolic species is biomass burning (wildfires or residential fires), in which they constitute a substantial fraction of particulate mass, accompanied by a range of methoxyphenols.26–28 The atmospheric lifetime against oxidation is between hours and days,22 also allowing long-range transport within the troposphere and into the stratosphere.29 Ring retaining oxidation in the gas and aqueous phase leads to further hydroxylation and also to formation of polyphenols, which contribute to mass and light absorption of secondary organic aerosol.28,30,31
In this work, we characterize the surface propensity and the orientation of the organic and the hydrogen bonding (HB) structure of water molecules at the liquid–vapor interface in presence of resorcinol (benzene-1,3-diol, RES) and orcinol (5-methylbenzene-1,3-diol, ORC) in water. RES and ORC are simple members of the family of monomeric phenolic compounds. RES has been directly determined, usually along with catechol (benzene-1,2-diol), in biomass burning emissions and in wildfire plumes.32–35 ORC and other methyl- and dimethylbenzendiol isomers have been detected in biomass burning emissions as well.36,37 When dissolved in aqueous aerosols or cloud droplets, due to their amphiphilic nature with a hydrophobic aromatic ring and hydrophilic OH groups, these molecules exhibit significant propensity for the liquid–vapor interface.38–40 RES is substantially less reactive than catechol and therefore better suited for the present study. The distance among the two OH groups is similar to that in the trihydroxybenzene phloroglucinol mentioned above. ORC features an additional methyl group (but identical OH substitution) that leads to lower solubility and higher surface activity. Early studies have addressed the ice nucleation activity of RES41 and other related compounds.42–44
Liquid jet X-ray photoelectron spectroscopy (XPS) is a powerful surface sensitive technique to probe the liquid–vapor interface within nm depths of the surface.45–51 The shallow probe depth, and thus its surface sensitivity, is the result of strong inelastic scattering of photoelectrons. The inelastic mean free path (IMFP), and thus the depth from which they can escape, is on the order of nm and much shorter than the attenuation length of soft X-rays on the order of μm. Because the photoemission intensity is proportional to the sample's atomic density, XPS can provide quantitative elemental ratios and thus gives access to surface composition. Moreover, element oxidation states, chemical bonding and molecular orientation can be assessed.47,48,51–53 As the IMFP of photoelectrons depends on their kinetic energy, the tunable photon energy provided by a synchrotron light source offers the possibility of varying the probe depth.54 Photoelectron spectroscopy also provides insights on the valence states of aqueous solutions. The valence levels of water are determined by the physical environment (e.g., the hydrogen bonding (HB) structure, or local orientation) and can be used to determine the effect of solute addition on the local HB structure of water.49 The difference in the relative photoemission intensity related to the excitation of 1b1, 3a1 and 1b2 molecular orbitals (MO) between liquid water and ice have been (tentatively) associated with changes of the water HB network between the two phases.55–57
O K-edge near edge X-ray absorption fine structure (NEXAFS) spectroscopy probes the absorption of electro-magnetic radiation by excitation of core electrons into unoccupied molecular orbitals via dipole induced transitions. Similar to the case of valence level photoemission, the O K-edge NEXAFS spectra are sensitive to the local HB network and enable the identification of water that is tetrahedrally coordinated as in ice or in a more disordered configuration as in liquid water.58–61 When detected in electron yield mode, NEXAFS provides this configurational information over just a few nanometer of depth beneath the surface, again due to the short IMFP of the electrons detected.
Atomistic simulations based on molecular dynamics simulations can enable the study of physicochemical processes at atomic and molecular resolution, a resolution which is often hardly accessible experimentally. Classical MD relies on a force field, i.e., a set of predefined parameters and functional forms, describing all the inter- and intramolecular interactions. Thanks to that, classical MD can nowadays model systems of thousands of atoms, spanning hundreds of nanometer in extent, and time scales up to microseconds, which makes this type of simulations suitable for studying adsorption and solvation processes.62,63 In first-principle (FP) MD forces are calculated on-the-fly by electronic structure calculations (usually) at density functional theory: FPMDs has propelled and supported studies of chemical reactions and spectroscopy but their computational cost limits the spatial and temporal scales that can be explored.63–65
This work combines experimental results with theoretical atomistic simulations to measure and characterize the surface properties of RES and ORC aqueous solutions. Spectroscopic results show the orientation of surfactants and local ordering of water molecules at the liquid–vapor interface. MD simulations and Density of States (DOS) calculations support the interpretation of the experimental findings, quantifying the solvation preference (i.e., bulk vs. surface) of ORC and RES and the tetrahedral ordering of interfacial liquid water induced by the two adsorbates.
This work is not directly providing a parameterization to calculate ice nucleation rates in the atmosphere but aims at improving the fundamental understanding of how ice nucleation active materials influence water with which they are in contact.
2. Sample and experimental methods
2.1 XPS and NEXAFS
RES (benzene-1,3-diol) and ORC (5-methylbenzene-1,3-diol) were purchased from Sigma-Aldrich and VWR-international, respectively. Both were used without further purification. By using Millipore water (conductivity 18.2 MΩ), followed by deaeration with an inert gas (Ar), we prepared 0.01 and 2.0 M solutions of RES, as well as 0.01 M and 0.2 M solution of ORC. The solutions were not adjusted for pH; the pKa values of RES and ORC are 9.4 and 9.6, respectively. Thus, both are assumed to remain undissociated. While RES is very soluble (717 g L−1 (25 °C)66,67), the solubility of ORC is lower (estimated at 16 and 104 g L−1 (25 °C)68). Therefore, the 0.2 M remains sufficiently below the solubility limit to avoid clogging in the liquid jet nozzle (see below). All solutions contained 0.05 M NaCl to limit the build-up of streaming potentials. To avoid possible photo degradation and oxidation, all sample solutions were prepared within 24 hours before the experiment, avoiding the exposure to light as much as possible.Reference experiments with ice were performed at the In Situ Spectroscopy beamline (X07DB) at SLS using the setup and procedures described by Orlando et al.69 and as used for the experiments described by Yang et al.70
The experiments with the liquid RES and ORC solutions were carried out at the Surface/Interface Microscopy (SIM) beamline at the Swiss Light Source (SLS, Paul Scherrer Institut) using the liquid jet XPS endstation, which is coupled to a hemispheric electron analyzer (R4000, ScientaOmicron) with a high pressure pre-lens (HiPP-2, ScientaOmicron).45 The solution under investigation was admitted into the experimental chamber by a PEEK capillary, connected to a vertically mounted quartz nozzle with an aperture ranging from 20 to 25 μm, at a flow rate of 0.6 mL min−1. The experimental chamber was pumped to a background pressure of around 10−3 mbar. After injection, the solution travels with a laminar flow for a few hundred microseconds, corresponding to a few millimeters in length, before it is hit by the photon beam at 90° from the horizontal electron detection axis (see ESI, Fig. S1†). To avoid charging effects upon photoemission, the nozzle assembly is thoroughly grounded. Before entering the chamber, the capillary was surrounded by a cooling jacket to precool the liquid to 277 K to reduce the vapor pressure in the intermediate vicinity of the liquid filament and the load on the pumping system. During the time in vacuum, evaporation of the liquid lowers the temperature of the liquid by a further few K.71 Thus the liquid temperature at the measurement position was around 273 K.
The HB exchange dynamics of water molecules is much faster than desorption, and the time for solute diffusion to build up a monolayer on the surface is on the order of μs for the lowest concentration used in this work, 0.01 M.46,50 The liquid jet continuously delivers fresh sample so that beam-induced effects are negligible. During the experiment, we made use of linearly polarized light at 0°. Together with the geometric configuration of photon beam, liquid filament and electron detection axis (Fig. S1†), this was considered in the quantitative interpretation of the photoemission peak intensities (ESI, Section 3†), resulting from the excitation of the C 1s and O 1s core levels. For C 1s, we set the photon energy to 448, 560, 660, and 860 eV, while for O 1s, the photon energy was set to 695, 810, 910 and 1100 eV. Thus, the photoelectron kinetic energies, corresponding to the difference between the photon energy and the binding energy of the core level, which are about 290 eV for C 1s and 540 eV for O 1s, were ca. 155, 270, 370 and 570 eV, respectively. The kinetic energy of the photoelectron determines the mean escape depth (MED), which is expressed by means of the IMFP (λ) of electrons travelling through the liquid. We calculated λ by using the SESSA software and its corresponding database.72 With our experimental configuration, the cylindrical surface of the liquid jet beam leads to an effective mean escape depth, MED = 2λ/π.50 Thus, the four kinetic energies correspond to four different MED values of 4.8, 6.8, 8.4, 11.5 Å, respectively. All XPS peaks were fitted by Gaussians after subtraction of a Shirley background. The peak areas were then normalized with respect to the photon flux and the total photoionization cross section (see ESI, Section 3†).
Valence spectra of 2.0 M RES, 0.2 M ORC, liquid water and ice were measured by using 600 eV of photon energy. Such spectra mainly consist of the contributions of the 1b1, 3a1 and 1b2 MOs of water, with their binding energy lower than 20 eV, but also contain contributions by the MOs of RES or ORC. The limitation to the relatively high photon energy (and correspondingly high kinetic energy) was due to the lower photon flux at the ISS beamline used to obtain the spectrum for ice.
The O K-edge NEXAFS spectra of water and aqueous solutions were obtained by integrating the secondary electrons deriving from the oxygen Auger KLL peaks within the kinetic energy range of 412–437 eV at a pass energy of 50 eV, while scanning the excitation photon energy across the O K-edge from 527 to 560 eV. The chosen kinetic energy window remained free of contributions from photoemission peaks within this photon energy range. Acquisition of the electron yield in the kinetic energy range around the Auger peaks themselves would require a complex subtraction of valence level photoemission peaks.
2.2 MD simulation
Atomistic simulations based on classical and first-principle molecular dynamics (MD) were employed to clarify the solvation preference of ORC and RES, to quantify the tetrahedral ordering of interfacial liquid water molecules induced by the presence of the two adsorbates, and to determine the spectroscopic signature of the investigated solutions. All classical MD simulations were performed using the GROMACS 2018 Molecular Dynamics package.73 The CP2K molecular dynamics software74 was used to perform the first-principle DOS calculations. More details are provided in the ESI (Section 4.3†).A liquid water slab of ∼1.48 × 1.48 × 7.2 nm3 and 216 water molecules with two vapor/liquid water interfaces was equilibrated at 1 bar pressure and 300 K using classical MD. A liquid water slab of similar (or identical) size has been successfully used in the literature to study the interfacial and bulk solvation in slab systems.75 Starting from the equilibrated liquid water slab, three different aqueous solutions were prepared. In the first two, 4 ORC (or 4 RES) molecules were placed on each of the two liquid water interfaces, for a total of 8 ORC (or 8 RES) in the system and a 2 M concentration solution. In the third configuration (0.2 M), one ORC was placed on one interface. Note that upon equilibration, due to partitioning of ORC or RES to the interfaces, the local concentrations in the bulk were reduced. In contrast, in the experiments, the bulk concentration of the equilibrated system remained 2.0 M and 0.2 M for RES and ORC, respectively. Due to the lower solubility of ORC the 2.0 M ORC case could not be studied experimentally. Nevertheless, these three model systems reasonably reflect the experimental conditions and, at the same time, offer a molecular picture of the dynamics of the two compounds in a similar concentration range, which appear beneficial to highlight physicochemical details of the adsorption and interfacial water ordering for the aqueous solutions of interest here.
As described in more detail in the ESI (Section 4.3†), force field parameters for ORC and RES were created according to GAFF2 practice.76 Water molecules were described using two different water models: TIP3P,77 which is the reference model for the GAFF2 force field, and TIP4P/2005,78 which is one of the most commonly used water models for ice and supercooled liquid water.79 Since TIP3P is the reference model for GAFF2, simulations employing the GAFF2/TIP3P combination were adopted to describe the surface vs. bulk preference of RES and ORC. To the best of our knowledge, there are no force fields for small organics available in the literature to work with TIP4P/2005. However, TIP4P/2005 is superior in describing the water phase diagram and the HB network in the ice phase and in the supercooled region.79 A detailed analysis of TIP4P/2005 liquid water and ice structures is available in previous work.80 Therefore, simulations with TIP4P/2005 were only used to quantify the tetrahedral ordering of interfacial liquid water molecules and the spectroscopic signature of the system in the presence of the two adsorbates. We run a 400 ns constant volume and temperature (NVT) classical MD at 300 K for each of the three solutions (i.e., 0.2 M ORC, 2 M ORC, and 2 M RES) and for each of the two water models, for a total of six independent MD runs.
We performed additional 400 ns MD simulations of a hexagonal ice (i.e., Ih ice) slab. Ice Ih is the most stable crystalline form of ice in the atmosphere. The ice slab comprised of 320 TIP4P/2005 water molecules with two equilibrated basal ice interfaces exposed to the vapor phase (see ESI Fig. S5†). The Ih ice slab was equilibrated at T = 237 K, which corresponds to 14 K below the melting temperature (Tm = 251 K) of TIP4P/2005.81 An order parameter, qi, was adopted to quantify the tetrahedral arrangement of each water molecule with respect to its (four nearest) neighbors.80,82,83
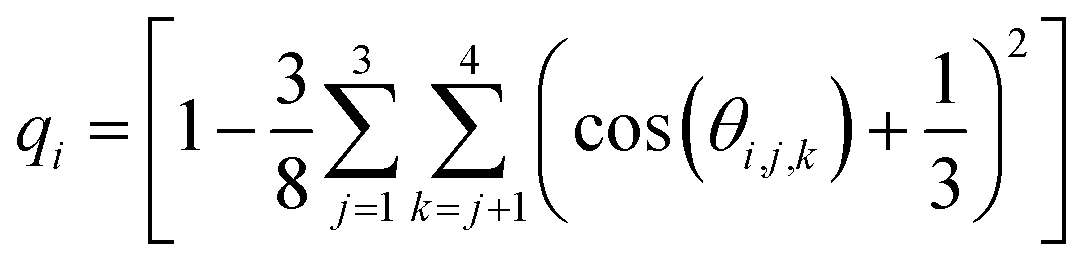 | (1) |
In eqn (1), the sums run over the four nearest oxygen atoms of the oxygen belonging to the water molecule i. The angle θ is the angle between oxygens i, j, and k, with the oxygen i as the angle vertex. In the interior of a perfect ice crystal, qi = 1 since the four nearest neighbors are tetrahedrally arranged around the ith oxygen. In real ice, deviations from the perfect tetrahedral order occur due to thermal motion and defects in crystal structure, giving rise to a relatively narrow distribution of values with a maximum close to qi = 1. In the liquid water phase, qi values significantly smaller than 1 are expected since the tetrahedral arrangement of water molecules is distorted in the liquid phase. Following the strategy of Conde et al.,84 Gladich and Roeselova80 identified a threshold value of qt = 0.9054 for TIP4P/2004 which discriminates between “ice-like” or “liquid-like” water molecules: for qi > qt the i-water molecule belongs to the ice phase, while for qi < qt it belongs to the liquid. Probability distributions for q were calculated for all the simulation systems described above, and also for one extra simulation box at ∼0.2 M ORC (i.e., 5400 TIP4P water and 24 ORC) to support our results with a larger simulation box case.
The electronic density of states (DOS) for the different aqueous solutions and ice systems were computed at first-principles level employing calculations with SCAN85 density functional theory (DFT). The TZV2P basis set with a cutoff of 600 Ry was employed for the valence electrons, while core electrons were modeled using pseudopotentials optimized for SCAN. SCAN is a recently introduced DFT method, designed especially for the electronic structure of water and dynamic simulations.85 DOSs were averaged over 160 snapshots extracted every 2 ns from the last part of the classical MD trajectories adopting the TIP4P/2005 water model. A Gaussian smearing of 0.5 eV was used to smooth the DOS. The averaged DOS was then compared with the experimental X-ray photoemission spectra of the valence levels: a similar strategy has already been successfully adopted in the literature for the comparison of the computational DOS with XPS data from liquid water or soft matter systems.86–90 DOSs for bulk ice (i.e., with no interfaces) and for an ice slab with two vapor/ice interfaces (Fig. S6†) were calculated at the same temperature of the ice slab MD (i.e., T = 237 K).
Further details about the preparation and equilibration of the liquid water and ice slab, the force field strategy, and other computational settings are reported in the ESI.†
3. Results and discussion
3.1 Surface orientation and surface propensity of RES and ORC in aqueous solutions
Fig. 1 shows the photoemission signal of C 1s of 2.0 M RES and 0.2 M ORC solutions, probed with an excitation photon energy of 448 eV, which corresponds to a photoelectron kinetic energy of 155 eV, thus the most surface sensitive mode. The spectra were fit with contributions related to hydroxy group (alcoholic) carbon (solid blue, 290.7 eV), aromatic carbon (solid red, 288.5 eV) and aliphatic carbon (solid yellow, 289.2 eV), all with equal full width at half maximum (FWHM). The O 1s spectra of these two samples at the same MED are reported in Fig. S2.† Apparently, the 0.2 M ORC solution leads to similar C 1s intensity as the 2.0 M RES solution, in spite of the lower bulk concentration (the y-axis scales in Fig. 1 are the same). Therefore, these spectra directly show that ORC is substantially more surface active than RES. The surface coverages will be quantified further below.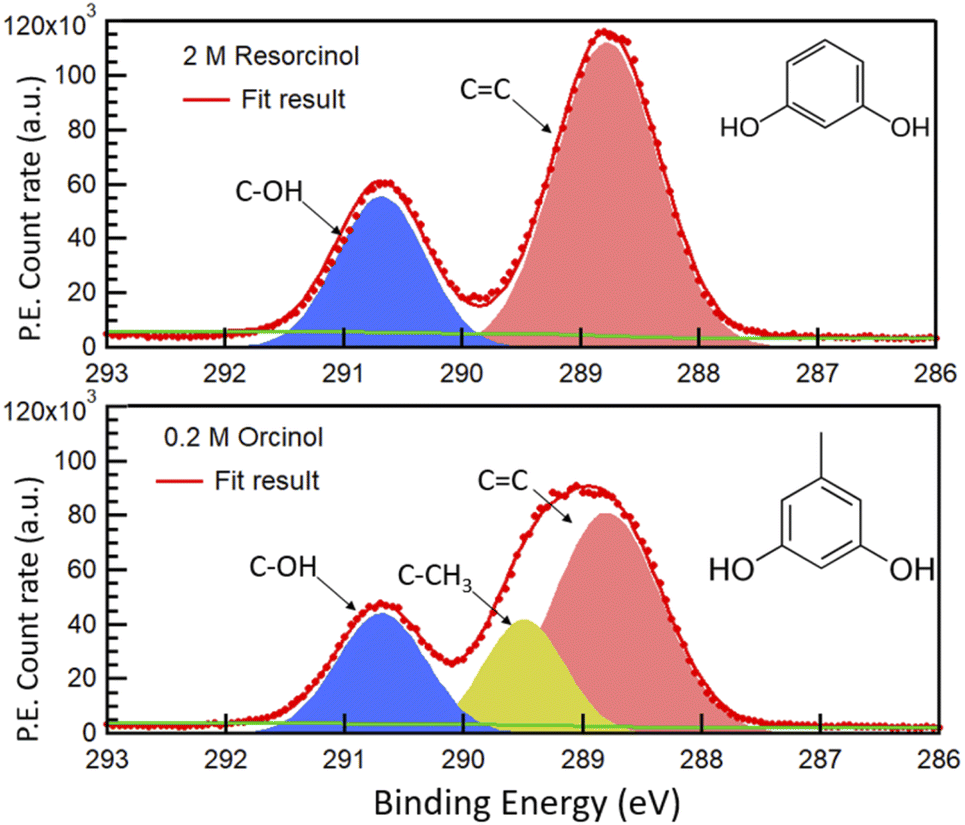 | ||
| Fig. 1 C 1s photoemission count rate of 2.0 M RES (top panel) and 0.2 M ORC (bottom panel) solution, probed with an excitation photon energy of 448 eV. The resulting photoelectrons have a kinetic energy of ca. 155 eV. The green line represents the Shirley background. Hydroxy group carbon, aromatic carbon and aliphatic carbon (only for orcinol) contributions are represented by blue, red and yellow shaded Gaussian peaks, respectively. | ||
The fractional contributions of each C 1s component, derived from the spectra at different kinetic energies, are shown in Fig. 2. Each kinetic energy corresponds to a specific MED, and the photoemission intensity represents the integral of exponentially decreasing contributions from atoms with depth, but with 80% of the signal originating from the topmost layer with thickness equal to the MED. Thus, for the most surface sensitive measurement with MED of 4.8 Å, Fig. 2 gives information about the integrated contributions of specific carbon atoms from the top down to 4.8 Å (80% of the signal). Correspondingly, for larger MED, the signals represent the integrated contributions from the top down to, e.g., 14.4 Å (most bulk sensitive measurement). In the case of 2.0 M RES (Fig. 2a), at low kinetic energy, the contribution of the C–OH carbons to the total C 1s intensity is lower than expected based on the molecular structure (1/3), while the C![[double bond, length as m-dash]](https://www.rsc.org/images/entities/char_e001.gif) C contribution is higher than expected (2/3). At higher kinetic energy, the contributions match the expected values. This implies a preferred orientation of resorcinol molecules residing at the surface: the aromatic rings have an upward orientation with respect to the solution–air interface (see schematic illustration in ESI Section 3, Fig. S3†), due to the preferential hydration of the OH groups and the hydrophobic interaction of the remainder of the molecule. The slightly enhanced photoemission signal intensity contribution comes from the fact that photoelectrons from the CC carbons, which are located on the vacuum side of the interface, are less attenuated than those from the C–OH carbons. The C 1s spectrum of the ORC solution contains three components (Fig. 1b): CC, C–OH and –CH3, with carbon number ratio 3
C contribution is higher than expected (2/3). At higher kinetic energy, the contributions match the expected values. This implies a preferred orientation of resorcinol molecules residing at the surface: the aromatic rings have an upward orientation with respect to the solution–air interface (see schematic illustration in ESI Section 3, Fig. S3†), due to the preferential hydration of the OH groups and the hydrophobic interaction of the remainder of the molecule. The slightly enhanced photoemission signal intensity contribution comes from the fact that photoelectrons from the CC carbons, which are located on the vacuum side of the interface, are less attenuated than those from the C–OH carbons. The C 1s spectrum of the ORC solution contains three components (Fig. 1b): CC, C–OH and –CH3, with carbon number ratio 3![[thin space (1/6-em)]](https://www.rsc.org/images/entities/char_2009.gif) :2:1, respectively. We observe an even stronger effect of surface orientation than in the case of RES, with quite significantly opposing behavior of –CH3 and C–OH carbons as a function of kinetic energy, consistent with the OH groups pointing towards the solution-side, and the methyl group towards the vacuum-side of the interface. The reason for the apparently less pronounced impact of orientation on the C 1s component fractions for RES than for ORC is that the bulk concentration of RES was much higher than that of ORC: thus, averaging over an already small probe volume was sufficient for the signal to be dominated by the bulk phase molecules.
:2:1, respectively. We observe an even stronger effect of surface orientation than in the case of RES, with quite significantly opposing behavior of –CH3 and C–OH carbons as a function of kinetic energy, consistent with the OH groups pointing towards the solution-side, and the methyl group towards the vacuum-side of the interface. The reason for the apparently less pronounced impact of orientation on the C 1s component fractions for RES than for ORC is that the bulk concentration of RES was much higher than that of ORC: thus, averaging over an already small probe volume was sufficient for the signal to be dominated by the bulk phase molecules.
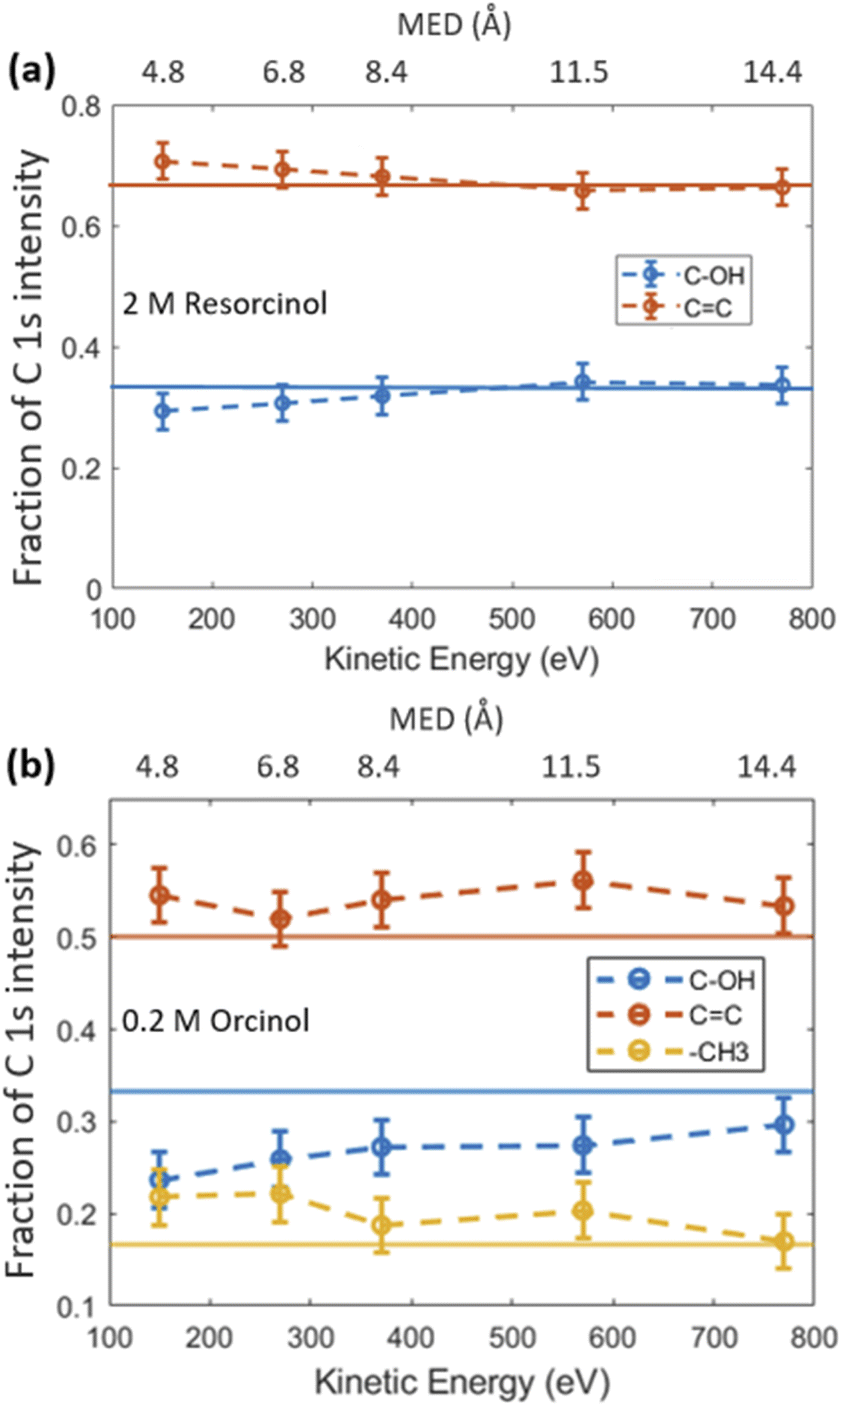 | ||
| Fig. 2 (a) The fractional contribution of aromatic carbon (–CC, red) and carboxylic carbon (C–OH, blue) components to the C 1s photoemission intensity in 2 M RES solution. The blue and red thin lines indicate the theoretical ratio of the carboxylic carbon (33.3%) and aromatic carbon (66.7%), respectively. (b) Fractional contributions of carbons for the 0.2 M ORC case, including the aliphatic carbon contribution (–CH3, yellow). | ||
In the following we investigated the surface excess and the effective thickness of the layer established by the RES and ORC molecules on the surface. We first determined the ratio of the C 1s and O 1s signal intensities, depicted in normalized form in Fig. 3. If an element is homogeneously distributed with depth, such as that of oxygen of liquid water, the signal intensity increases linearly with the MED (after normalization to take into account the cross section and photon flux). If an element just exists at the surface, the normalized signal intensity remains constant with increasing MED. Therefore, the ratio of the latter to the former shows a decreasing profile with increasing MED.91 Hence, the shapes of these ratios depicted in Fig. 3 indicate the surface activity of RES and ORC. We again note the cumulative character of the XPS signal, with the exponentially decaying contributions from atoms with depth, with the integration starting at the top of the surface for each kinetic energy. In addition, contributions of the solutes in the bulk contribute to the total C 1s intensity as well. We therefore used an attenuation model explained in the ESI and Fig. S3† for a quantitative analysis of these ratios. Briefly, we replace the complex arrangement of carbon atoms of the RES and ORC molecules on the surface by an equivalent thin and homogeneous layer of liquid RES and ORC, respectively, on top of the water. This enables a simple attenuation model to be applied. The density of the water is assumed to feature a rectangular profile below the organic layer. The detailed description of the model and derivation of equations is provided in the ESI (Section 3†).
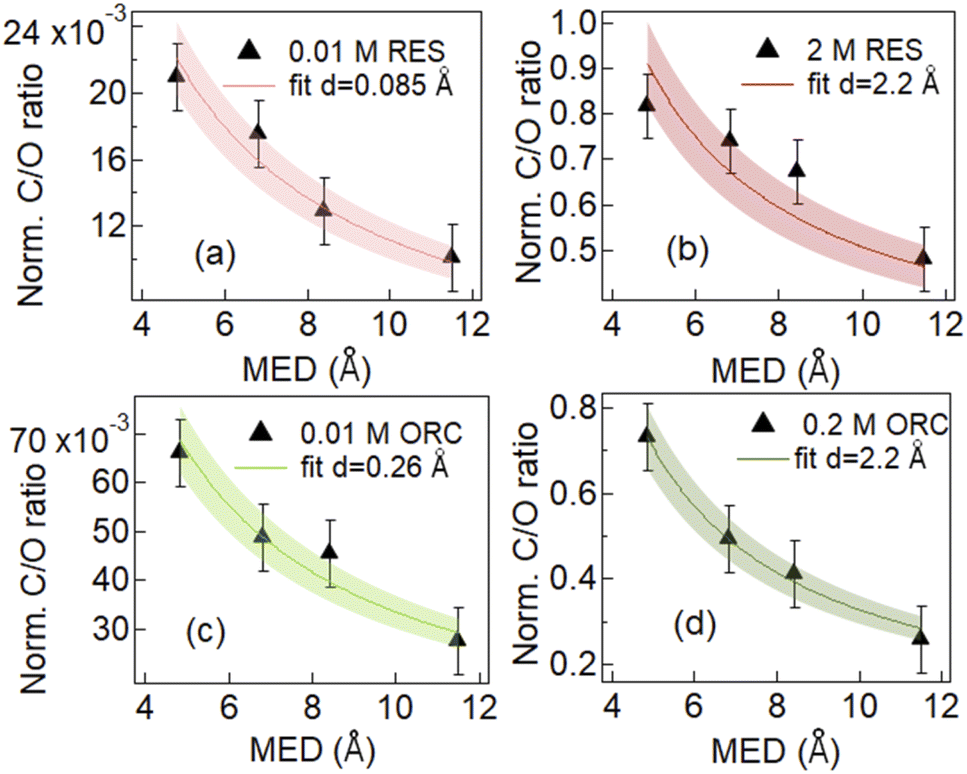 | ||
| Fig. 3 Evolution of normalized C/O photoemission intensity ratio as a function of mean escape depth (MED) for aqueous solutions of 0.01 M RES (a), 2 M RES (b), 0.01 M ORC (c) and 0.2 M ORC (d). Red and Green lines represent the fitting result for resorcinol and orcinol, with one standard deviation shown by the shaded area. The effective thickness d, which was the only fitting variable, obtained from the fit is attached in the image legend. | ||
Fig. 3 shows the results of fits to the measured intensity ratios normalized by photon flux and total differential ionization cross section (abbreviated as normalized C/O ratio), to determine the equivalent thickness of the organic layer (d) for 0.01 M and 2.0 M RES and 0.01 M and 0.2 M ORC solutions (see ESI, Section 3†). The results confirm that the investigated solutes clearly exhibit surface propensity. Traditionally, this can be expressed by their surface excess. The surface excess, Γ, can be estimated from the product of the surface layer thickness (d) and the molecule number density within this layer (ns: in molecules per cm3, reported in Table S1†):
| Γ = d × ns | (2) |
The geometric dimension of an aromatic ring is about 2.4 Å. In case of 0.01 M RES and ORC 0.01 M solutions, the obtained surface layer thickness, d, is 0.085 Å and 0.26 Å respectively. This implies that the surface concentrations were much below a monolayer coverage. Our analysis does not consider whether they randomly float on the surface or aggregate into islands. The effective thickness only reflects the amount of carbon thought to be evenly distributed over the surface and that leads to the average attenuation of the signals observed by XPS. The Γ values derived for the dilute solutions are 5.8 × 10¹² (±8.7 × 10¹¹) molecules per cm2 and 1.6 × 10¹³ (±2.4 × 10¹²) molecules per cm2 for 0.01 M RES and 0.01 M ORC, respectively. As the concentration of the solutions increases to 2.0 M and 0.2 M for RES and ORC, respectively, the surface layer thickness d increases to 2.2 Å, which matches almost perfectly the geometric dimension of these organic molecules, suggesting the accumulation of one monolayer at the surface. The corresponding Γ values are 1.5 × 10¹⁴ (±2.3 × 10¹³) molecules per cm2 and 1.4 × 10¹⁴ (±2.1 × 10¹³) molecules per cm2 respectively. We note that the model assumes that the RES and ORC concentrations remain constant in the bulk liquid, as accumulation on the surface does not lead to significant depletion in the near surface bulk due to fast enough diffusion from the reservoir of the deeper lying layers. The reported surface excess values are similar to those for phenol and cresol.92
The experimental picture for the surface orientation and bulk vs. surface solvation preference can be rationalized by looking at the density profile of ORC and RES from the classical MD simulations in Fig. 4. In addition, Fig. S4 in the ESI† shows a snapshot from the 2 M ORC MD simulation and Fig. S5† the solvation preference of ORC and RES in both water models. As mentioned in the methods section, the solvation preference of ORC and RES is better described by the simulations in TIP3P water. Nevertheless, in Table S2 and Fig. S5† we compared the predictions for the solvation preference of ORC and RES using TIP3P and TIP4P/2005: simulations with TIP4P/2005 reported a more marked hydrophobicity for ORC and RES than simulations with TIP3P. While quantitative differences are present, the conclusions drawn about the surface and bulk propensity of ORC and RES are identical between the two water models, showing ORC more surface enhanced than RES.
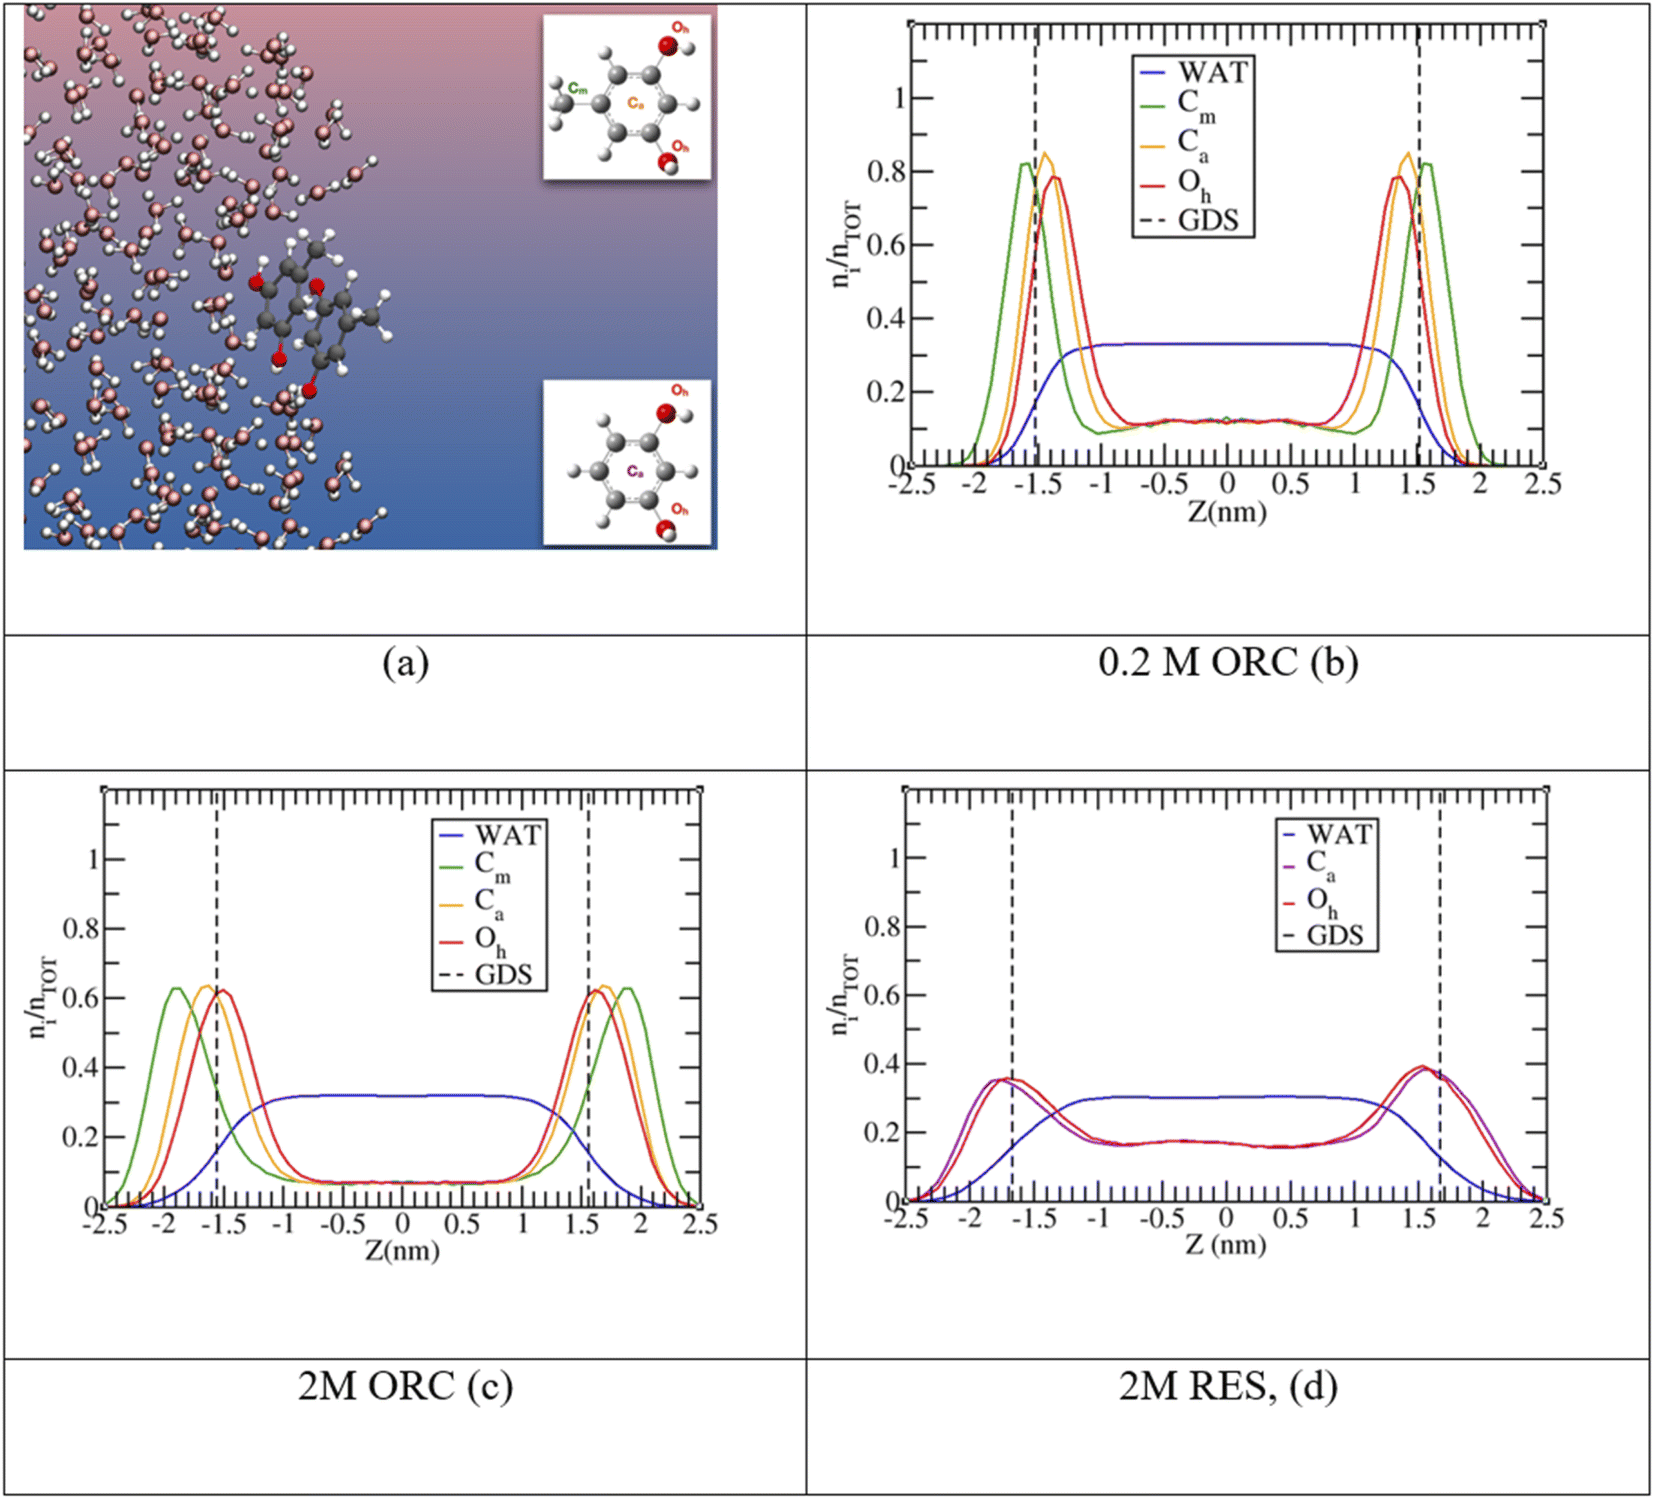 | ||
| Fig. 4 Panel (a): snapshot from a 2 M ORC molecular dynamics trajectory. In the insets resorcinol and orcinol molecules with atom nomenclature: Cm (green) is the carbon of the methyl group, Ca (orange and violet for ORC and RES, respectively) the center of the aromatic rings, and Oh (red) the oxygen of the hydroxyl groups. Panels (b), (c) and (d) show the probability distribution profile, ni/nTOT, normalized to unity as a function of the z-coordinate perpendicular to the vapor/liquid water interface, obtained collecting the z-position of each species over the MD trajectory in TIP3P water. Vertical dashed lines report the Gibbs Dividing Surface (GDS) for the aqueous slab. | ||
In agreement with the experimental picture, the computed density profile for ORC (orange) and RES (violet) states that the two molecules have different bulk and surface propensity: in Fig. 4d the RES profile samples more the bulk region than 0.2 M or 2.0 M ORC in Fig. 4b and c, respectively. From the density profiles in Fig. 4, it is possible to calculate the solute surface excess at the Gibbs Dividing Surface, Γ, and the bulk concentrations nb,93–95 as detailed in the ESI.† As reported in Table S3,† the calculated Γ is 1.2, 1.4 and 0.8 ×10¹⁴ molecules per cm2 for 0.2 M ORC, 2 M ORC, and 2 M RES aqueous solution, respectively. nb is 1.8, 1.2 and 2.8 × 10²⁰ molecules per cm3 for 0.2 M ORC, 2 M ORC, and 2 M RES aqueous solution, respectively. As mentioned in the methods section, equilibration leads to depletion of the bulk density, in contrast to the experimental case, where the bulk concentration remains essentially unaffected. Thus, the values for Γ from the simulation should not be quantitatively compared to those from XPS, even though they match to within 30%.
MD simulations also show (Fig. 4) that RES is more present in the bulk of the solution than ORC, even though it still displays a marked hydrophobic character. The difference between the surface propensity of ORC and RES can be rationalized by the presence of the methyl group in ORC, which further pushes the molecule toward the vapor side of the interface: a similar behavior has been observed also for methylamine at the liquid water surface, with the methyl group sticking out from the interface.96 The hydrophobicity of the aromatic groups forces ORC and RES to be preferentially solvated at the interface, while the hydroxyl –OH groups are pointing toward the condensed water phase, in agreement with the conclusions from the experiments (Fig. 2). Fig. 4 shows the density profiles for the hydroxyl oxygens (in red) closer to the water interface than the aromatic ring, while the methyl group ones are oriented toward the vapor phase. Similar features have been reported by MD for the phenol (2.5 M) aqueous solution density profile.20 Finally, it is interesting to note the formation of π-stacking among the aromatic rings, as shown in a representative snapshot in Fig. 5: similar behavior with π- or slightly parallel displaced stacking has been reported in combined experimental and simulation works in the literature for benzene, naphthalene and methylnaphthalene on the surface of ice and liquid water.20,97–99 As mentioned above, the self-aggregation of RES or ORC into islands via such π-stacking cannot be assessed by the XPS signals.
 | ||
| Fig. 5 Probability distribution for the minimal intermolecular distances among the hydroxyl oxygens of RES (or ORC) in solution. In the insets, two representative snapshots corresponding to the peaks of the 2 M ORC solution. The carbon atoms of the methyl groups are highlighted in green. For visualization purposes, the distributions were normalized to have the intensity of the peak at ∼0.4 nm equal to unity. The 0.2 M ORC (green and dotted) curve was calculated over a 400 ns MD using a larger water box (5400 TIP4P/2005 water and 24 ORC). | ||
Fig. 5 provides further details on the ORC and RES interfacial self-stacking, reporting the probability distribution for the minimal intermolecular distances among the hydroxyl oxygens of RES (or ORC). Fig. 5 shows a bimodal distribution with two peaks, one at ∼0.3 nm and a second one at ∼0.4–0.5 nm. These two peaks are associated to π- or slightly parallel displaced stacking, as shown in representative snapshots for the distribution peaks reported in the insets of Fig. 5. Interestingly, by increasing the solution concentration, the peaks become sharper and the 0.3 nm one also more intense, as shown by comparing the 0.2 M and 2.0 M ORC curves. Note that the distance between the OH groups on the basal plane of ice is also ∼0.3 nm, which is also similar to the hydroxyl group distance in the phloroglucinol dihydrate crystal (0.34 nm),100 one of the most IN active material.9 Moreover, at the same 2 M concentration, the peaks for the RES solution are much broader than those of ORC (red and green straight lines, respectively): RES samples more the subsurface and bulk region of the solution than ORC, avoiding the interfacial self-stacking. Finally, it is worth mentioning that our classical MD reports a preference for slightly parallel displaced stacking rather than perfect π-stacking of the benzene rings: the difficulty to perfectly model π–π interactions among aromatic rings is well-known in classical MD simulation based on point charges.99,101
3.2 Hydrogen bonding structure from O K-edge NEXAFS
Fig. 6a shows the O K-edge NEXAFS spectra of liquid water (blue) and ice (black), compared with those of 2.0 M RES (red) and 0.2 M ORC (green). We distinguish two main absorption regions, marked by the shaded areas A and B: in liquid water, the strong intramolecular covalent O–H bonds in asymmetric weak HB configuration prevail, leading to an enhanced absorption at 537 eV (shaded region A). In contrast, in ice, the predominant strong and highly symmetric tetrahedral HB configuration leads to a prominent absorption at around 541–542 eV (shaded region B), whereas the absorption in region A is quenched due to the shortage of asymmetric HB. The difference spectrum between ice and water NEXAFS shows a negative value in region A and positive in region B (Fig. 6b, pink), consistent with the formation of a more ordered HB structure. The absorption feature at 535 eV can be assigned to free OH groups, which is more prevalent in aqueous solutions (especially also at the solution–vapor interface) than in ice.102,103 The contrasting HB configuration embodied by NEXAFS spectra of liquid water and ice serves as a reference to qualitatively interpret the local HB structure of water on the surface of 2.0 M RES (red, Fig. 6a) and 0.2 M ORC (green, Fig. 6a) solutions. Compared to liquid water, the O K-edge NEXAFS spectra indicate a trend towards lower intensity in region A and higher intensity in region B (Fig. 6a) for both RES and ORC solutions. We note that the mean escape depth of the electron yield NEXAFS spectra is not as well defined as with XPS. The kinetic energy window used for the NEXAFS spectra of 412–437 eV is quite far away from the primary Auger peaks, so that electrons contributing to the electron yield may have undergone several scattering events and thus originate from deeper in the bulk than the MED corresponding to this kinetic energy. This leads to a lowering of the influence of the surface region to the NEXAFS spectra. We may also assess the contribution from oxygen atoms of the OH groups of ORC and RES. For the higher coverages obtained from the XPS data, the number density of these oxygen atoms is about one order of magnitude smaller than that of oxygen atoms within the first bilayer of water molecules. Taking the actual probe depth, the contribution of the OH groups themselves to the NEXAFS spectrum and specifically to the ratio in regions A and B is likely negligible. In summary, the observed trends suggest that HB of water molecules near the surface of these organic solutions is slightly more ordered than that in liquid water. We note that in general, solutes in the bulk aqueous phase tend to increase the presence of weak HB configurations due to the effect of hydration, e.g., for salt solutions.104 Thus, for that effect we would rather expect an increase in region (A).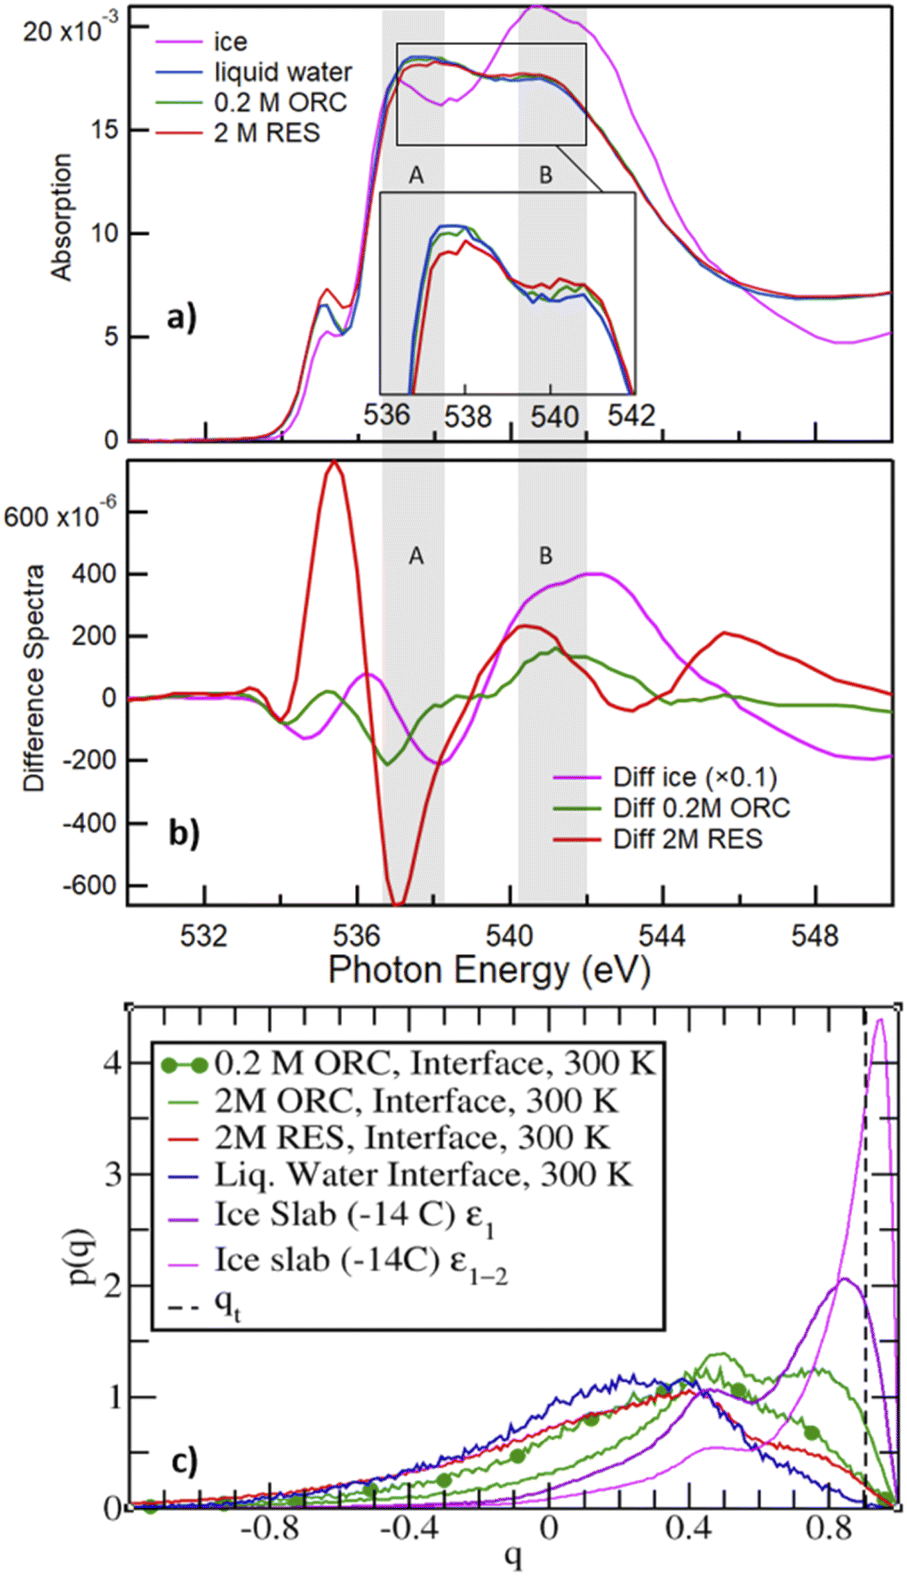 | ||
| Fig. 6 Panel (a) shows the O K-edge NEXAFS of liquid water (blue), ice (magenta), RES 2 M (red), and ORC 0.2 M (green) solution. The inset shows the spectra for water, ORC and RES at an expanded y-scale for comparison. Panel (b) shows the difference spectra, obtained by subtracting the liquid water spectrum from the spectrum of ice (black), RES 2 M (red), and ORC 0.2 M (green). The grey shaded regions A and B denote absorption due to weak asymmetric and symmetric tetrahedral HB configurations, respectively. Panel (c) probability density distribution of the tetrahedral order parameter q (eqn (1)), for different aqueous solution from MD. qt = 0.9054 (vertical dashed line) discriminates between “ice-like” (q > qt) and “liquid-like” water molecules (q < qt), see ref. 51. The interfacial region for the liquid water slab at 300 K was defined in the density profile of Fig. S5.† The ε1 or ε1 + ε2 (i.e., ε1–2) bilayers defined the interfacial ice region (Fig. S5† and ref. 74). The 0.2 M ORC (green and dotted) curve was calculated over 400 ns MD using a larger water box (∼5400 TIP4P/2005 water and 24 ORC). | ||
The molecular picture for the local arrangement of interfacial water molecules in contact with ORC and RES can be obtained from the classical MD simulations using the tetrahedral order parameter defined in eqn (1). Fig. 6c reports the order parameter probability distributions for interfacial water molecules, p(q), where the interfacial region is defined for z larger (i.e., toward the gas phase) than the Gibbs Dividing Surface. Following Gladich et al.,105 the interfacial region of the ice slab was determined by the interfacial ε1 or ε1 + ε2 bilayers, outlined in Fig. S6.† As already noted in the literature,105,106 at the vapor/pure liquid water interface the tetrahedral arrangement of water molecules is disrupt. This feature is also apparent from Fig. 6c, where the p(q) of interfacial liquid water (blue curve) peaks at smaller q-values than that of the interfacial ice (violet and magenta), because on ice the tetrahedral ordering is stronger and, thus, q-values are closer to unity. Interestingly, consistent with the trends observed in the NEXAFS spectra, RES and ORC induce a local ordering of water in the interfacial region (red and green line, respectively), as shown by the shoulders of p(q) at values closer to qt, which is the threshold discriminating between liquid-like and ice-like water molecules. Moreover, interfacial water molecules are more ordered in the ORC solution than in the RES one, even at low concentration (0.2 M): this is ascribed to the fact that RES shows higher preference for the bulk and subsurface region than ORC (see Fig. 4), thus perturbing the ordering of water molecules at the interface. In addition, ORC tends to self-stack at the interface, likely forcing liquid water ordering by interaction among the ORC hydroxyl groups and water, as shown in Fig. 5.
The formation of a more ordered interfacial water layer at the RES and ORC aqueous solutions, somehow resemble those observed at the organic crystal/water interface,9,107 especially at phloroglucinol dihydrate crystals.9 At the water organic/crystal interface the 2D ordered distribution of hydrophilic (i.e., –OH) and hydrophobic groups promotes water ordering.9 Here, due to the lower interfacial concentration of organics compared to that at crystal substrates, we do not observe a stable 2D pattern of adsorbates, but formation of islands with a self-assembled array of ORC (or RES) that dynamically form, disassemble and reform during the simulations. The hydrophobic (π–π) interaction among solutes orders the adsorbates at the interface, and this self-aggregation increases the local interfacial concentration, as shown in Fig. 5. This drives the interaction between the hydroxyl groups of the solutes and water to the formation of a more ordered interfacial water layer: this is evident in Fig. 6c where the tetrahedral order distribution is more shifted to higher q-values with RES and ORC in solution (green and red line), than on pure liquid water (blue line). Fig. S7,† which reports the distribution of the q order parameter as a function of the coordinate perpendicular to the interface, also supports the formation of a more ordered interfacial water layer in presence of ORC and RES. Our classical MD simulations report clear evidence of RES and ORC stacking at the interfaces, and similar features were also observed for other aromatic compounds in our previous works on the ice pre-melted liquid water surfaces.97,98 However, as we also remarked above, a more quantitative analysis of the adsorbate self-assembly, which drives the interfacial water ordering in ORC and RES aqueous solutions, calls for a better description of the π–π interaction, which is beyond the capability of the classical MD employed here and more suited for some first-principle MD approach.
3.3 Hydrogen bonding structure from valence spectra
Inspired by the work of Winter et al.,49 we measured valence photoemission spectra of the solutions investigated in this work with the aim of finding a correlation between the occupied water molecular orbitals and the local hydrogen bond order. Fig. 7 shows valence level spectra in the region of the 1b1, 3a1 and 1b2 molecular orbitals of H2O for 2.0 M RES and 0.2 M ORC, together with those for liquid water (blue) and solid ice (black), normalized by the maximum intensity of the 1b1 peak. The gas phase contribution to the photoemission signal from the liquid–vapor interface has been subtracted from these spectra. Raw spectra are shown in the ESI (Section 5, Fig. S9†). Comparing the reference spectra of liquid water and ice, we observe that the 3a1 peak in ice (black) is lower than that of liquid water (blue), consistent with other literature reports.55–57 The 1b2 peak, which is also sensitive to the HB environment and orientation, also follows this trend.50 In presence of 2.0 M RES and 0.2 M ORC, both 3a1 and 1b2 tend to remain below those of liquid water, consistent with the presence of more ordered water, but still far away from that of ice. The noise level of the spectra does not allow making a statistically significant statement. While longer acquisition times would increase the signal-to-noise-ratio, spatial fluctuations of the liquid filament lead to increasing variability, also in terms of the fraction of gas phase contribution to the signal. The photoelectron kinetic energy range of the spectra in Fig. 7 corresponds to a mean escape depth of ca. 1.3 nm, or 4 monolayer-equivalents of water. From the depth profile characterization in Section 3.1, we note that organic molecules form a monolayer that accumulates at the interface of the RES and ORC solutions, with a thickness of about 2.2 Å (Fig. 3). Therefore, valence level spectra reported in Fig. 7a are contributed by both water molecules in close contact with organic molecules and water molecules further away in the bulk. The latter are less influenced by the presence of organic molecules, leading to a weakening of the signal, similar to the case of the NEXAFS spectra.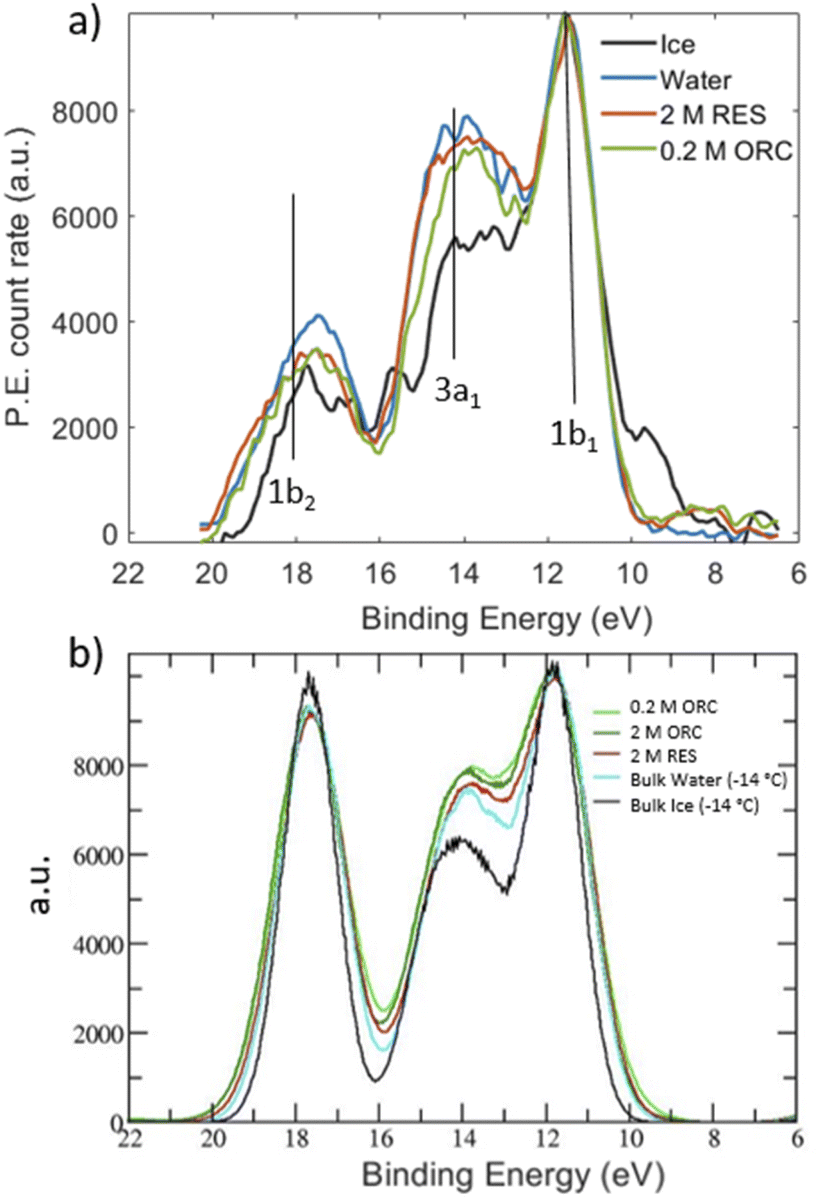 | ||
| Fig. 7 (a) Valence X-ray photoemission spectra for water (blue), ice (black), 2.0 M RES (red) and 0.2 M ORC, excited with a photon energy of 600 eV. The peaks labeled by 1b1, 3a1 and 1b2 correspond to the valence orbitals of the water molecules. All spectra are Shirley background removed and normalized with respect to their 1b1 peak height. The binding energy was fixed with respect to the 1b1 binding energy of liquid water. (b) DOS of liquid water molecules present in ORC, RES, bulk ice and bulk water. Data are aligned and normalized consistently with the experimental spectra. The DOS for the ORC and RES solutions show only the water contribution, i.e., the solute DOSs were removed from the DOS of the entire system. | ||
The theoretical DOS (Fig. 7b) reproduces the decrease of the 3a1 orbital in ice compared to that in liquid water, but basically no difference for the 1b2 peaks in comparison to liquid water. As benchmark test, Fig. S8† shows the DOS for a pure (i.e., with no solutes) TIP4P/2005 bulk water and liquid water slab at 300 K, calculated by averaging the snapshots from the classical MD trajectories: the agreement with the bulk water DOS calculated over frames from a SCAN first-principles MD and reported in the original SCAN ref. 85 is quite remarkable, with the only slight overestimation of the 1b2 peak for the DOS from classical MD frames compared to that from the SCAN MD simulation. This further states the ability of TIP4P/2005 in describing the HB network in water and the possibility to have reliable configurations for DOS calculations at the convenient computational price of classical MD. We note that the calculated DOS in Fig. 7b displays the contributions from the water molecules only, after the removal of the RES or ORC DOS. Such a subtraction was not possible for the experimental spectra. Moreover, Fig. 7b shows a negligible impact of RES and ORC in the theoretical DOS, compared to the pure water case (cyan line). In view of the uncertainties in both experimental and theoretical spectra we refrain from making firmer conclusions about water ordering from the valence spectra. Further developments should include depth resolved measurements (with varying kinetic energy) and depth resolved calculations.
4. Conclusions
By using in situ XPS, we have experimentally investigated the surface excess and preferential orientation of RES and ORC molecules at the liquid–vapor interface. The surface excess was obtained by applying an attenuation model to kinetic energy dependent photoemission intensity measurements. The experimental results are in line with our classical MD simulations of RES and ORC at the aqueous interface, which further suggest self-aggregation via π-stacking. In addition, the O K-edge NEXAFS spectra of these organic aqueous solutions reveal a trend towards stronger ordering of water molecules at the liquid–vapor interface. This agrees with our calculation of the tetrahedral order parameter q, delivered by the MD simulations and suggests that the presence of resorcinol and orcinol molecules locally induce a more tetrahedral coordination among water molecules. Finally, measured valence level spectra also show a trend pointing towards more water ordering, though not at a statistically significant level. Similarly, the calculated DOS show only very small differences between liquid water and the solutions containing orcinol or resorcinol.While our results do not directly provide parameters to be used in models treating ice nucleation in the atmosphere, our findings further our understanding of the basis of heterogeneous ice nucleation by organic compounds, specifically by aromatic compounds with OH substitution. Considering the ubiquitous presence of a broad range of OH substituted aromatic compounds in the atmosphere, their role in ice nucleation should be explored further in experiment and theory.
Author contributions
H. Y., L. A. and M. A. designed the work and conceived the laboratory experiment; H. Y., A. B. and L. A. performed the XPS and NEXAFS spectroscopy measurements; H. Y. analysed and interpreted the XPS and NEXAFS data; I. G. contributed the computational part of the paper; H. Y., I. G., L. A. and M. A. worked on the manuscript together. All authors contributed to the discussion and approved the final version of the manuscript.Conflicts of interest
There are no conflicts to declare.Acknowledgements
The experimental work in this publication was performed at the SIM and the ISS (for ice) beamlines of the Swiss Light Source, Paul Scherrer Institute. H. Y. and M. A. appreciate funding by the Swiss National Science Foundation (grant no. 169176) during the initial phase of this work. For High Performance Computational resources and services, we acknowledge the Research Computing group in Texas A&M University at Qatar, founded by the Qatar Foundation for Education, Science and Community Development, and the use of Qatar Environment and Energy Research Institute (QEERI) HPC under Project ID HPC-P21002.Notes and references
- W. Cantrell and A. Heymsfield, Production of Ice in Tropospheric Clouds: A Review, Bull. Am. Meteor. Soc., 2005, 86, 795–808 CrossRef.
- J. I. Steinfeld, Atmospheric chemistry and physics: from air pollution to climate change, Environ. Sci. Pol., 1998, 40, 26 Search PubMed.
- M. Fitzner, P. Pedevilla and A. Michaelides, Predicting heterogeneous ice nucleation with a data-driven approach, Nat. Commun., 2020, 11, 4777 CrossRef CAS PubMed.
- R. Pandey, K. Usui, R. A. Livingstone, S. A. Fischer, J. Pfaendtner, E. H. G. Backus, Y. Nagata, J. Fröhlich-Nowoisky, L. Schmüser, S. Mauri, J. F. Scheel, D. A. Knopf, U. Pöschl, M. Bonn and T. Weidner, Ice-nucleating bacteria control the order and dynamics of interfacial water, Sci. Adv., 2016, 2, e150163 CrossRef PubMed.
- B. G. Pummer, C. Budke, S. Augustin-Bauditz, D. Niedermeier, L. Felgitsch, C. J. Kampf, R. G. Huber, K. R. Liedl, T. Loerting, T. Moschen, M. Schauperl, M. Tollinger, C. E. Morris, H. Wex, H. Grothe, U. Pöschl, T. Koop and J. Fröhlich-Nowoisky, Ice nucleation by water-soluble macromolecules, Atmos. Chem. Phys., 2015, 15, 4077–4091 CrossRef CAS.
- N. Fukuta, Experimental Studies of Organic Ice Nuclei, J. Atmos. Sci., 1966, 23, 191–196 CrossRef.
- L. Evans, Two-dimensional nucleation of ice, Nature, 1967, 213, 384–385 CrossRef CAS.
- A. Baklanov, B. Gorbunov, Z. Zakharova, K. Koutzenogii, V. Makarov, A. Safatov, A. Sidorov and G. Sibavin, The influence of phloroglucinol aerosol dispersity on its ice-forming activity, J. Aerosol Sci., 1981, 12, 391–398 CrossRef CAS.
- A. K. Metya and V. Molinero, Is Ice Nucleation by Organic Crystals Nonclassical? An Assessment of the Monolayer Hypothesis of Ice Nucleation, J. Am. Chem. Soc., 2021, 143, 4607–4624 CrossRef CAS.
- Q. Du, R. Superfine, E. Freysz and Y. R. Shen, Vibrational spectroscopy of water at the vapor/water interface, Phys. Rev. Lett., 1993, 70, 2313–2316 CrossRef CAS PubMed.
- M. Gavish, R. Popovitz-Biro, M. Lahav and L. Leiserowitz, Ice nucleation by alcohols arranged in monolayers at the surface of water drops, Science, 1990, 250, 973–975 CrossRef CAS.
- D. Jacquemain, F. Leveiller, S. Weinbach, M. Lahav, L. Leiserowitz, K. Kjaer and J. Als-Nielsen, Crystal structure of self-aggregates of insoluble aliphatic amphiphilic molecules at the air-water interface. An x-ray synchrotron study, J. Am. Chem. Soc., 1991, 113, 7684–7691 CrossRef CAS.
- D. A. Knopf and S. M. Forrester, Freezing of Water and Aqueous NaCl Droplets Coated by Organic Monolayers as a Function of Surfactant Properties and Water Activity, J. Phys. Chem. A, 2011, 115, 5579–5591 CrossRef CAS.
- D. R. Moberg, Q. Li, S. K. Reddy and F. Paesani, Water structure at the interface of alcohol monolayers as determined by molecular dynamics simulations and computational vibrational sum-frequency generation spectroscopy, J. Chem. Phys., 2019, 150, 034701 CrossRef.
- E. Ochshorn and W. Cantrell, Towards understanding ice nucleation by long chain alcohols, J. Chem. Phys., 2006, 124, 054714 CrossRef PubMed.
- R. Popovitz-Biro, J. Wang, J. Majewski, E. Shavit, L. Leiserowitz and M. Lahav, Induced freezing of supercooled water into ice by self-assembled crystalline monolayers of amphiphilic alcohols at the air-water interface, J. Am. Chem. Soc., 1994, 116, 1179–1191 CrossRef CAS.
- R. Schwidetzky, M. Lukas, A. Yazdan Yar, A. T. Kunert, U. Pöschl, K. F. Domke, J. Fröhlich-Nowoisky, M. Bonn, T. Koop and Y. Nagata, Specific Ion-Protein Interactions Influence Bacterial Ice Nucleation, Eur. J. Chem., 2021, 7402–7407 CrossRef CAS PubMed.
- B. Zobrist, T. Koop, B. P. Luo, C. Marcolli and T. Peter, Heterogeneous Ice Nucleation Rate Coefficient of Water Droplets Coated by a Nonadecanol Monolayer, J. Phys. Chem. C, 2007, 111, 2149–2155 CrossRef CAS.
- R. J. Perkins, M. G. Vazquez de Vasquez, E. E. Beasley, T. C. J. Hill, E. A. Stone, H. C. Allen and P. J. DeMott, Relating Structure and Ice Nucleation of Mixed Surfactant Systems Relevant to Sea Spray Aerosol, J. Phys. Chem. A, 2020, 124, 8806–8821 CrossRef CAS PubMed.
- R. Kusaka, T. Ishiyama, S. Nihonyanagi, A. Morita and T. Tahara, Structure at the air/water interface in the presence of phenol: a study using heterodyne-detected vibrational sum frequency generation and molecular dynamics simulation, Phys. Chem. Chem. Phys., 2018, 20, 3002–3009 RSC.
- T. Koop, B. Luo, A. Tsias and T. Peter, Water activity as the determinant for homogeneous ice nucleation in aqueous solutions, Nature, 2000, 406, 611–614 CrossRef CAS PubMed.
- C. Liu, D. Chen and X. e. Chen, Atmospheric Reactivity of Methoxyphenols: A Review, Environ. Sci. Technol., 2022, 56, 2897–2916 CrossRef CAS PubMed.
- J. J. Schauer and G. R. Cass, Source Apportionment of Wintertime Gas-Phase and Particle-Phase Air Pollutants Using Organic Compounds as, Tracers, Environ. Sci. Technol., 2000, 34, 1821–1832 CrossRef CAS.
- R. Volkamer, B. Klotz, I. Barnes, T. Imamura, K. Wirtz, N. Washida, K. H. Becker and U. Platt, OH-initiated oxidation of benzene Part I. Phenol formation under atmospheric conditions, Phys. Chem. Chem. Phys., 2002, 4, 1598–1610 RSC.
- R. I. Olariu, B. Klotz, I. Barnes, K. H. Becker and R. Mocanu, FT–IR study of the ring-retaining products from the reaction of OH radicals with phenol, o-, m-, and p-cresol, Atmos. Environ., 2002, 36, 3685–3697 CrossRef CAS.
- S. B. Hawthorne, D. J. Miller, R. M. Barkley and M. S. Krieger, Identification of methoxylated phenols as candidate tracers for atmospheric wood smoke pollution, Environ. Sci. Technol., 1988, 22, 1191–1196 CrossRef CAS PubMed.
- L. D. Yee, K. E. Kautzman, C. L. Loza, K. A. Schilling, M. M. Coggon, P. S. Chhabra, M. N. Chan, A. W. H. Chan, S. P. Hersey, J. D. Crounse, P. O. Wennberg, R. C. Flagan and J. H. Seinfeld, Secondary organic aerosol formation from biomass burning intermediates: phenol and methoxyphenols, Atmos. Chem. Phys., 2013, 13, 8019–8043 CrossRef.
- B. B. Palm, Q. Peng, C. D. Fredrickson, B. H. Lee, L. A. Garofalo, M. A. Pothier, S. M. Kreidenweis, D. K. Farmer, R. P. Pokhrel, Y. Shen, S. M. Murphy, W. Permar, L. Hu, T. L. Campos, S. R. Hall, K. Ullmann, X. Zhang, F. Flocke, E. V. Fischer and J. A. Thornton, Quantification of organic aerosol and brown carbon evolution in fresh wildfire plumes, Proc. Natl. Acad. Sci. U.S.A., 2020, 117, 29469–29477 CrossRef CAS PubMed.
- E. Hirsch and I. Koren, Record-breaking aerosol levels explained by smoke injection into the stratosphere, Science, 2021, 371, 1269–1274 CrossRef CAS PubMed.
- L. Ma, C. Guzman, C. Niedek, T. Tran, Q. Zhang and C. Anastasio, Kinetics and Mass Yields of Aqueous Secondary Organic Aerosol from Highly Substituted Phenols Reacting with a Triplet Excited State, Environ. Sci. Technol., 2021, 55, 5772–5781 CrossRef CAS PubMed.
- Z. Finewax, J. A. de Gouw and P. J. Ziemann, Products and Secondary Organic Aerosol Yields from the OH and NO3 Radical-Initiated Oxidation of Resorcinol, ACS Earth Space Chem., 2019, 3, 1248–1259 CrossRef CAS.
- J. J. Schauer, M. J. Kleeman, G. R. Cass and B. R. T. Simoneit, Measurement of Emissions from Air Pollution Sources. 3. C1−C29 Organic Compounds from Fireplace Combustion of Wood, Environ. Sci. Technol., 2001, 35, 1716–1728 CrossRef CAS PubMed.
- Z. Wang, X. Bi, G. Sheng and J. Fu, Characterization of organic compounds and molecular tracers from biomass burning smoke in South China I: Broad-leaf trees and shrubs, Atmos. Environ., 2009, 43, 3096–3102 CrossRef CAS.
- L. E. Hatch, A. Rivas-Ubach, C. N. Jen, M. Lipton, A. H. Goldstein and K. C. Barsanti, Measurements of I/SVOCs in biomass-burning smoke using solid-phase extraction disks and two-dimensional gas chromatography, Atmos. Chem. Phys., 2018, 18, 17801–17817 CrossRef CAS.
- C. A. Alves, A. Vicente, C. Monteiro, C. Gonçalves, M. Evtyugina and C. Pio, Emission of trace gases and organic components in smoke particles from a wildfire in a mixed-evergreen forest in Portugal, Sci. Total Environ., 2011, 409, 1466–1475 CrossRef CAS PubMed.
- E. D. Vicente, A. M. Vicente, M. Evtyugina, R. Carvalho, L. A. C. Tarelho, S. Paniagua, T. Nunes, M. Otero, L. F. Calvo and C. Alves, Emissions from residential pellet combustion of an invasive acacia species, Renewable Energy, 2019, 140, 319–329 CrossRef CAS.
- J. Růžičková, H. Raclavská, D. Juchelková, M. Kucbel and K. Slamová, The origin of potential precursors of secondary organic aerosols during combustion of biochar and softwood in residential heating, Process Saf. Environ. Prot., 2022, 161, 147–161 CrossRef.
- N. Ottosson, A. O. Romanova, J. Soderstrom, O. Bjorneholm, G. Ohrwall and M. V. Fedorov, Molecular sinkers: X-ray photoemission and atomistic simulations of benzoic acid and benzoate at the aqueous solution/vapor interface, J. Phys. Chem. B, 2012, 116, 13017–13023 CrossRef CAS PubMed.
- D. J. Donaldson and V. Vaida, The Influence of Organic Films at the Air−Aqueous Boundary on Atmospheric Processes, Chem. Rev., 2006, 106, 1445–1461 CrossRef CAS PubMed.
- B. Minofar, P. Jungwirth, M. R. Das, W. Kunz and S. Mahiuddin, Propensity of formate, acetate, benzoate, and phenolate for the aqueous solution/vapor interface: Surface tension measurements and molecular dynamics simulations, J. Phys. Chem. C, 2007, 111, 8242–8247 CrossRef CAS.
- R. G. Knollenberg, A Laboratory Study of the Local Cooling Resulting from the Dissolution of Soluble Ice Nuclei Having Endothermic Heats of Solution, J. Atmos. Sci., 1969, 26, 115–124 CrossRef CAS.
- M. Komabayasi and Y. Ikebe, Organic Ice Nuclei: Iceforming Properties of Some Aromatic Compounds, J. Meteorol. Soc. Jpn., 1961, 39, 82–95 CrossRef.
- T. Koyama, T. Inada, C. Kuwabara, K. Arakawa and S. Fujikawa, Anti-ice nucleating activity of polyphenol compounds against silver iodide, Cryobiology, 2014, 69, 223–228 CrossRef CAS PubMed.
- F. Parungo, Physical and Chemical Properties of AgI Aerosols Formed at Simulated Airborne Conditions, Department of Commerce, National Oceanic and Atmospheric Administration, 1975 Search PubMed.
- M. A. Brown, A. B. Redondo, I. Jordan, N. Duyckaerts, M.-T. Lee, M. Ammann, F. Nolting, A. Kleibert, T. Huthwelker, J.-P. Mächler, M. Birrer, J. Honegger, R. Wetter, H. J. Wörner and J. A. v. Bokhoven, A new endstation at the Swiss Light Source for ultraviolet photoelectron spectroscopy, X-ray photoelectron spectroscopy, and X-ray absorption spectroscopy measurements of liquid solutions, Rev. Sci. Instrum., 2013, 84, 073904 CrossRef PubMed.
- M.-T. Lee, M. A. Brown, S. Kato, A. Kleibert, A. Türler and M. Ammann, Competition between Organics and Bromide at the Aqueous Solution–Air Interface as Seen from Ozone Uptake Kinetics and X-ray Photoelectron Spectroscopy, J. Phys. Chem. A, 2015, 119, 4600–4608 CrossRef CAS PubMed.
- M.-T. Lee, F. Orlando, L. Artiglia, S. Chen and M. Ammann, Chemical Composition and Properties of the Liquid–Vapor Interface of Aqueous C1 to C4 Monofunctional Acid and Alcohol Solutions, J. Phys. Chem. A, 2016, 120, 9749–9758 CrossRef CAS PubMed.
- M.-T. Lee, F. Orlando, M. Khabiri, M. Roeselová, M. A. Brown and M. Ammann, The opposing effect of butanol and butyric acid on the abundance of bromide and iodide at the aqueous solution–air interface, Phys. Chem. Chem. Phys., 2019, 21, 8418–8427 RSC.
- B. Winter, R. Weber, W. Widdra, M. Dittmar, M. Faubel and I. V. Hertel, Full Valence Band Photoemission from Liquid Water Using EUV Synchrotron Radiation, J. Phys. Chem. A, 2004, 108, 2625–2632 CrossRef CAS.
- B. Winter and M. Faubel, Photoemission from Liquid Aqueous Solutions, Chem. Rev., 2006, 106, 1176–1211 CrossRef CAS PubMed.
- L. Artiglia, J. Edebeli, F. Orlando, S. Chen, M.-T. Lee, P. Corral Arroyo, A. Gilgen, T. Bartels-Rausch, A. Kleibert, M. Vazdar, M. Andres Carignano, J. S. Francisco, P. B. Shepson, I. Gladich and M. Ammann, A surface-stabilized ozonide triggers bromide oxidation at the aqueous solution-vapour interface, Nat. Commun., 2017, 8, 700 CrossRef PubMed.
- M. A. Brown, A. Beloqui Redondo, M. Sterrer, B. Winter, G. Pacchioni, Z. Abbas and J. A. van Bokhoven, Measure of Surface Potential at the Aqueous–Oxide Nanoparticle Interface by XPS from a Liquid Microjet, Nano Lett., 2013, 13, 5403–5407 CrossRef CAS PubMed.
- N. L. Prisle, N. Ottosson, G. Öhrwall, J. Söderström, M. Dal Maso and O. Björneholm, Surface/bulk partitioning and acid/base speciation of aqueous decanoate: direct observations and atmospheric implications, Atmos. Chem. Phys., 2012, 12, 12227–12242 CrossRef CAS.
- M. J. Krisch, R. D'Auria, M. A. Brown, D. J. Tobias, C. Hemminger, M. Ammann, D. E. Starr and H. Bluhm, The Effect of an Organic Surfactant on the Liquid−Vapor Interface of an Electrolyte Solution, J. Phys. Chem. C, 2007, 111, 13497–13509 CrossRef CAS.
- D. E. Peebles and J. M. White, Adsorption of D2O on Ni(100) at 100 K and the influence of the coadsorbates O(a), CO(a) and D(a), Surf. Sci., 1984, 144, 512–540 CrossRef CAS.
- R. Reissner, U. Radke, M. Schulze and E. Umbach, Water coadsorbed with oxygen and potassium on thin NiO(100) films, Surf. Sci., 1998, 402–404, 71–75 CrossRef CAS.
- S. Krischok, O. Höfft, J. Günster, J. Stultz, D. W. Goodman and V. Kempter, H2O interaction with bare and Li-precovered TiO2: studies with electron spectroscopies (MIES and UPS(HeI and II)), Surf. Sci., 2001, 495, 8–18 CrossRef CAS.
- J. D. Smith, C. D. Cappa, K. R. Wilson, B. M. Messer, R. C. Cohen and R. J. Saykally, Energetics of Hydrogen Bond Network Rearrangements in Liquid Water, Science, 2004, 306, 851–853 CrossRef CAS PubMed.
- S. Myneni, Y. Luo, L. Å. Näslund, M. Cavalleri, L. Ojamäe, H. Ogasawara, A. Pelmenschikov, W. Ph, P. Väterlein, C. Heske, Z. Hussain, L. G. M. Pettersson and A. Nilsson, Spectroscopic probing of local hydrogen-bonding structures in liquid water, J. Phys.: Condens. Matter, 2002, 14, L213 CrossRef CAS.
- M. Cavalleri, H. Ogasawara, L. G. M. Pettersson and A. Nilsson, The interpretation of X-ray absorption spectra of water and ice, Chem. Phys. Lett., 2002, 364, 363–370 CrossRef CAS.
- K. R. Wilson, M. Cavalleri, B. S. Rude, R. D. Schaller, A. Nilsson, L. Pettersson, N. Goldman, T. Catalano, J. Bozek and R. Saykally, Characterization of hydrogen bond acceptor molecules at the water surface using near-edge x-ray absorption fine-structure spectroscopy and density functional theory, J. Phys.: Condens. Matter, 2002, 14, L221 CrossRef CAS.
- D. Frenkel and B. Smit, Understanding Molecular Simulations, Academic Press, London, 2002 Search PubMed.
- I. Gladich and S. Neshyba, in Chemistry in the Cryosphere, WORLD SCIENTIFIC, 2020, vol. 3, pp. 173–257 Search PubMed.
- R. Car and M. Parrinello, Unified Approach for Molecular Dynamics and Density-Functional Theory, Phys. Rev. Lett., 1985, 55, 2471–2474 CrossRef CAS PubMed.
- D. Marx and J. Hutter, Ab Initio Molecular Dynamics, Cambridge University Press, New York, 2009 Search PubMed.
- PubChem Compound Summary for CID 5054, Resorcinol, retrieved May 20, 2022 from https://pubchem.ncbi.nlm.nih.gov/compound/Resorcinol Search PubMed.
- S. H. Yalkowsky, Y. He and P. Jain, Handbook of Aqueous Solubility Data, CRC press, 2016 Search PubMed.
- CSID:13839080, http://www.chemspider.com/Chemical-Structure.13839080.html, accessed Aug 11, 2022.
- F. Orlando, L. Artiglia, H. Yang, X. Kong, K. Roy, A. Waldner, S. Chen, T. Bartels-Rausch and M. Ammann, Disordered Adsorbed Water Layers on TiO2 Nanoparticles under Subsaturated Humidity Conditions at 235 K, J. Phys. Chem. Lett., 2019, 10, 7433–7438 CrossRef CAS PubMed.
- H. Yang, A. Boucly, J. P. Gabathuler, T. Bartels-Rausch, L. Artiglia and M. Ammann, Ordered Hydrogen Bonding Structure of Water Molecules Adsorbed on Silver Iodide Particles under Subsaturated Conditions, J. Phys. Chem. C, 2021, 125, 11628–11635 CrossRef CAS.
- K. R. Wilson, B. S. Rude, J. Smith, C. Cappa, D. T. Co, R. D. Schaller, M. Larsson, T. Catalano and R. J. Saykally, Investigation of volatile liquid surfaces by synchrotron x-ray spectroscopy of liquid microjets, Rev. Sci. Instrum., 2004, 75, 725–736 CrossRef CAS.
- C. J. Powell, A. Jablonski and F. Salvat, NIST databases with electron elastic-scattering cross sections, inelastic mean free paths, and effective attenuation lengths, Surf. Interface Anal., 2005, 37, 1068–1071 CrossRef CAS.
- M. J. Abraham, T. Murtola, R. Schulz, S. Páll, J. C. Smith, B. Hess and E. Lindahl, GROMACS: high performance molecular simulations through multi-level parallelism from laptops to supercomputers, SoftwareX, 2015, 1–2, 19–25 CrossRef.
- J. Hutter, M. Iannuzzi, F. Schiffmann and J. VandeVondele, cp2k: atomistic simulations of condensed matter systems, Wiley Interdiscip. Rev. Comput. Mol. Sci., 2014, 4, 15–25 CrossRef CAS.
- I.-F. W. Kuo and C. J. Mundy, An ab Initio Molecular Dynamics Study of the Aqueous Liquid-Vapor Interface, Science, 2004, 303, 658–660 CrossRef CAS PubMed.
- J. P. Jämbeck and A. P. Lyubartsev, Update to the general amber force field for small solutes with an emphasis on free energies of hydration, J. Phys. Chem. B, 2014, 118, 3793–3804 CrossRef PubMed.
- W. L. Jorgensen, J. Chandrasekhar, J. D. Madura, R. W. Impey and M. L. Klein, Comparison of simple potential functions for simulating liquid water, J. Chem. Phys., 1983, 79, 926–935 CrossRef CAS.
- J. L. Abascal and C. Vega, A general purpose model for the condensed phases of water: TIP4P/2005, J. Chem. Phys., 2005, 123, 234505 CrossRef CAS PubMed.
- C. Vega and J. L. Abascal, Simulating water with rigid non-polarizable models: a general perspective, Phys. Chem. Chem. Phys., 2011, 13, 19663–19688 RSC.
- I. Gladich and M. Roeselová, Comparison of selected polarizable and nonpolarizable water models in molecular dynamics simulations of ice I h, Phys. Chem. Chem. Phys., 2012, 14, 11371–11385 RSC.
- R. García Fernández, J. L. Abascal and C. Vega, The melting point of ice I h for common water models calculated from direct coexistence of the solid-liquid interface, J. Chem. Phys., 2006, 124, 144506 CrossRef PubMed.
- J. R. Errington and P. G. Debenedetti, Relationship between structural order and the anomalies of liquid water, Nature, 2001, 409, 318–321 CrossRef CAS PubMed.
- P.-L. Chau and A. Hardwick, A new order parameter for tetrahedral configurations, Mol. Phys., 1998, 93, 511–518 CrossRef CAS.
- M. Conde, C. Vega and A. Patrykiejew, The thickness of a liquid layer on the free surface of ice as obtained from computer simulation, J. Chem. Phys., 2008, 129, 014702 CrossRef CAS PubMed.
- M. Chen, H.-Y. Ko, R. C. Remsing, M. F. C. Andrade, B. Santra, Z. Sun, A. Selloni, R. Car, M. L. Klein and J. P. Perdew, Ab initio theory and modeling of water, Proc. Natl. Acad. Sci. U.S.A., 2017, 114, 10846–10851 CrossRef CAS PubMed.
- T. A. Pham, M. Govoni, R. Seidel, S. E. Bradforth, E. Schwegler and G. Galli, Electronic structure of aqueous solutions: bridging the gap between theory and experiments, Sci. Adv., 2017, 3, e1603210 CrossRef PubMed.
- A. P. Gaiduk, M. Govoni, R. Seidel, J. H. Skone, B. Winter and G. Galli, Photoelectron spectra of aqueous solutions from first principles, J. Am. Chem. Soc., 2016, 138, 6912–6915 CrossRef CAS PubMed.
- Y. Ping, Y. Li, F. Gygi and G. Galli, Tungsten oxide clathrates for water oxidation: a first principles study, Chem. Mater., 2012, 24, 4252–4260 CrossRef CAS.
- G. Theodorakopoulos, I. G. Csizmadia, M. A. Robb and I. Kapovits, Experimental (ESCA) and theoretical (SCF–MO) determination of the oxidation state of sulphur in bis (2-carboxyphenyl) sulphur dihydroxide dilactone, J. Chem. Soc. Faraday Trans. II, 1977, 73, 293–297 RSC.
- M. Giesbers, A. T. Marcelis and H. Zuilhof, Simulation of XPS C1s spectra of organic monolayers by quantum chemical methods, Langmuir, 2013, 29, 4782–4788 CrossRef CAS PubMed.
- M. Ammann, L. Artiglia and T. Bartels-Rausch, X-Ray Excited Electron Spectroscopy to Study Gas–Liquid Interfaces of Atmospheric Relevance, in Physical Chemistry of Gas-Liquid Interfaces, ed. J. A. Faust and J. E. House, Elsevier, 2018, ch. 6, pp. 135–166 Search PubMed.
- J. Hicks, K. Kemnitz, K. Eisenthal and T. Heinz, Studies of liquid surfaces by second harmonic generation, J. Phys. Chem., 1986, 90, 560–562 CrossRef CAS.
- L. Vrbka, M. Mucha, B. Minofar, P. Jungwirth, E. C. Brown and D. J. Tobias, Propensity of soft ions for the air/water interface, Curr. Opin. Colloid Interface Sci., 2004, 9, 67–73 CrossRef CAS.
- L. Herrera, C. Fan, D. Do and D. Nicholson, A revisit to the Gibbs dividing surfaces and helium adsorption, Adsorption, 2011, 17, 955–965 CrossRef CAS.
- I. Gladich, S. Chen, H. Yang, A. Boucly, B. Winter, J. A. van Bokhoven, M. Ammann and L. Artiglia, Liquid–Gas Interface of Iron Aqueous Solutions and Fenton Reagents, J. Phys. Chem. Lett., 2022, 13, 2994–3001 CrossRef CAS PubMed.
- R. D. Hoehn, M. A. Carignano, S. Kais, C. Zhu, J. Zhong, X. C. Zeng, J. S. Francisco and I. Gladich, Hydrogen bonding and orientation effects on the accommodation of methylamine at the air-water interface, J. Chem. Phys., 2016, 144, 214701 CrossRef PubMed.
- D. Heger, D. Nachtigallová, F. Surman, J. Krausko, B. Magyarová, M. Brumovsky, M. Rubes, I. Gladich and P. Klán, Self-organization of 1-methylnaphthalene on the surface of artificial snow grains: A combined experimental–computational approach, J. Phys. Chem. A, 2011, 115, 11412–11422 CrossRef CAS PubMed.
- R. Kania, J. K. E. Malongwe, D. Nachtigallova, J. Krausko, I. Gladich, M. Roeselova, D. Heger and P. Klan, Spectroscopic properties of benzene at the air–ice interface: a combined experimental–computational approach, J. Phys. Chem. A, 2014, 118, 7535–7547 CrossRef CAS PubMed.
- I. Gladich, A. Habartová and M. Roeselová, Adsorption, mobility, and self-association of naphthalene and 1-methylnaphthalene at the water–vapor interface, J. Phys. Chem. A, 2014, 118, 1052–1066 CrossRef CAS PubMed.
- D. E. Braun, D. A. Tocher, S. L. Price and U. J. Griesser, The Complexity of Hydration of Phloroglucinol: A Comprehensive Structural and Thermodynamic Characterization, J. Phys. Chem. B, 2012, 116, 3961–3972 CrossRef CAS PubMed.
- R. Vácha, P. Jungwirth, J. Chen and K. Valsaraj, Adsorption of polycyclic aromatic hydrocarbons at the air–water interface: molecular dynamics simulations and experimental atmospheric observations, Phys. Chem. Chem. Phys., 2006, 8, 4461–4467 RSC.
- A. Nilsson, D. Nordlund, I. Waluyo, N. Huang, H. Ogasawara, S. Kaya, U. Bergmann, L. Å. Näslund, H. Öström, P. Wernet, K. J. Andersson, T. Schiros and L. G. M. Pettersson, X-ray absorption spectroscopy and X-ray Raman scattering of water and ice; an experimental view, J. Electron Spectrosc. Relat. Phenom., 2010, 177, 99–129 CrossRef CAS.
- P. Wernet, D. Nordlund, U. Bergmann, M. Cavalleri, M. Odelius, H. Ogasawara, L. Å. Näslund, T. K. Hirsch, L. Ojamäe, P. Glatzel, L. G. M. Pettersson and A. Nilsson, The Structure of the First Coordination Shell in Liquid Water, Science, 2004, 304, 995–999 CrossRef CAS PubMed.
- C. D. Cappa, J. D. Smith, K. R. Wilson, B. M. Messer, M. K. Gilles, R. C. Cohen and R. J. Saykally, Effects of Alkali Metal Halide Salts on the Hydrogen Bond Network of Liquid Water, J. Phys. Chem. B, 2005, 109, 7046–7052 CrossRef CAS PubMed.
- I. Gladich, A. Oswald, N. Bowens, S. Naatz, P. Rowe, M. Roeselova and S. Neshyba, Mechanism of anisotropic surface self-diffusivity at the prismatic ice–vapor interface, Phys. Chem. Chem. Phys., 2015, 17, 22947–22958 RSC.
- I. Gladich, W. Pfalzgraff, O. Maršálek, P. Jungwirth, M. Roeselová and S. Neshyba, Arrhenius analysis of anisotropic surface self-diffusion on the prismatic facet of ice, Phys. Chem. Chem. Phys., 2011, 13, 19960–19969 RSC.
- Y. Qiu, N. Odendahl, A. Hudait, R. Mason, A. K. Bertram, F. Paesani, P. J. DeMott and V. Molinero, Ice Nucleation Efficiency of Hydroxylated Organic Surfaces Is Controlled by Their Structural Fluctuations and Mismatch to Ice, J. Am. Chem. Soc., 2017, 139, 3052–3064 CrossRef CAS PubMed.
Footnote |
| † Electronic supplementary information (ESI) available: XPS spectra of O 1s at KE 155 eV, Photoelectron attenuation model, MD and DOS computational details. See https://doi.org/10.1039/d2ea00015f |
| This journal is © The Royal Society of Chemistry 2022 |