 Open Access Article
Rate coefficients for the O + H2 and O + D2 reactions: how well ring polymer molecular dynamics accounts for tunelling†
Marta Menéndeza,
Anzhela Veselinovab,
Alexandre Zanchet c,
Pablo G. Jambrina
 b and
F. Javier Aoiz
 *a
*a
aDepartamento de Química Física, Unidad Asociada CSIC, Universidad Complutense de Madrid, 28040 Madrid, Spain. E-mail: aoiz@ucm.es
bDepartamento de Química Física, Universidad de Salamanca, 37008 Salamanca, Spain
cInstituto de Física Fundamental, CSIC, C/Serrano 121-123, 28006 Madrid, Spain
First published on 5th July 2024
Abstract
We present here extensive calculations of the O(3P) + H2 and O(3P) + D2 reaction dynamics spanning the temperature range from 200 K to 2500 K. The calculations have been carried out using fully converged time-independent quantum mechanics (TI QM), quasiclassical trajectories (QCT) and ring polymer molecular dynamics (RPMD) on the two lowest lying adiabatic potential energy surfaces (PESs), 13A′ and 13A′′, calculated by Zanchet et al. [J. Chem. Phys., 2019, 151, 094307]. TI QM rate coefficients were determined using the cumulative reaction probability formalism on each PES including all of the total angular momenta and the Coriolis coupling and can be considered to be essentially exact within the Born–Oppenheimer approximation. The agreement between the rate coefficients calculated by using QM and RPMD is excellent for the reaction with D2 in almost the whole temperature range. For the reaction with H2, although the agreement is very good above 500 K, the deviations are significant at lower temperatures. In contrast, the QCT calculations largely underestimate the rate coefficients for the two isotopic variants due to their inability to account for tunelling. The differences found in the disagreements between RPMD and QM rate coefficients for the reactions for both the isotopologues are indicative of the ability of the RPMD method to accurately describe systems where tunelling plays a relevant role. Considering that both reactions are dominated by tunelling below 500 K, the present results show that RPMD is a very powerful tool for determining rate coefficients. The present QM rate coefficients calculated on adiabatic PESs slightly underestimate the best global fits of the experimental measurements, which we attribute to the intersystem crossing with the singlet 11A′ PES.
1 Introduction
The gas-phase reaction between atomic oxygen in its electronic ground state and molecular hydrogen leading to a hydroxyl radical and a hydrogen atom is of paramount importance in the chain reaction of the H2 + O2 combustion. It is also one of the main sources of OH in the mesosphere in collisions with vibrationally excited H2. Similarly, it seems to be important in the production of OH in photon-dominated regions where H2 can be excited to sufficiently high rovibrational states.1–5 For all these reasons, it is one of the benchmark systems in experimental and theoretical kinetics, and their thermal rate coefficients have been measured in a wide range of temperatures using different techniques such as flow methods, shock tubes or flash photolysis6–20 covering a temperature range from 300 K to 5000 K. For a relatively recent compilation of rate coefficients, see ref. 21 and 22. The kinetics of the O(3P) + D2 reaction has been also the subject of different measurements,8,15,19,23,24 making it possible to obtain the kinetic isotope effect (KIE), and to evaluate the importance of tunelling for the present reaction.The reaction is slightly endothermic,  , but the reactivity is limited by a large electronic barrier of 0.59 eV (≈0.53 eV for O + H2 when the zero point energies of reactants and transition state are included). Experimental crossed-beam experiments were hampered by the barrier of the reaction,25–27 requiring the use of the hyperthermal atomic-oxygen beam source but, nevertheless, it was possible to measure integral cross sections,28 differential cross sections,29 and even Λ-doublet propensities of OD(2Π) produced in the O + D2 reaction.30,31 In most crossed-beam experiments, D2 is preferred over H2 since for the same velocity of atomic oxygen in the laboratory-frame it leads to higher collision energies, making it somewhat easier to overcome the experimental difficulties arising from the high electronic energy barrier. Motivated by these and previous experiments, a myriad of dynamical calculations have been carried out intended to simulate the experimental findings and calculate the reaction rate coefficients.25,27–29,32–37
The present work is aimed to compare the experimental rate coefficients for O(3P) + H2 and O(3P) + D2 with those calculated using rigorous quantum mechanical (QM), quasi-classical (QCT) and ring polymer molecular dynamics (RPMD) calculations, which have been carried out on the two adiabatic 13A′ and 13A′′ PESs, and the respective results are combined to get the total reaction rate covering a range of temperatures between 200 K and 2500 K.
Over the last decade, RPMD has proven to be a very efficient method for the determination of thermal rate coefficients for a wide variety of chemical reactions with remarkable accuracy.38–45 In spite of the use of classical mechanics, given the isomorphism between quantum and classical statistical mechanics of harmonic ring polymers, RPMD has been shown to account for the zero point energy (ZPE) problem almost exactly and with tunnelling, if not completely, then at least to a considerable degree.46–48 The present calculations of O + H2 and O + D2 on the two triplet PESs provide an excellent opportunity to test the performance of RPMD in the treatment of tunelling by comparison with fully converged, essentially exact, QM calculations on the same PESs. As it happens, RPMD almost exactly reproduces the QM results for the reaction with D2. For the reaction with H2 the agreement is also very good at temperatures above 500 K, but at lower temperatures, the agreement is not as good as that for the O + D2 reaction.
The article is laid out as follows: Section 2 presents a brief review of the theoretical methods used in this work; Section 3 covers the computational details of the QM, RPMD and QCT calculations; the results and their discussion are shown in Section 4. The conclusions are presented in Section 5.
2 Theoretical background
2.1 Potential energy and minimum energy paths
The nine states of O(3PJa), Ja = 2, 1, 0, (where Ja is the atomic total electronic momentum) upon interaction with H2/D2 in their ground electronic state give rise to three triplet PESs, 13A′′, 13A′ and 23A′′. Of the five degenerate sates of the 3P2 manifold, three correlate with the 13A′′ PES, and the remaining two correlate with the 13A′ PES, which also correlates with one of the three degenerate states of the 3P1 manifold. The other two spin–orbit states of 3P1 as well as the 3P0 state correlate with 23A′′. Whilst both the 13A′′ and 13A′ PESs also correlate with the products in their ground state, OH(2Π) + H(2Sg), 23A′′ is highly repulsive and correlates with the products in an excited state. Therefore, the reaction can take place adiabatically on the 13A′′ and 13A′ PESs (henceforth 3A′′ and 3A′), whose saddle points correspond to a collinear arrangement. Moreover, except for large O–H2 distances, the two PESs are degenerate in the linear configuration and exhibit the same barrier. However, as the system draws away from the linear configuration, the degeneracy is broken and the 3A′ PES shows a steeper bending potential leading to a narrower cone of acceptance. As a result of the steeper bending potential, the bending frequency is 70% higher on the 3A′ PES,27 leading to a vibrationally adiabatic barrier (including the ZPE) that is 40 meV higher than on the 3A′′ PES for the O + H2 reaction.As given in previous works,27,33,37,49,50 calculations have been carried out separately on the two adiabatic PESs, of symmetries 3A′′ and 3A′ calculated by Zanchet et al.,27 which accurately reproduces the degeneracy between both PESs for collinear geometries, including the saddle point. The PESs were fitted using a many-body expansion based on ab initio energies calculated using the internally contracted multireference configuration interaction method including Davidson correction (icMCRCI + Q) based on a wave function calculated at a state-average complete active space (SA-CASSCF) level of theory including in the active site all valence electrons of the three atoms. Calculations on these PESs were able to reproduce the experimental Λ-doublet propensities of OD produced by collisions between atomic oxygen and a D2 molecule.37 These global analytical PESs overestimate the ab initio barrier height by only 6 meV for both 3A′′ and 3A′ states. In contrast, the GLDP fit of the RWKW PES by Rogers et al.25 underestimates the ab initio barrier by 26 and 18 meV, respectively, and hence they are not degenerate in the collinear approach.
Fig. 1 shows the comparison of the vibrationally adiabatic minimum energy paths (MEPs) for the two isotopic variants on the 3A′ and 3A′′ PESs, related to the respective zero point energies of H2 and D2. The MEPs are plotted as a function of the mass-scaled reaction coordinate, s, which measures the progress of the reaction, and is given by
 | (1) |
 | (2) |
| Q2 = μBC1/2RBC, | (3) |
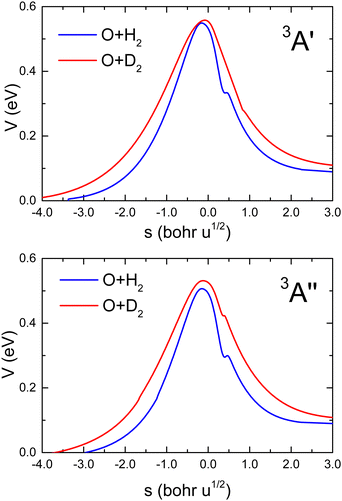 | ||
| Fig. 1 Vibrationally adiabatic minimum energy paths for O(3P) + H2 (blue) and O(3P) + D2 (red) reactions as a function of the mass-scaled reaction coordinate (see text for definition) on the 3A′ (upper panel) and 3A′′ (bottom panel) PESs calculated by Zanchet et al.27 In both cases, the minimum energy paths for the two isotopes are referred to as the respective ZPE of H2 and D2. | ||
Given the differences in the MEPs of the two isotopic variants, especially in their widths, the expected tunelling contribution to the reaction will be more important for O + H2. This is underpinned by the crossover temperatures, Tc, for the two isotopic variants, which is given by
 | (4) |
In this work, we will assume that the two triplet states 3A′ and 3A′′ are uncoupled. Our calculations do not include the intersystem crossing (ISC) between the singlet 11A′ and the triplet 13A′′ and 13A′ PESs. Schatz and coworkers were the first to study the influence of ICS on the O + H2 reaction.36,54 They determine the spin–orbit coupling matrix using a four-state model. It was found that the singlet state crosses the two triplet states near the barrier (see Fig. 1 of ref. 36). They performed trajectory surface hopping calculations and found that the effect of ICS is relatively minor and is only noticeable at collision energies above 1 eV. So even if some collisions sample the singlet PES, the spin–orbit coupling is expected to have a relatively small effect on the dynamics of the system. Similar conclusions have been drawn from a QM non-adiabatic study for the O(3P) + D2 reaction, where, interestingly, the influence of the ISC was found to be larger than for the H2 reaction.55 The Renner–Teller coupling between the 3A′ and 3A′′ PESs, neither is considered. It is expected to have some effect,56 which would be more pronounced at high orbital angular momentum (impact parameter) values. Although non-adiabatic effects are expected to be small, given the general good agreement with adiabatic results,28,32,33,49 the comparison of the current accurate adiabatic calculations on the two separate recent PESs with the experimental rate coefficients may shed light on their importance.
2.2 QM and QCT cumulative reaction probabilities
Calculation of QM and QCT rate coefficients have been carried out by means of the cumulative reaction probabilities (CRP), which will be denoted by Cr(E).57–62 The QM CRP at a given total angular momentum, J, and total energy, Etot, measured from the asymptotic minimum of the reactant's potential, is given by
 | (5) |
 is the S matrix element connecting reactant's and product's states, and PJv,j,Ω(Etot) is the reaction probability for initial v, j, Ω summed over all final states. The summations run over all possible states of reactants and products compatible with Etot. The total CRP is given by
 | (6) |
In the case of homonuclear molecules, the diatomic parity, p, has to be taken into account. The parity dependent CRP can be written as
 | (7) |
The reaction rate coefficients can be written in terms of the total CRPs
 | (8) |
 | (9) |
 | (10) |
Of particular interest is the thermal reaction probability, which can be defined as
 | (11) |
The thermal-CRP represents the contribution of the Boltzmann weighted total CRP to the rate coefficient in an interval of energies between Etot and Etot + dEtot. Its integration over the total energy range yields k(T).
The above equations assume that there is ortho and para equilibrium at all temperatures. However, in most experiments, since the ortho ↔ para conversion is very slow, the fraction of ortho/para usually is the same as that at room temperature. At 300 K and above, the respective weights are w(o/e) ≈ g(o/e)n/(g(o)n + g(e)n). The rate coefficients calculated under these circumstances can be written as63
 | (12) |
 | (13) |
Except at temperatures below 200 K, the rate coefficients obtained using eqn (8) and (12) are the same within the accuracy of the various dynamical methods. The details of the methodology used to calculate the QCT CJr(E) are given elsewhere.62,64,65
In eqn (8) and (12) the calculation of rate coefficients only considers the contributions from one of the concurrent PESs. To simulate the experimental conditions, it is necessary to average the k(T) obtained for the 3A′ and 3A′′ PESs. When the correlation between the oxygen atomic states and the two triplet states is taken into account, as mentioned above, the 3A′ PES correlates with two of the five components of O(3P2), and one component of O(3P1), whilst the 3A′′ PES correlates with the remaining three components of O(3P2).4 Under these conditions, k(T) is given by
 | (14) |
D = 5 + 3![[thin space (1/6-em)]](https://www.rsc.org/images/entities/char_2009.gif) exp(−βΔE1) + exp(−βΔE0), exp(−βΔE1) + exp(−βΔE0),
| (15) |
At sufficiently high temperatures kBT ≫ ΔE1 and ΔE0, and then
 | (16) |
2.3 Ring polymer molecular dynamics
The RPMD approach exploits the isomorphism between a statistical quantum system and a fictitious classical ring polymer consisting of harmonically connected beads, allowing the real-time evolution of the quantum system to be approximated by classical trajectories. The RPMD exhibits some important features: (a) it becomes exact in the high temperature limit, where the ring polymer collapses to a single bead; (b) it is independent of the choice of the transition state dividing surface; (c) it preserves the zero-point energy (ZPE) along the reaction path; (d) it has a well-defined short-time limit, which provides an upper limit of the RPMD rate coefficient. In addition to these features, RPMD provides the exact solution for tunnelling through a parabolic barrier. Thereby, it can be expected that more realistic barriers will account for most of the tunelling contribution to reaction, even in the deep tunnelling regime.38,39,44A detailed description of the RPMD rate theory can be found in ref. 40, 41, and 44. The technical aspects of the computational procedure are well documented in the manual of the general RPMDrate code.41
The ring polymer Hamiltonian of a system consisting of N atoms with fictitious ring polymers of nb beads can be written in atomic Cartesian coordinates as
 | (17) |
The method begins by introducing two dividing surfaces: one located in the asymptotic reactant valley, s0(![[q with combining macron]](https://www.rsc.org/images/entities/b_i_char_0071_0304.gif) ) = 0, and the other located in the transition state region, s1(
) = 0, and the other located in the transition state region, s1(![[q with combining macron]](https://www.rsc.org/images/entities/b_i_char_0071_0304.gif) ) = 0.41,44 The reaction coordinate ξ is taken to be an interpolating function that connects these dividing surfaces:
) = 0.41,44 The reaction coordinate ξ is taken to be an interpolating function that connects these dividing surfaces:
 | (18) |
 | (19) |
The correlation function formalism used in the computational procedure for the RPMD rate coefficient calculation is based on the t → +∞ limit of the ring polymer flux-side correlation function Cfs.41 The rate coefficient is then expressed using the Bennett–Chandler factorization66,67 as
| kRPMD(T) = kQTST(T;s1)κ(s1) | (20) |
 | (21) |
 | (22) |
The second factor κ(s1) in eqn (20) is the long time limit of the time-dependent ring polymer transmission coefficient, given by
 | (23) |
It represents a dynamical correction to kQTST(T) that accounts for recrossing of the transition-state dividing surface at t → tp, where tp is the time in which κ remains invariant.
In practice κ and p are calculated at the maximum free energy value, W(ξ‡), along the reaction coordinate ξ, which is a function used to connect the two dividing surfaces, and varies from ξ → 0 as s0 → 0 to ξ → 1 as s1 → 0.40,44
3 Computational details
As mentioned above, all calculations, QCT, RPMD and QM, were performed on the triplet PESs of Zanchet et al.27 Extensive TI QM scattering calculations were carried out using the coupled-channel hyperspherical coordinate formalism as implemented in the ABC code.68 Calculations were performed for the two triatomic and diatomic parities and J ∈ [0,62] for the O + H2 reaction and J ∈ [0,80] for O + D2, and 60 total energies in the 0.37–2.50 eV range. The propagation was performed using 300 sectors with a maximum hyperradius of 15a0, including on the basis of all the rovibrational states whose internal energy is below 3.25 eV, and a maximum value of the helicity quantum number of 25.RPMD calculations have been performed using the RPMDrate code41 and the simulation parameters are similar to those used in previous works.44,45,48 For the O + H2 reaction, calculations were carried out using nb = 32 in the temperature range 600–2500 K. As shown in Table S1 (ESI†), the nb required for convergence increase at low temperatures (128 at 200 K and 64 from 250–500 K). For the O + D2 reaction, convergence was achieved with nb = 64 in the whole temperature range. Purely classical calculations (not QCT) correspond to setting the number of beads nb = 1.39,44
To calculate the PMFs, W(ξ), the path was divided in 115 windows of 0.01 width with the reaction coordinate ξ defined between −0.05 and 1.10. In each of the windows, 100 RPMD trajectories were run, restraining the value of ξi to the center of the window adding a harmonic potential to the Hamilton function of the system. Each trajectory was thermalized for 20 ps after which it was run for 100 ps, using a time step of 0.1 fs. Based on the PMF profiles, the RPMD rate coefficients were obtained combining the quantum transition state theory (QTST) with the RPMD recrossing factor, κ (see eqn (20)). For the latter calculations, 105 child trajectories were run for 0.1 ps starting from an initial parent trajectory of 20 ps.
QCT values were computed following the cumulative reaction formalism described in ref. 62, 64 and 65. First, we calculated the cumulative reaction probabilities as a function of the total energy, Etot, for specific values of J, with all the internal states of H2 and D2 microcanonically sampled and calculated using the asymptotic diatomic potential energy of the PESs. Batches of 106 trajectories were calculated for each J at a variable total energy, which was sampled uniformly in the 0.6–4.0 eV range. In addition, the total CRPs, summed over all J, were calculated as a single batch (108 trajectories) for each PES and isotopic variant by randomly sampling the total energy and J values proportionally to the number of projections 2J + 1. Using the data thus obtained, the rate coefficients can be calculated directly without the need to first determine the CRP and avoiding numerical integration. The details of the method can be found in ref. 69. The trajectories were run from an initial atom–diatom distance of 10 Å, and an integration step of 5 × 10⁻² fs, which ensures an energy conservation better than 1 in 105. The total CRP, summed over all J, were calculated for each PES and isotopic variant.
4 Results and discussion
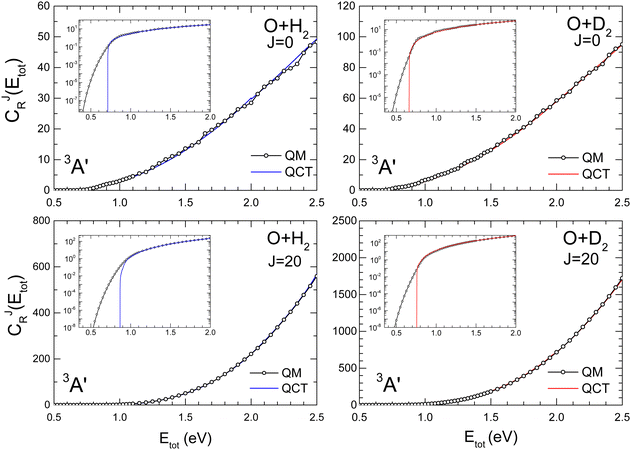
The comparison of QM and QCT CRPs are shown in Fig. 2 and 3 for the O + H2 and O + D2 reactions for J = 0 and J = 20 on the 3A′ and 3A′′ PESs, respectively. Analogous results for J = 10, 40 and 50 are shown in the ESI† (Fig. S2 for O + H2 and Fig. S3 for O + D2). At energies above the classical threshold, the agreement between QM and QCT is very good for all the represented CJr(Etot). However, the QCT CRP drops off suddenly below the classical threshold (see inset) whilst the QM curves die out very slowly, although with small values. The classical total energy thresholds are slightly higher for the reaction with H2 than for O + D2. For J = 0 the respective classical thresholds are below the vibrationally adiabatic barrier measured from the asymptotic reactant minimum (see Fig. S1, ESI†), which for O + H2 are 0.82 eV and 0.78 eV, and 0.75 eV and 0.72 eV for O + D2, for the 3A′ and 3A′′ PESs, respectively. This shows that the ZPE of the transition state is not conserved in the QCT calculations. However, the respective classical thresholds (≈0.70 eV and 0.67 eV for O + H2 and O + D2, respectively) are larger than the electronic barrier (see Fig. S1, ESI†), indicating that not all the reagent ZPE is employed to overcome the barrier. This effect was also observed in the isotopic variants of the H + H2 exchange reaction, and in particular in Mu + H2.48,70,71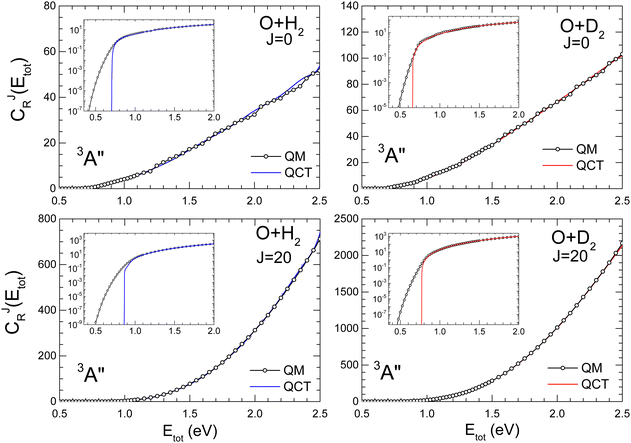 | ||
| Fig. 3 Same as Fig. 2 for the 3A′′ PES. | ||
With increasing J, due to the centrifugal barrier, the classical threshold increases rapidly (Fig. S2 and S3, ESI† for J = 40 and 50). Above the classical threshold, the agreement between QCT and QM CRPs is excellent in the whole range of J. The disagreement in the low energy regime, below the classical thresholds, leads to significantly different rate coefficients at low temperatures, where QCT should underestimate the QM rate coefficients. According to the behaviour of the CJr(Etot), it can be expected that at higher temperatures, where the contributions from energies below the classical threshold become less relevant, QM and QCT results should converge. Regardless of J, the PES and the isotopic variant, the CRP increases monotonically with the energy, and the density of reactive states72 only give rise to some oscillations, which could be attributed to quantized transition states for J = 0.
The computational burden of QM calculations of thermal rate coefficients increases considerably with T. This is because calculations at higher T involve scattering calculations at higher Etot, which in turn require higher values of J and Ω, and also to include more rovibrational states in the basis. The excellent agreement between QM and QCT CJr(Etot) at high Etot supports the idea that QM calculations at low Etot can be combined with QCT calculations at higher Etot, and still yield accurate rate coefficients in the whole range of energies almost indistinguishable from the rate coefficient obtained using only QM calculations.
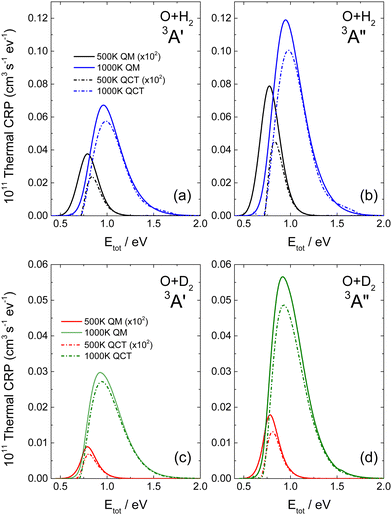
The thermal-CRP at 500 K and 1000 K are shown in Fig. 4 on the 3A′ and 3A′′ PESs for the two isotopic variants. As commented on previously, the thermal-CRP, Cr(Etot,T), represents the evolution of the reactivity as a function of the total energy for a given T, and facilitates the interpretation of the k(T), which is the integral of Cr(Etot,T). Below 500 K, most of the reactivity is associated with energies around or smaller the classical threshold, leading to a large difference between QCT and QM Cr(Etot,T). At these energies, differences of more than a factor of 2–3 are observed between the heights of the QM and QCT thermal-CRP for O + H2 on both PESs, and somewhat less for O + D2. With increasing temperature, the thermal-CRP shifts towards higher energies, where QCT and QM Cr(Etot,T) are more similar above 1.25 eV (QM and QCT thermal-CRP at 1500, 2000 and 2500 K are shown in Fig. S4 of the ESI† on the two PESs and for both isotopic variants). Overall, the low energy tail is very similar for the two approaches, indicating that the contribution from energies near the classical threshold is less relevant (see Fig. S4, ESI†). Also with increasing T, the high energy tail of the distribution extends to higher energies. In fact, whilst at 500 K only energies up to 1.1 eV are required to converge the k(T), at 2000 K energies up to 2.5 eV have to be included in the calculations.
For the calculation of rate coefficients at higher temperatures, Etot values of above 3.0 eV are required (see Fig. S4, ESI†). Covering such a wide range of energies is not a problem for QCT, as the computational cost is only slightly dependent on the total energy. However, the computational effort of QM scattering calculations increases rapidly with Etot. Due to the good agreement between QCT and QM CRP at high energies, one way to determine QM k(T) s at higher T values is to combine QM and QCT thermal-CRPs. Basically, what is needed is to infer the high energy tail of the QM thermal-CRP using QCT calculations. The procedure is as follows: the QCT thermal-CRP is scaled to match the QM thermal-CRP in the highest energy range where the latter has been calculated. The scaled QCT is used to extrapolate the QM thermal-CRP at energies for which there are no QM calculations. In the present work, the highest QM total energy calculated is 2.5 eV, whereas in QCT calculations, energies up to 4.0 eV were considered. To estimate the error resulting from this approximation, we calculated the k(T) at 2000 K using pure QM calculations and the QM-QCT combination. The discrepancy between the two calculations was found to be approximately 2%.
The potential mean force (PMF) profiles and transmission coefficients from the RPMD on the 3A′ and 3A′′ PESs are shown in Fig. S5 and S6 (ESI†) for the O + H2 and O + D2 reactions, respectively. The PMF profiles, W(ξ), for 300, 600, 1000 and 2000 K are plotted in the respective top panels. The maximum, which appear at a value of the reaction coordinate very close to ξ = 1 is slightly higher on the 3A′. Fig. S7 (ESI†) shows the comparison of the potential mean force profiles at T = 300 K and T = 2000 K obtained in the calculations on the two PESs and the two isotopic variants. At 300 K the free energy barriers (maximum of the PMF) follow a sequence dominated by the isotopic reaction (H2(A′′) < H2(A′) < D2(A′′) < D2(A′)), whereas at 2000 K the free energy barriers follow the sequence dictated by the PES (H2(A′′) < D2(A′′) < H2(A′) < D2(A′)).
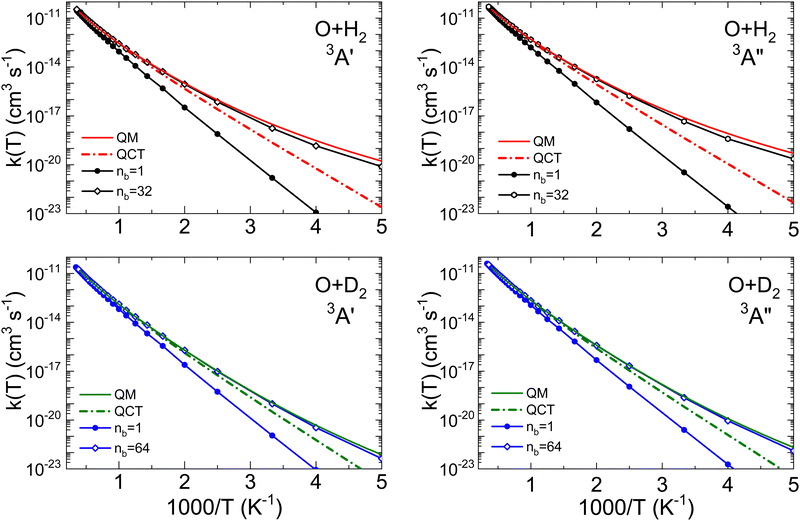
The long limit of the time-dependent ring polymer transmission coefficients, κ(t), reach their maximum value at an early time, ≈30 fs. At high temperatures they converge to ≈0.78 for O + H2 and to 0.80 for O + D2. The results with nb = 1 are equivalent to the purely classical ones, in which the initial quantization (ZPE) is not considered. This is the key distinction with the QCT rate coefficients, which take into account the quantization of the reactants (the detailed dependence of kQTST and κ on the number of beads can be found in Tables S1 and S2 of the ESI†).
Thermal rate coefficients for the O + H2 and O + D2 reactions on the 3A′ and 3A′′ PESs are shown in Fig. 5, where the results from QCT, RPMD and QM calculations are compared. The RPMD k(T) are plotted for nb = 1 and for the number of beads necessary for convergence. In all cases, the differences between the QCT k(T) with RPMD and QM indicate the importance of tunelling and, to a lesser extent, of the ZPE. The agreement between accurate adiabatic QM (with no approximations) and RPMD rate coefficients is remarkably good for O + D2 on both PESs. At 200 K the QM rate coefficients are about 63% higher, but at T = 300 K the difference reduces to 16%, becoming negligible at higher temperatures. For O + H2, the agreement is also good, but at T ≲ 400 K deviations from the QM results become apparent. At 200 K there is a factor of 2.2 between the k(T) calculated by the two methods; in any case, the difference can be considered relatively small, since k(T) changes by a factor of 105 in the 200 K and 500 K interval. The temperatures in which the RPMD results start to deviate from the QM k(T) closely correspond to the respective Tc for the two isotopic variants. Nevertheless, RPMD appears to be a very robust approximation to accurate QM results, and certainly at a much lower computational cost, even when a considerable number of beads are required. This is especially the case at the temperatures above 1500 K, where the QM calculations become computationally demanding, and the RPMD requires even fewer beads for convergence.
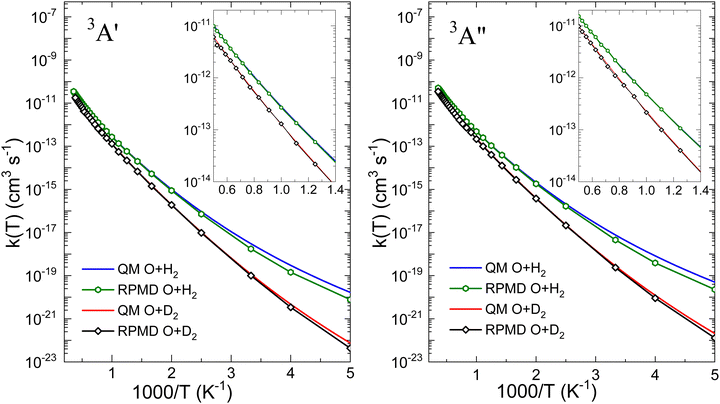
Fig. 6 is presented to further demonstrate the relevance of tunelling on the two PESs for the two isotopic variants in order to assess the ability of the RPMD method to deal with it. The comparison between the QM and RPMD k(T) on the 3A′ and 3A′′ PESs is shown in the figure. At T = 200 K, the QM and RPMD KIEs, kOH2(T)/kOD2(T), are ≈230 and 170 on both PESs. At 300 K, the respective QM and RPMD KIEs are 27 and 18, and at 500 K they drop to 5 in both calculations. The relevant issue is that RMPD accounts for the kinetic isotope effect very accurately on both PESs above 300 K. We will explore the comparison with measurable KIE averaged over the electronic states later in this section.
With regard to the comparison of the reactivity on the two PESs, it can be observed that the rate coefficients on the 3A′′ are greater for the two isotopic variants. For O + H2, the ratio  (T)/kA′(T) is ≈3 at 200 K, 2.1 at 500 K and 1.8 at 1000 K. At 2500 K the rate coefficient for the reaction with H2 is only 50% bigger than for O + D2. The ratios obtained from the RPMD are very similar. Two factors contribute the higher reactivity observed on the 3A′′ PES: (i) as illustrated in Fig. 1, the adiabatic barrier is slightly smaller and somewhat narrower, so tunelling is likely to be more efficient in this PES; (ii) the bending potential on the 3A′ PES is steeper leading to a narrower cone of acceptance, whose effect is especially noticeable at collision energies above 1.0 eV. The higher kA′′(T)/kA′(T) ratio at low temperatures suggests that the former effect is more important. This result agrees with the energy dependence of the ratio between the cross section on the 3A′ and 3A′′ obtained for the O + H2 (j > 0).49,50 The kA′′(T)/kA′(T) ratio at low T is slightly smaller for O + D2 reaction, confirming that tunelling is less important for this isotopic variant.
The comparison of the experimental data8–10,13–17,20 and the theoretical k(T), are shown in Fig. 7 and 8 for the O + H2 and O + D2 reactions, respectively. For a proper comparison, it is necessary to combine the rate coefficients calculated separately on the 3A′ and the 3A′′ PESs, as it has been discussed in Section 2.2. Eqn (14), which takes into account the correlation of the states of 3P2 and 3P1 and the 3A′ and 3A′′ PESs, has been used in this work. Although in the high temperature limit, eqn (14) is reduced to eqn (16), even at 1000 K there is a deviation of 7%.
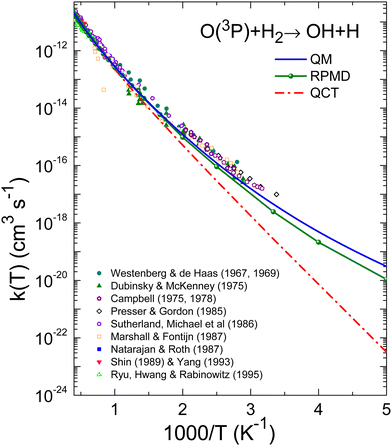 | ||
| Fig. 7 Comparison of experimental rate coefficients with those obtained with QM (blue solid line), RPMD (green line with solid circles), and QCT (red short-dashed line) for the O(3P) + H2 reaction between 200 and 2500 K. Experimental results: Westenberg and de Haas,8,9 Dubinsky and McKenney,10 Campbell and Handy11,12 Presser and Gordon,13 Sutherland et al.,14 Marshall and Fontijn,15 Natarajan and Roth,16 Shin et al.,17 Yang,19 and Ryu et al.20 | ||
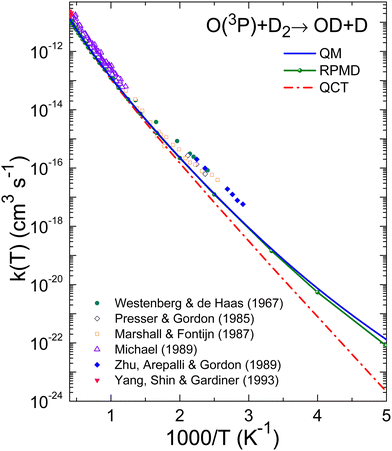 | ||
| Fig. 8 Same as Fig. 7 for the O(3P) + D2 reaction. Experimental results: Westenberg and de Haas,8 Presser and Gordon,13 Marshall and Fontijn,15 Michael,23 Zhu et al.24 and Yang et al.19 | ||
We will first consider the comparison of the present theoretical results with the experimental data. Table 1 shows the theoretical rate coefficients together with the average of the most reliable best-fits to the experimental data for both isotopic variants, which can be found in the ESI.†![[thin space (1/6-em)]](https://www.rsc.org/images/entities/char_2009.gif) 14,15,17,19,21,24 The most common three-parameter empirical expression of k(T) used over a wide range of temperatures is
14,15,17,19,21,24 The most common three-parameter empirical expression of k(T) used over a wide range of temperatures is
| k(T) = ATmexp(−Ea/T) | (24) |
| O + H2 | O + D2 | |||||||
|---|---|---|---|---|---|---|---|---|
| T(K) | k(T)QCT | k(T)RPMD | k(T)QM | k(T)exp | k(T)QCT | k(T)RPMD | k(T)QM | k(T)exp |
| 200 | 3.166(−23) | 1.398(−20) | 3.068(−20) | — | 2.093(−24) | 7.880(−23) | 1.293(−22) | — |
| 300 | 2.762(−19) | 2.661(−18) | 4.525(−18) | (9 ± 2)(−18) | 4.092(−20) | 1.425(−19) | 1.665(−19) | (5 ± 2)(−19) |
| 400 | 2.909(−17) | 9.543(−17) | 1.218(−16) | (2.4 ± 0.4)(−16) | 6.539(−18) | 1.236(−17) | 1.312(−17) | (3.1 ± 0.2)(−17) |
| 500 | 5.105(−16) | 1.046(−15) | 1.205(−15) | (1.9 ± 0.5)(−15) | 1.480(−16) | 2.196(−16) | 2.278(−16) | (5.1 ± 0.1)(−16) |
| 600 | 3.619(−15) | 5.907(−15) | 6.420(−15) | (9 ± 2)(−15) | 1.246(−15) | 1.594(−15) | 1.685(−15) | (3.1 ± 0.9)(−15) |
| 700 | 1.519(−14) | 2.187(−14) | 2.296(−14) | (2.7 ± 0.8)(−14) | 5.930(−15) | 7.224(−15) | 7.453(−15) | (1.3 ± 0.4)(−14) |
| 800 | 4.584(−14) | 6.062(−14) | 6.274(−14) | (7 ± 2)(−14) | 1.966(−14) | 2.275(−14) | 2.361(−14) | (3.9 ± 0.9)(−14) |
| 900 | 1.106(−13) | 1.388(−13) | 1.418(−13) | (1.5 ± 0.4)(−13) | 5.109(−14) | 5.627(−14) | 5.955(−14) | (1.0 ± 0.2)(−13) |
| 1000 | 2.279(−13) | 2.613(−13) | 2.792(−13) | (2.8 ± 0.7)(−13) | 1.117(−13) | 1.242(−13) | 1.275(−13) | (2.0 ± 0.4)(−13) |
| 1200 | 7.010(−13) | 7.792(−13) | 8.108(−13) | (9 ± 1)(−13) | 3.749(−13) | 4.052(−13) | 4.169(−13) | (7.0 ± 0.2)(−13) |
| 1500 | 2.300(−12) | 2.455(−12) | 2.544(−12) | (2.9 ± 0.2)(−12) | 1.336(−12) | 1.400(−12) | 1.459(−12) | (2.2 ± 0.2)(−12) |
| 1800 | 5.320(−12) | 5.700(−12) | 5.764(−12) | (6.9 ± 0.6)(−12) | 3.255(−12) | 3.461(−12) | 3.528(−12) | (5.4 ± 0.1)(−12) |
| 2000 | 8.244(−12) | 8.765(−12) | 8.931(−12) | (1.1 ± 0.2)(−11) | 5.164(−12) | 5.510(−12) | 5.627(−12) | (8.5 ± 0.2)(−12) |
| 2200 | 1.192(−11) | 1.254(−11) | 1.290(−11) | (1.4 ± 0.3)(−11) | 7.605(−12) | 8.172(−12) | 8.321(−12) | (1.24 ± 0.02)(−11) |
| 2500 | 1.881(−11) | 2.017(−11) | 2.040(−11) | (2.4 ± 0.5)(−11) | 1.225(−11) | 1.332(−11) | 1.351(−11) | (2.01 ± 0.03)(−11) |
A number of bibliographical expressions that fit the experimental measurements are listed in the ESI,† along with the temperature interval within which the expressions are valid. The most recent global expression for the k(T) of the reaction with H2 has been provided by Baulch et al.21 as the sum of two Arrhenius equations with four parameters, presumably covering the entire range 300–3300 K. It is important to note that the experimental points exhibit an average deviation of 15–20% from the equation presented in ref. 21. The experimental values shown in Table 1 have been obtained by averaging the different expressions at each temperature using the interval where each fit is assumed to be reliable. Fig. 9 presents the measurements of the rate coefficients for the O + H2 reaction together with the bibliographical best-fits in semi-log plots in order to illustrate the accuracy of the various global expressions. The inset to the figure displays the corresponding linear plots in the temperature range 1500–2500 K, where the QM k(T) is depicted as a red solid line.
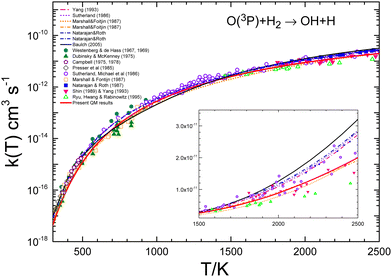 | ||
| Fig. 9 Comparison of individual measurements8–17,20 and global fits14–16,19 of rate coefficients for the O + H2 reaction. The global fit by Baulch et al.21 is shown as a black line. The inset shows the different data in the 1500–2500 K temperature range in the linear scale. As can be seen, the recommended global k(T) by Baulch et al. appears as an upper bound of the individual measurements in this temperature interval. The present QM rate coefficients are shown as a red solid line. | ||
The results given by Baulch's global expression are plotted a black solid line, and as can be seen, it represents almost an upper bound of the experimental points in this interval. This is due to the fact that the parameters utilised in this equation also fit the measurements16,18,73 at temperatures above 2500 K (see ref. 22). However, the double Arrhenius equation is not sufficiently flexible to encompass the entire range of temperatures. As illustrated in Fig. 7 and 9, the present QM results exhibit a slight underestimation of the experimental rate coefficients. The discrepancy between QM and experimental k(T) values is significant up to 500 K, although it never exceeds a factor of 2 even at the lowest temperatures (300 K). The degree of agreement between theory and calculations improves above 700 K.
The agreement between QM and experimental rate coefficients8,15,23,24 is worse for the reaction with D2, as can be seen in Fig. 8 and 10. These figures demonstrate that the QM results systematically underestimate the experimental determinations. In any case, according to Table 1, the difference is not greater than a factor of 3 at 300 K, decreasing to 1.5 at temperatures above 1800 K. For this isotopic variant, the deviations between the different experimental data sets is much smaller (as evidenced by the uncertainties associated with the experimental data), and the QM rate coefficients appear to represent the lower limit of the experimental results, as shown in the inset of Fig. 10.
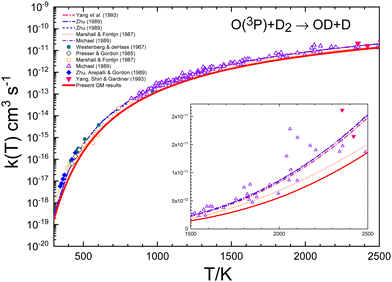 | ||
| Fig. 10 Comparison of individual measurements8,13,15,19,23,24 and global fits15,16,19,23 of rate coefficients for the O + D2 reaction. The inset shows a blow-up of the 1500–2500 K range. The red solid line represents the present QM k(T). | ||
With regard to the comparison of the predictions of the rate coefficients by the different theoretical approaches, it can be observed that the agreement between QM and RPMD k(T) above 500 K is very good for the reaction with H2, as shown in Fig. 7 and Table 1. In the worst case, 300–400 K, the discrepancy between the two approaches reaches up to a factor of 2. For the reaction with D2, as shown in Fig. 8 and Table 1, the agreement is even better, demonstrating the excellent performance of the RPMD method at temperatures near or above the crossover temperature. As expected, the QCT method predicts very low rate coefficients below 500 K due to the inability of the QCT results to account for tunnelling. At 300 K and 500 K there are differences by a factor of 16, and 2.4, respectively. Only at T > 800 K the respective rate coefficients are comparable. For the O + D2 reaction, the QCT k(T) are closer to the QM ones. At 300 K, there is a factor of 4 which decreases to 1.53 at 500 K. At T > 800 K, the discrepancy is only of a factor of 1.2 with respect to the QM k(T).
A crucial piece of information regarding the tunelling effect is revealed by the KIE. Fig. 11 displays the comparison of the present theoretical results along with the individual experimental data13,24 and the global fits by Marshall and Fontjin15 and Michael,23 whose expressions are given in the ESI.† The first observation is that the present theoretical KIE is above the global fits to the experimental data, which is not surprising given that the theoretically predicted rate coefficients for O + D2 are smaller than most of the experimental measurements, whilst they are closer for the O + H2 reaction, as can be seen in Fig. 7 and 8.
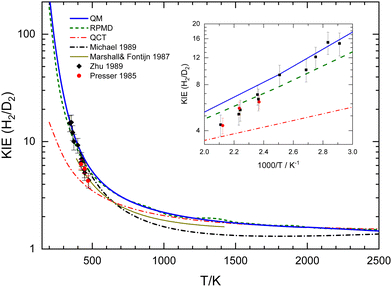 | ||
| Fig. 11 Comparison of experimental and calculated QM (blue solid line), RPMD (green short-dashed line), and QCT (red dashed–dotted line) kinetic isotopic effect (KIE). The black dashed–dotted line curve is the ratio of the experimental fits from ref. 23 in the 350–2500 K range. The solid dark-yellow line in the 390–1450 K range is the KIE given by Marshall and Fontjin.15 The black symbols are experimental data from Presser and Gordon13 and red symbols are from Zhu et al.24 | ||
The KIE predicted by the RPMD calculations is in close agreement with that obtained by the present accurate QM calculations. Only at temperatures below 500 K do the discrepancies become discernible, as shown in the inset of Fig. 11. Even at 300 K, below the crossover temperature for O + H2, the RPMD KIE is 19 to be compared with 27 as obtained in the QM calculations. As anticipated, the QCT KIE is considerably smaller than those derived from other theoretical approaches. Only above 1000 K does it begin to converge with the QM and RPMD KIEs; at 2500 K the KIE for the three approaches is 1.5. The good agreement between the QM and the RPMD KIEs lends credence to the latter method, which is more efficient than the fully converged QM calculations, especially at relatively high temperatures. The results presented in Fig. 7 and 8, along with the data from Table 1 provide a clear insight into the ability of the RPMD method to account for tunelling in stark contrast to the results of the QCT calculations.
Balakrishnan performed converged QM scattering calculations on the two PESs for the O + H2 reaction allowing him to calculate the rate coefficients up to 1000 K.33 Specifically, he used the GLDP fits of the 3A′′ and 3A′ PESs by Rogers et al.25 Balakrishnan assumed that the electronic partition function of the triplet oxygen atom has 9-fold degeneracy, resulting in eqn (16), which is only approximately valid above 1000 K. Once corrected by the appropriate partition function, a good agreement was found with the experimental results as well as with a semi-classical transition state theory.22 However, it should be emphasized that the barriers on the GLDP 3A′′ and 3A′ PESs are smaller than those predicted by the higher-level PESs using in the present work. Furthermore, the two PESs are not degenerate for the collinear arrangement. To the best of our knowledge, there are no previous accurate QM calculations of the rate coefficients for the O + D2 reaction to compare with the present results.
We have therefore come across two interesting findings: (i) the present state-of-the-art QM results on adiabatic PESs slightly underestimate the experimental results, especially at low temperatures; and (ii) the experimental results agree worse with the QM calculations for O + D2 than for O + H2. The fact that QM and RPMD rate coefficients are in good agreement with each other, especially for O + D2 rules out a systematic error in the QM calculations. As far as the electronic calculations are concerned, the PESs used in this work can be considered the most accurate one available in the literature. Therefore, the only plausible explanation for these findings is that calculations require the inclusion of the ISC between the triplet and singlet PESs in a non-adiabatic treatment.
As commented in the above text, there are only few studies that include the spin–orbit coupling with the singlet PES. The QCT-TSH calculations by Maiti and Schatz36 seemed to lead to larger cross sections for the O + H2 (v = 0, j = 0) reaction when the ICS was considered. More recent non-adiabatic TD QM by Zhao55 for the O + D2 (v = 0, j = 0) reaction concluded that the spin–orbit influence can be possibly ignored for the title reactions. An interesting aspect is that the non-adiabatic effect seemed to be slightly more important for the reaction with the D2 isotopic variant (see ref. 55). Unfortunately, the existing calculations are restricted to the ground rovibrational state and made use of the triplet PESs by Rogers et al.25 for both adiabatic and non-adiabatic calculations. Moreover, apart from their qualitative insight, the existing non-adiabatic results should be taken with some reservation since they are based on TSH or in the QM centrifugal sudden approximation. From the comparison between the bulk of the experimental rate coefficients and the current QM results, which can be considered as the most accurate ones carried out on the two separated triplet PESs, it can be concluded that the influence of ISC, although small, cannot be neglected, and that this effect is more important for the O + D2 reaction. A plausible qualitative explanation for the larger effect of the ISC in the latter reaction can be suggested by the MEP profiles shown in Fig. 1. As discussed in Section 2, the barriers on the two triplet PESs are broader and slightly higher for the O + D2 isotopic variant. As such, a more effective crossing with the singlet PES can be expected to result in slightly larger cross sections. To assess if ISC could be expected to be more important for O + D2 than for O + H2, we calculated the possible crossing of non-reactive trajectories to the singlet PES. We found that singlet–triplet crossing was important only at high temperatures (above 1000 K) and, especially for O + D2.
Accurate non-adiabatic calculations of the rate coefficients for the title reactions represent an enormous challenge. Even this type of QM calculation at fixed energies, including excited rovibrational states, appears to be a very costly computational endeavour. To the best of our knowledge, the existing non-adiabatic, accurate calculations (converged and including the Coriolis coupling between the different helicities) are limited to the initial rotational state j = 0. In any case, further non-adiabatic, more accurate calculations at fixed energies or using TD-WP for the O + H2 and O + D2 reactions would be valuable for assessing the effect of the ISC and would serve to explain the discrepancies between experimental rate coefficients and accurate adiabatic results.
Given the excellent general agreement between RPMD and rigorous QM results, a promising alternative could be the development of non-adiabatic RPMD. This was first presented by Shushkov et al.74 for a model system. They used TSH for the instantaneous transitions between PESs and adiabatic evolution of the ring-polymer beads on single PES. Application of this methodology to systems like the O + H2 reaction might shed light on the importance of the ISC at a much lower computational cost than QM calculations.
5 Conclusions
Extensive quasiclassical (QCT), quantum mechanical (QM) and ring polymer molecular dynamics (RPMD) calculations have been carried out for the reactions of O(3P) with H2 and D2 in a range of total energies between 0.37 and 2.5 eV. The QM calculations for the two isotopologues comprise all the total angular momenta and helicity projections necessary for convergence, allowing the determination of rate coefficients up to 2500 K. For the RPMD calculations tests were performed to select the number of beads to ensure convergence. QCT calculations were carried out by means of the cumulative reaction probabilities. The rate coefficient calculations were performed on the two adiabatic 3A′ and 3A′′ PESs, and the respective rate coefficients were combined using an electronic partition function that relates each PES to the O(3PJa) atomic states. No attempt has been made to include the spin–orbit crossing or the Renner–Teller coupling between the two PESs.Converged RPMD results calculated on the two PESs for the two isotopic variants served as a probe of the extent to which this method can tackle the tunnelling effect. Whereas the agreement between the QM and RPMD rate coefficients is almost perfect for the O + D2 reaction at temperatures above 300 K, for O + H2 the RPMD predictions are below the QM results at T < 400 K. These temperatures correspond to the respective crossover temperatures.
As a counterpoint, the k(T) predicted by QCT calculations lie well below the experimental or the QM results up to 1000 K. This is also evident in the comparison of the QCT and QM cumulative reaction probabilities at a given total angular momentum. As expected, the discrepancies are smaller for the reaction with D2 than for O + H2. If we attribute the discrepancy to tunelling through the barrier, it is found that this effect is also important for the O + D2 reaction up to 800 K although to a lesser extent than for the reaction with H2. In contrast, RPMD captures the tunelling effect almost completely for O + D2 above 300 K and for O + H2 above 400 K.
The present QM k(T), calculated adiabatically on both PESs and weighted with the electronic partition functions, slightly underestimate the best global fits of the experimental measurements. The discrepancies are rather small for the O + H2 reaction, in particular for temperatures above 500 K. Interestingly, the differences are larger for the reaction with D2. Considering that the ab initio PES are more accurate than any previous PESs, and that the RPMD and QM results are generally in excellent agreement, the most plausible explanation for the discrepancies with the experimental results is that a more accurate treatment of the reaction requires a non-adiabatic treatment that include the spin–orbit crossing of the singlet (1A′) and triplet (3A′ and 3A′′) PESs. Future non-adiabatic calculations for the title reactions will delimit the accuracy of the adiabatic calculations for reactions such as those studied in the present work.
Data availability
Hereunder, we let you know that all data contained in this submission are available.Conflicts of interest
There are no conflicts of interest to declare.Acknowledgements
The authors gratefully acknowledge grant PID2020-113147GA-I00 and PID2021-122839NB-I00 funded by Spanish Ministry of Science and Innovation (MCIN/AEI/10.13039/MCIN/AEI/10.13039/501100011033). A. V. acknowledges grant no. EDU/1508/2020 (Junta de Castilla y León and European Social Fund). A. Z. also acknowledges grants PID2019-107115GB-C21 and PID2021-122549NB-C21, and the COST Action CA21101 (COSY).Notes and references
- D. Fedele, S. Bruderer, E. F. van Dishoeck, J. Carr, G. J. Herczeg, C. Salyk, N. J. Evans, J. Bouwman, G. Meeus, T. Henning, J. Green, J. R. Najita and M. Güdel, Astron. Astrophys., 2013, 559, A77 Search PubMed.
- B. Godard, E. Falgarone and G. Pineau des Forêts, Astron. Astrophys., 2014, 570, A27 Search PubMed.
- R. A. Sultanov and N. Balakrishnan, Astrophys. J., 2005, 629, 305–310 CAS.
- A. Veselinova, M. Agúndez, J. R. Goicoechea, M. Menéndez, A. Zanchet, E. Verdasco, P. G. Jambrina and F. J. Aoiz, Astron. Astrophys., 2021, 648, A76 CrossRef CAS PubMed.
- M. Zannese, B. Tabone, E. Habart, J. R. Goicoechea, A. Zanchet, E. F. van Dishoeck, M. C. van Hemert, J. H. Black, A. G. G. M. Tielens, A. Veselinova, P. G. Jambrina, M. Menendez, E. Verdasco, F. J. Aoiz, L. Gonzalez-Sanchez, B. Trahin, E. Dartois, O. Berne, E. Peeters, J. He, A. Sidhu, R. Chown, I. Schroetter, D. V. D. Putte, A. Canin, F. Alarcon, A. Abergel, E. A. Bergin, J. Bernard-Salas, C. Boersma, E. Bron, J. Cami, D. Dicken, M. Elyajouri, A. Fuente, K. D. Gordon, L. Issa, C. Joblin, O. Kannavou, B. Khan, O. Lacinbala, D. Languignon, R. L. Gal, A. Maragkoudakis, R. Meshaka, Y. Okada, T. Onaka, S. Pasquini, M. W. Pound, M. Robberto, M. Rollig, B. Schefter, T. Schirmer, S. Vicente and M. G. Wolfire, Nat. Astron., 2024, 8, 577–586 CrossRef.
- M. A. A. Clyne, B. A. Thrush and R. G. W. Norrish, Proc. R. Soc. London, 1963, 275, 544–558 CAS.
- A. A. Westenberg and N. de Haas, J. Chem. Phys., 1967, 46, 490–501 CrossRef CAS.
- A. A. Westenberg and N. de Haas, J. Chem. Phys., 1967, 47, 4241–4246 CrossRef.
- A. A. Westenberg and N. de Haas, J. Chem. Phys., 1969, 50, 2512–2516 CrossRef CAS.
- R. N. Dubinsky and D. J. McKenney, Can. J. Chem., 1975, 53, 3531–3541 CrossRef CAS.
- I. M. Campbell and B. J. Handy, J. Chem. Soc., Faraday Trans. 1, 1975, 71, 2097–2106 RSC.
- I. M. Campbell and B. J. Handy, J. Chem. Soc., Faraday Trans. 1, 1978, 74, 316–325 RSC.
- N. Presser and R. J. Gordon, J. Chem. Phys., 1985, 82, 1291–1297 CrossRef CAS.
- J. W. Sutherland, J. V. Michael, A. N. Pirraglia, F. L. Nesbitt and R. B. Klemm, 21st Sym. Int. Combust. Inst., 1986, 929–941 Search PubMed.
- P. Marshall and A. Fontijn, J. Chem. Phys., 1987, 87, 6988–6994 CrossRef CAS.
- K. Natarajan and P. Roth, Combust. Flame, 1987, 70, 267–279 CrossRef CAS.
- K. S. Shin, N. Fujii and W. C. J. Gardiner, Chem. Phys. Lett., 1989, 161, 219 CrossRef CAS.
- D. F. Davidson and R. K. Hanson, Combust. Flame, 1990, 82, 445–447 CrossRef CAS.
- H. X. Yang, K. S. Shin and W. C. J. Gardiner, Chem. Phys. Lett., 1993, 207, 69–74 CrossRef CAS.
- S. O. Ryu, S. M. Hwang and M. J. Rabinowitz, Chem. Phys. Lett., 1995, 242, 279–284 CrossRef CAS.
- D. L. Baulch, C. T. Bowman, C. J. Cobos, R. A. Cox, T. Just, J. A. Kerr, M. J. Pilling, D. Stocker, J. Troe, W. Tsang, R. W. Walker and J. Warnatz, J. Phys. Chem. Ref. Data, 2005, 34, 757–1397 CrossRef CAS.
- T. L. Nguyen and J. F. Stanton, J. Phys. Chem. A, 2014, 118, 4918–4928 CrossRef CAS PubMed.
- J. V. Michael, J. Chem. Phys., 1989, 90, 189–198 CrossRef CAS.
- Y. F. Zhu, S. Arepalli and R. J. Gordon, J. Chem. Phys., 1989, 90, 183–188 CrossRef CAS.
- S. Rogers, D. Wang, A. Kuppermann and S. Walsh, J. Phys. Chem. A, 2000, 104, 2308 CrossRef CAS.
- J. Brandao, C. Mogo and B. C. Silva, J. Chem. Phys., 2004, 121, 8861–8868 CrossRef CAS PubMed.
- A. Zanchet, M. Menéndez, P. G. Jambrina and F. J. Aoiz, J. Chem. Phys., 2019, 151, 094307 CrossRef PubMed.
- D. J. Garton, T. K. Minton, B. Maiti, D. Troya and G. C. Schatz, J. Chem. Phys., 2003, 118, 1585–1588 CrossRef CAS.
- D. J. Garton, A. L. Brunsvold, T. K. Minton, D. Troya, B. Maiti and G. C. Schatz, J. Phys. Chem. A, 2006, 110, 1327–1341 CrossRef CAS PubMed.
- S. A. Lahankar, J. Zhang, K. G. McKendrick and T. K. Minton, Nat. Chem., 2013, 5, 315 CrossRef CAS PubMed.
- S. A. Lahankar, J. Zhang, T. K. Minton and K. G. McKendrick, J. Am. Chem. Soc., 2014, 136, 12371–12384 CrossRef CAS PubMed.
- N. Balakrishnan, J. Chem. Phys., 2003, 119, 195–199 CrossRef CAS.
- N. Balakrishnan, J. Chem. Phys., 2004, 121, 6346–6352 CrossRef CAS PubMed.
- P. F. Weck, N. Balakrishnan, J. Brandao, C. Rosa and W. Wang, J. Chem. Phys., 2006, 124, 074308 CrossRef CAS PubMed.
- M. Braunstein, S. Adler-Golden, B. Maiti and G. C. Schatz, J. Chem. Phys., 2004, 120, 4316–4322 CrossRef CAS PubMed.
- B. Maiti and G. C. Schatz, J. Chem. Phys., 2003, 119, 12360 CrossRef CAS.
- P. G. Jambrina, A. Zanchet, J. Aldegunde, M. Brouard and F. J. Aoiz, Nat. Commun., 2016, 7, 13439 CrossRef CAS PubMed.
- I. R. Craig and D. E. Manolopoulos, J. Chem. Phys., 2005, 123, 034102 CrossRef PubMed.
- R. Collepardo-Guevara, Y. V. Suleimanov and D. E. Manolopoulos, J. Chem. Phys., 2009, 130, 174713 CrossRef PubMed.
- Y. V. Suleimanov, R. Collepardo-Guevara and D. E. Manolopoulos, J. Chem. Phys., 2011, 134, 044131 CrossRef PubMed.
- Y. V. Suleimanov, J. W. Allen and W. H. Green, Comput. Phys. Commun., 2013, 184, 833–840 CrossRef CAS.
- R. Pérez de Tudela, Y. V. Suleimanov, J. O. Richardson, V. Sáez Rábanos, W. H. Green and F. J. Aoiz, J. Phys. Chem. Lett., 2014, 5, 4219–4224 CrossRef PubMed.
- Y. Li, Y. V. Suleimanov, W. H. Green and H. Guo, J. Phys. Chem. A, 2014, 118, 1989–1996 CrossRef CAS PubMed.
- Y. Suleimanov, F. J. Aoiz and H. Guo, J. Phys. Chem. A, 2016, 120, 8488–8502 CrossRef CAS PubMed.
- M. Menéndez, P. G. Jambrina, A. Zanchet, E. Verdasco, Y. V. Suleimanov and F. J. Aoiz, J. Phys. Chem. A, 2019, 123, 7920–7931 CrossRef PubMed.
- R. Pérez de Tudela, F. J. Aoiz, Y. V. Suleimanov and D. E. Manolopoulos, J. Phys. Chem. Lett., 2012, 3, 493–497 CrossRef PubMed.
- Y. Li, Y. V. Suleimanov, M. Yang, W. H. Green and H. Guo, J. Phys. Chem. Lett., 2013, 4, 48–52 CrossRef CAS PubMed.
- Y. V. Suleimanov, R. P. de Tudela, P. G. Jambrina, J. F. Castillo, V. Sáez-Rábanos, D. E. Manolopoulos and F. J. Aoiz, Phys. Chem. Chem. Phys., 2013, 15, 3655–3665 RSC.
- P. G. Jambrina, A. Zanchet, M. Menéndez, V. J. Herrero and F. J. Aoiz, Phys. Chem. Chem. Phys., 2019, 21, 25389–25396 RSC.
- A. Veselinova, M. Menéndez, L. González-Sánchez, A. Zanchet, F. J. Aoiz and P. G. Jambrina, Phys. Chem. Chem. Phys., 2024, 26, 6752–6762 RSC.
- G. A. Natanson, B. C. Garrett, T. N. Truong, T. Joseph and D. G. Truhlar, J. Chem. Phys., 1991, 94, 7875–7892 CrossRef CAS.
- J. Corchado, Y. Chuang, P. Fast, W.-P. Hu, Y.-P. Liu, G. Lynch, K. Nguyen, C. Jackels, A. Fernandez Ramos, B. Ellingson, B. Lynch, J. Zheng, V. Melissas, J. Villà, I. Rossi, E. Coitino, J. Pu, T. Albu, R. Steckler, B. Garrett, A. Isaacson and D. Truhlar, POLYRATE-v. 9.7, University of Minnesota, Minneapolis, Minnesota 55455, 2007 Search PubMed.
- J. O. Richardson and S. C. Althorpe, J. Chem. Phys., 2009, 131, 214106 CrossRef PubMed.
- M. R. Hoffman and G. C. Schatz, J. Chem. Phys., 2000, 113, 9456 CrossRef.
- J. Zhao, J. Chem. Phys., 2013, 138, 134309 CrossRef PubMed.
- A. F. Wagner, J. M. Bowman and L. B. Harding, J. Chem. Phys., 1985, 82, 1866–1872 CrossRef CAS.
- W. H. Miller, Acc. Chem. Res., 1976, 9, 306–312 CrossRef CAS.
- W. H. Miller, Acc. Chem. Res., 1993, 26, 174–181 CrossRef CAS.
- S. Chapman, B. C. Garrett and W. H. Miller, J. Chem. Phys., 1975, 63, 2710–2716 CrossRef CAS.
- D. C. Chatfield, R. S. Friedman, D. W. Schwenke and D. G. Truhlar, J. Chem. Phys., 1992, 96, 2414–2421 CrossRef CAS.
- D. C. Chatfield, S. L. Mielke, T. C. Allison and D. G. Truhlar, J. Chem. Phys., 2000, 112, 8387–8408 CrossRef CAS.
- F. J. Aoiz, M. Brouard, C. J. Eyles, J. F. Castillo and V. Sáez-Rábanos, J. Chem. Phys., 2006, 125, 144105 CrossRef CAS PubMed.
- P. G. Jambrina, M. Lara, M. Menéndez, J.-M. Launay and F. J. Aoiz, J. Chem. Phys., 2012, 137, 164314 CrossRef CAS PubMed.
- F. J. Aoiz, V. J. Herrero, M. P. de Miranda and V. Sáez-Rábanos, Phys. Chem. Chem. Phys., 2007, 9, 5367–5373 RSC.
- P. G. Jambrina, F. J. Aoiz, C. J. Eyles, V. J. Herrero and V. Sáez-Rábanos, J. Chem. Phys., 2009, 130, 184303 CrossRef CAS PubMed.
- C. H. Bennett, Molecular Dynamics and Transition State Theory: The Simulation of Infrequent Events, American Chemical Society, 1977, vol. 46, ch. 4, pp. 63–97 Search PubMed.
- D. Chandler, J. Chem. Phys., 1978, 68, 2959 CrossRef CAS.
- D. Skouteris, J. F. Castillo and D. E. Manolopoulos, Comput. Phys. Commun., 2000, 133, 128–135 CrossRef CAS.
- F. J. Aoiz, M. Brouard, C. J. Eyles, J. F. Castillo and V. Sáez-Rábanos, J. Chem. Phys., 2006, 125, 144105 CrossRef CAS PubMed.
- P. G. Jambrina, E. García, V. J. Herrero, V. Sáez-Rábanos and F. J. Aoiz, Phys. Chem. Chem. Phys., 2012, 14, 14596 RSC.
- J. Aldegunde, P. G. Jambrina, E. García, V. J. Herrero, V. Sáez-Rábanos and F. J. Aoiz, Mol. Phys., 2013, 21, 3169 CrossRef.
- D. Chatfield, S. Mielke, T. Allison and D. Truhlar, J. Chem. Phys., 2000, 112, 8387 CrossRef CAS.
- S. Javoy, V. Naudet, S. Abid and C. E. Paillard, Int. J. Chem. Kinet., 2000, 32, 686–695 CrossRef.
- P. Shushkov, R. Li and J. C. Tully, J. Chem. Phys., 2012, 137, 22A549 CrossRef PubMed.
Footnote |
| † Electronic supplementary information (ESI) available. See DOI: https://doi.org/10.1039/d4cp01711k |
| This journal is © the Owner Societies 2024 |

