Capillary detachment of a microparticle from a liquid–liquid interface†
Sazzadul A.
Rahat
 a,
Krishnaroop
Chaudhuri
 b and
Jonathan T.
Pham
 *ab
*ab
aMechanical and Materials Engineering, University of Cincinnati, Cincinnati, OH 45221, USA. E-mail: Jonathan.Pham@uc.edu
bChemical and Environmental Engineering, University of Cincinnati, Cincinnati, OH 45221, USA
First published on 1st August 2023
Abstract
The attachment and detachment of microparticles at a liquid–liquid interface are common in many material systems, from Pickering emulsions and colloidal assemblies to capillary suspensions. Properties of these systems rely on how the particles interact with the liquid–liquid interface, including the detachment process. In this study, we simultaneously measure the capillary detachment force of a microparticle from a liquid–liquid interface and visualize the shape of the meniscus by combining colloidal probe microscopy and confocal microscopy. The capillary behavior is studied on both untreated (hydrophilic) and fluorinated (hydrophobic) glass microparticles. The measured force data show good agreement with theoretical calculations based on the extracted geometric parameters from confocal images of the capillary bridge. It is also evident that contact line pinning is an important aspect of detachment for both untreated and fluorinated particles.
Introduction
Microscale particles at liquid–liquid interfaces are found in a host of applications, for example in Pickering emulsions,1–3 interfacial stabilizers,4–7 colloidal particle assemblies,8–15 and capillary suspensions.16–18 For Pickering emulsions, particles are used to stabilize two immiscible fluids, like oil and water.1 The stability of such emulsions relies on how the particles interact with the liquid–liquid interface, which can be important for applications in foods,19–21 personal care products,22,23 and oil recovery.24,25 Moreover, harnessing particles at liquid interfaces enables hierarchical design of functional materials, as well as organisms in nature.26–29 In the example of capillary suspensions, which are comprised of microparticles mixed with a major liquid and a minor liquid, capillary bridges of the minor liquid hold particles together to form a paste-like colloidal gel.16,18 The rheological properties of such materials are associated with microscopic capillary bridges that hold the particles together at these liquid–liquid interfaces.30–32 Additionally, microscale liquid–liquid and liquid–solid interfaces are important for wetting and adhesion of soft, multi-phase materials.33–35 Given the importance of microscale capillarity, it would be beneficial to understand microparticle capillary bridges and the associated forces at a liquid–liquid interface.The capillary force on a single particle is related to geometric parameters, like the contact angle and the position of the contact line, as well as material properties, like the interfacial tension.36,37 Although efforts in understanding the wetting and contact angles of particles at fluid interfaces have been of great interest, there are limited capabilities in visualization of a capillary bridge on a moving particle.38–40 For example, freeze casting and gel casting have been demonstrated as a useful method for determining contact angles of particles at high resolution.41,42 However, the particles are usually frozen in place so they can be imaged (e.g. by electron microscopy); therefore, this method is most useful for static cases. Colloidal probe microscopy can be employed to measure forces on a moving particle, although traditionally this method cannot image the contact.43–53 To address this issue, colloidal probe microscopy can be combined with simultaneous interferometry,54–56 total internal reflection fluorescence microscopy,57–59 fluorescence lifetime imaging microscopy60–62 or confocal microscopy.63–69 Schellenberger et al. employed colloidal probe and confocal microscopy to visualize a microparticle detaching from a glycerol–air interface, but did not consider liquid–liquid interfaces, nor the effect of particle surface energy.68 On the other hand, Anachkov et al. employed colloidal probe microscopy to measure the detachment of a particle from a liquid–liquid interface and with different particle surface energies.70 Force-displacement curves showed a reasonable fit to their theoretical model, but required some assumptions on contact angles since there was no image validation.
The primary goal here is to experimentally investigate how a microparticle comes into contact and detaches from a liquid–liquid interface. Using a combination of confocal microscopy and colloidal probe microscopy, we simultaneously measure the force during retraction and detachment while imaging the meniscus. Specifically, we use unmodified and fluorinated glass microparticles to study a glycerol–silicone oil interface. Confocal microscopy allows us to validate the force–distance data as well as image the geometric parameters of the liquid bridge. We show that the force data is reasonably fit to theoretical calculations based on the contact angles and interfacial tensions. Our results demonstrate that contact line pinning is an important aspect of the retraction process for both unmodified and fluorinated glass particles. In addition, we show that the forces during retraction are smaller for fluorinated particles, compared to an unmodified glass microsphere.
Results and discussion
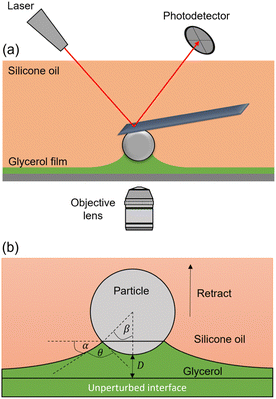
For our experiments, glycerol and silicone oil are chosen to serve as the liquid–liquid interface, since they are immiscible, do not readily evaporate, and spread well. To prepare our samples, glycerol is spin-coated onto a glass bottom Petri dish to a thickness of ∼3.5 μm. Afterward, ∼30–50 μL of silicone oil is deposited, which spreads and creates a glycerol–oil interface. To make sure that oil does not form any contact line forces along the cantilever, both the particle and cantilever should be submerged in oil. Therefore, we ensure that the oil layer thickness is larger than 15 μm (max retracting distance). To clearly visualize the interface in our confocal microscope, 5(6)-carboxyfluorescein dye is mixed with glycerol. For our colloidal probe, we use glass microspheres (radius, R = 5.7–7.3 μm), which are attached to stiff, tipless cantilevers. In addition, we investigate the effect of surface energy by using both unmodified (i.e. hydrophilic) and fluorosilane-modified (i.e. hydrophobic) colloidal probes.In a typical experiment, the particle is approached towards the glycerol surface at a speed of 2 μm s−1, while being imaged by a confocal microscope from the bottom (Fig. 1a). The cantilever is configured roughly parallel to the glycerol–oil interface, as in a standard colloidal probe setup. Note that the entire cantilever is submerged, such that no capillary forces arise from the surrounding oil. Upon contact with the glycerol film, a meniscus forms that leads to a capillary force on the microsphere, normal to the liquid–liquid interface. After a 5-second pause, the particle is withdrawn at a speed of 0.3 μm s−1. During this retraction step, the meniscus undergoes a continuous shape change until the liquid bridge disengages from the microsphere.
To fully describe the capillary behavior, it is useful to know the geometric parameters of the meniscus. With the ability to visualize the capillary bridge, we measure the relevant angles, allowing us to compare our experimental data to an established force equation. The capillary force exerted on the microsphere can be given by the following formula,36,37
F = 2πγR![[thin space (1/6-em)]](https://www.rsc.org/images/entities/i_char_2009.gif) sin sin![[thin space (1/6-em)]](https://www.rsc.org/images/entities/i_char_2009.gif) β β![[thin space (1/6-em)]](https://www.rsc.org/images/entities/i_char_2009.gif) sin sin![[thin space (1/6-em)]](https://www.rsc.org/images/entities/i_char_2009.gif) α = 2πγR α = 2πγR![[thin space (1/6-em)]](https://www.rsc.org/images/entities/i_char_2009.gif) sin sin![[thin space (1/6-em)]](https://www.rsc.org/images/entities/i_char_2009.gif) β β![[thin space (1/6-em)]](https://www.rsc.org/images/entities/i_char_2009.gif) sin(θ + β) sin(θ + β) | (1) |
For the case of a pinned contact line, β remains constant until a particular capillary force is overcome, while θ changes throughout the entire retraction process. Conversely, in the case of a fully sliding contact line, θ remains constant while the contact line moves with a varying β. The maximum capillary force is reached when βmax = (π − θ)/2; substituting this to eqn (1) leads to the following expression for maximum capillary force,36,37,68
 | (2) |
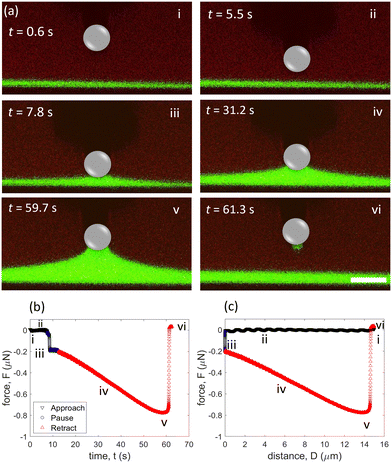
Due to the wettability, glycerol flows from the far field of film and tends to accumulate around the particle. Consequently, the local thickness of glycerol film increases during contact, as indicated by confocal imaging (Fig. 2a(iii)). Previously, it was demonstrated using a glycerol–air interface that a plateau in force (which suggests equilibrium) can be achieved by holding the particle stationary for ∼60 minutes before retracting. However, for such long dwell times, we find that it is not possible to detach the particle from the glycerol–oil interface at the maximum moving limit of our atomic force microscope. Hence, the particle is kept stationary for 5 s before retraction. Note that since we are able to measure the geometric parameters, we are not necessarily aiming to reach an equilibrium plateau in force. Hence, one of the unique aspects of our work is validating capillary force equations with measured contact line angles in real-time. During the retraction step, the meniscus extends steadily in the normal direction and reaches a maximum capillary force of ∼0.8 μN at D ≈14 μm and t ≈ 59.7 s (Fig. 2a(v), b(v) and c(v)). After this point, the capillary force begins to decrease and the meniscus ruptures around D ≈ 14.5 μm (Fig. 2a(vi), b(vi) and b(vi)). After breaking of the capillary bridge, the glycerol film returns to being flat and the force returns to zero. To confirm repeatability, we measured the capillary force three times after cleaning the colloidal probe with acetone and allowing sufficient time for drying (Fig. S1a, ESI†).
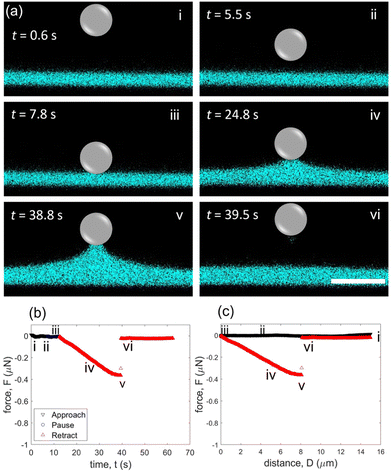
For the fluorinated (hydrophobic) case, a modified glass microsphere of similar size (R = 5.7 μm) is used as the colloidal probe. In a similar form to Fig. 2, representative confocal images are presented (Fig. 3a and Movie S2, ESI†) with the corresponding force–time (Fig. 3b) and force–distance (Fig. 3c) curves. The same experimental measurement conditions are maintained to test the fluorinated probes in comparison to the unmodified glass probes and also measured three times (Fig. S1b, ESI†). Like the unmodified glass experiments, the particle does not interact with the glycerol film for most of the approaching period (Fig. 3a(i) and (ii)). When the particle encounters the glycerol–oil interface, no jump in force is detected (Fig. 3b(iii) and c(iii)). This contrasts with the attractive jump in force observed in the unmodified, hydrophilic case at t ≈ 7.5 s (Fig. 2b(iii) and c(iii)). With the unmodified microparticle, a clear meniscus forms when it contacts the interface (Fig. 2a(iii)). Conversely, the formation of a meniscus is hardly visible in confocal imaging during the initial contact and stationary period for the fluorinated, hydrophobic case (Fig. 3a(iii)).
When the particle is retracted from the interface, an increase in capillary force is measured (Fig. 3b(iv) and c(iv)), demonstrating that an adhesive contact is made between the particle and the glycerol–oil interface. In confocal images, it is clear that the glycerol film is pulled up with the retracting particle, which is consistent with the increase in the measured capillary force (Fig. 3a(iv), b(iv) and c(iv)). The meniscus extends until a force of ∼0.36 μN is reached at D ≈ 7.7 μm and t ≈ 38.8 s (Fig. 3a(v), b(v) and c(v)). With continued extension, the particle detaches at D ≈ 8.1 μm and t ≈ 39.5 s (Fig. 3a(vi), b(vi) and 3c(vi)). Both the maximum force and the detachment distance are less than half of that of the unmodified case, illustrating that the fluorinated surface interaction leads to a reduction in maximum capillary force (Fig. 2c(v)vs.3c(v)).
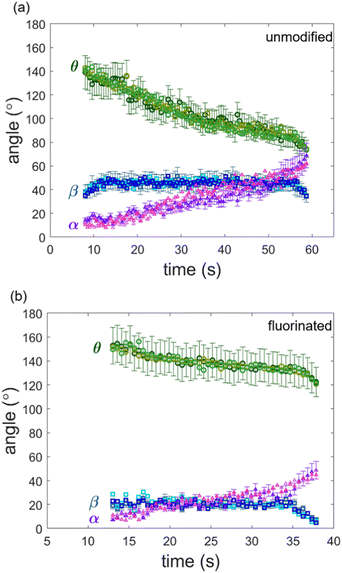
Oftentimes, it is necessary to make assumptions about the contact line behavior to compare experimental results to capillary force equations. For example, it is sometimes assumed that the contact line slides along the particle when it is being retracted.36,70,71 However, in our particular case, confocal images suggest that the contact line is pinned for both the unmodified and the fluorinated particles until the meniscus is on the verge of rupture. To gain more insight into the contact line motion, we plot the contact angle (θ), the position of the three-phase contact line (β), and position of interface relative to the horizontal (α) as a function of time for both cases (Fig. 4). For the unmodified glass sphere, θ remains relatively constant when the particle is stationary between t ≈ 7.5 s and t ≈ 12.5 s. However, when the particle starts to retract at t ≈ 12.5 s, there is a clear decrease in θ. Over the course of retraction, θ decreases from ∼132° to 74° and the value of α increases from ∼10° to 59°. On the other hand, β remains constant (∼45°) for most of the retraction period, confirming that the contact line is pinned on the timescale of the experiment. Therefore, it can be concluded that the capillary force is associated with changes in θ and α instead of a changing β, which would be the case if the contact line is fully sliding. Shortly before detachment, β starts to decrease, illustrating that the contact line starts sliding before detaching.
Recently, it was reported that contact line pinning is associated with the roughness of the particle, and a threshold RMS roughness for contact line pinning is ∼17 nm.79 To gain insight into the pinning mechanism that is observed in our experiments, we measure the roughness of the glass microspheres used as colloidal probes. These measurements indicate that the RMS roughness is below ∼10 nm. However, the maximum peak-to-valley values range between ∼30–100 nm (Fig. S2, ESI†). Hence, it is likely that the contact line pinning observed during capillary force measurement can be attributed to these peaks on the microsphere. Moreover, pinning might still occur at RMS roughness of under ∼10 nm, as opposed to true smooth surfaces with a roughness under ∼1 nm. Hence, our results suggest that pinning, likely due to roughness, governs most of the force–distance curve regardless of surface treatment.
To compare our results to the maximum force calculated from eqn (2), it is necessary use know the receding contact angle (θr). We considered the contact angle measured immediately before sliding occurs as the receding contact angle. From Fig. 4a, we see that β starts declining at t ≈ 55.5 s, which corresponds to θr ≈ 85°. In addition, it is also necessary to know the interfacial tension of the glycerol–oil interface; this is measured to be 32.5 ± 0.5 mN m−1 (Fig. S3, ESI†), which is consistent with literature.80 Substituting these values into eqn (2) predicts the maximum capillary force to be Fmax,unmodified = 0.81 μN, which is close to the measured maximum capillary force ∼0.8 μN.
For the fluorinated case, contact line pinning is also observed. The position of the contact line (β) remains relatively constant (∼20°) over most of the retraction, confirming a pinned contact line. The contact angle (θ) decreases from ∼151° at t ≈ 12.5 s to ∼120° at t ≈ 37.5 s and α increases from ∼10° to 50°. This decrease in θ is much less drastic than for the unmodified case. Here we find θr ≈ 83°. Hence, eqn (2) predicts Fmax,fluorinated = 0.65 μN. This is not very close to the measured value of ∼0.36 μN. Since the capillary bridge is less pronounced for the fluorinated case, measuring contact angles accurately is challenging, which may be one reason for this discrepancy in Fmax,fluorinated.
To gain more insight beyond the maximum force (eqn (2)), we also compare our results to eqn (1) throughout the entire detachment process. These calculations are made using the measured values for θ, β and γ throughout the experiment, and overlaid on experimental force–distance curves for both unmodified and fluorinated cases. As illustrated in Fig. 5(a), the calculated forces match the experimentally measured values rather well for the unmodified glass particle, confirming the validity of eqn (1). Note that within our short experimental time frame (∼60 s), the angles at the contact line are still able to describe the capillary force, and a long equilibrium time does not appear to be necessary. However, it is possible that much longer experiment times will lead to different results associated with glycerol flow. For the fluorinated case, the capillary force predictions follow the measured values for the majority of the experiment. However, the predicted capillary force does not fit the measured data near the detachment point, where the glycerol meniscus is on the verge of breaking (Fig. 5b); this is consistent with our discussion about the maximum capillary force above, Fmax. Discrepancies in this calculated force might be explained by an unstable bridge in the contact region. Upon reaching the maximum force near the detachment distance, the bridge can become unstable, leading to a rapid detachment. This fast separation event is likely not fully captured by our imaging due to limitations in our frame rate (∼2 images per second). This may affect the validity of our contact angle measurements by confocal microscopy in the fast detachment region; however, the force–distance data from AFM is not affected since the sampling rate is sufficiently fast. The lower surface energy of the fluorinated particle seems to accelerate the detachment process. This is supported by the measured force data (Fig. 5(b)), which indicates a very rapid detachment of the particle. In the unmodified case, there are many data points between the maximum force and the actual detachment point (when the force goes back to zero). In the fluorinated case, however, there are effectively only one or two data points that are captured. As a result, it is difficult to image the changes in angles.
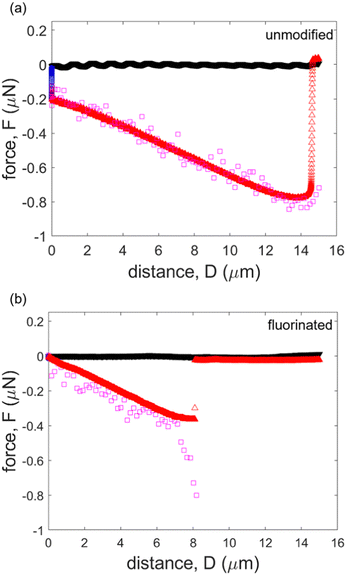 | ||
| Fig. 5 Comparison of theoretically calculated force and experimentally measured force. (a) Unmodified (hydrophilic) case, (b) fluorinated (hydrophobic) case. | ||
Conclusions
We experimentally investigate how a microparticle attaches and detaches from liquid–liquid interface. We measure the detachment force while simultaneously visualizing the liquid meniscus by combining confocal microscopy with colloidal probe microscopy. By using both unmodified and fluorinated glass microparticles, our results show that lower surface energy particles have a smaller capillary force. Confocal images demonstrate that the contact line is evidently pinned for both unmodified and fluorinated particles until the liquid bridge is on the verge of detachment. Hence, changes in capillary force are related to a change in contact angle of a pinned contact line. We validate an established force equation by using measured geometric parameters and interfacial tension. However, our theoretical calculations exhibit discrepancies for the fluorinated particle near the detachment point, likely because of a rapid detachment event that is not easily captured in confocal images.Experimental
Preparation of glycerol–oil interface
Characterization
Conflicts of interest
There are no conflicts to declare.Acknowledgements
This work was financially supported by an ACS Petroleum Research Fund Doctoral New Investigator award, grant number 61835-DNI5. The authors thank Justin Glover for useful discussions.References
- R. Van Hooghten, V. E. Blair, A. Vananroye, A. B. Schofield, J. Vermant and J. H. Thijssen, Langmuir, 2017, 33, 4107–4118 CrossRef PubMed.
- D. G. Ortiz, C. Pochat-Bohatier, J. Cambedouzou, M. Bechelany and P. Miele, Engineering, 2020, 6, 468–482 CrossRef CAS.
- T. Lu, H. Gou, H. Rao and G. Zhao, J. Environ. Chem. Eng., 2021, 9, 105941 CrossRef CAS.
- X. Fan, J. Yang, X. J. Loh and Z. Li, Macromol. Rapid Commun., 2019, 40, 1800203 CrossRef PubMed.
- S. Xie, S. Chen, Q. Zhu, X. Li, D. Wang, S. Shen, M. Jin, G. Zhou, Y. Zhu and L. Shui, ACS Appl. Mater. Interfaces, 2020, 12, 26374–26383 CrossRef CAS PubMed.
- J. H. Schröder, M. Doroshenko, D. Pirner, M. E. Mauer, B. Förster, V. Boyko, B. Reck, K. J. Roschmann, A. H. Müller and S. Förster, Polymer, 2016, 106, 208–217 CrossRef.
- Y. Lan, J. Choi, H. Li, Y. Jia, R. Huang, K. J. Stebe and D. Lee, Ind. Eng. Chem. Res., 2019, 58, 20961–20968 CrossRef CAS.
- W. Fei, Y. Gu and K. J. Bishop, Curr. Opin. Colloid Interface Sci., 2017, 32, 57–68 CrossRef CAS.
- E. Guzmán, F. Martínez-Pedrero, C. Calero, A. Maestro, F. Ortega and R. G. Rubio, Adv. Colloid Interface Sci., 2022, 102620 CrossRef PubMed.
- L. Isa, K. Kumar, M. Muller, J. Grolig, M. Textor and E. Reimhult, ACS Nano, 2010, 4, 5665–5670 CrossRef CAS PubMed.
- N. Ballard, A. D. Law and S. A. Bon, Soft Matter, 2019, 15, 1186–1199 RSC.
- Y. Brasse, V. Gupta, H. T. Schollbach, M. Karg, T. A. König and A. Fery, Adv. Mater. Interfaces, 2020, 7, 1901678 CrossRef CAS.
- K. Jayaprakash, U. Banerjee and A. Sen, J. Colloid Interface Sci., 2017, 493, 317–326 CrossRef CAS PubMed.
- L. Keal, C. E. Colosqui, R. H. Tromp and C. Monteux, Phys. Rev. Lett., 2018, 120, 208003 CrossRef CAS PubMed.
- T. Yin, D. Shin, J. Frechette, C. E. Colosqui and G. Drazer, Phys. Rev. Lett., 2018, 121, 238002 CrossRef CAS PubMed.
- E. Koos and N. Willenbacher, Science, 2011, 331, 897–900 CrossRef CAS PubMed.
- S. Bindgen, J. Allard and E. Koos, Curr. Opin. Colloid Interface Sci., 2022, 58, 101557 CrossRef CAS.
- F. Bossler and E. Koos, Langmuir, 2016, 32, 1489–1501 CrossRef CAS PubMed.
- B. S. Murray, Adv. Colloid Interface Sci., 2019, 271, 101990 CrossRef CAS PubMed.
- Z. Liu, D. J. McClements, A. Shi, L. Zhi, Y. Tian, B. Jiao, H. Liu and Q. Wang, Crit. Rev. Food Sci. Nutr., 2022, 1–12 Search PubMed.
- E. Dickinson, Curr. Opin. Colloid Interface Sci., 2010, 15, 40–49 CrossRef CAS.
- S. Peito, D. Peixoto, I. Ferreira-Faria, A. M. Martins, H. M. Ribeiro, F. Veiga, J. Marto and A. C. Santos, Int. J. Pharm., 2022, 121455 CrossRef CAS PubMed.
- A. Sarkar and E. Dickinson, Curr. Opin. Colloid Interface Sci., 2020, 49, 69–81 CrossRef CAS.
- Y. Kazemzadeh, S. E. Eshraghi, K. Kazemi, S. Sourani, M. Mehrabi and Y. Ahmadi, Ind. Eng. Chem. Res., 2015, 54, 233–239 CrossRef CAS.
- I. Nowrouzi, A. K. Manshad and A. H. Mohammadi, J. Mol. Liq., 2019, 292, 111348 CrossRef CAS.
- N. Pan, Appl. Phys. Rev., 2014, 1, 021302 Search PubMed.
- N. Vogel, M. Retsch, C.-A. Fustin, A. Del Campo and U. Jonas, Chem. Rev., 2015, 115, 6265–6311 CrossRef CAS PubMed.
- A. Spatafora-Salazar, D. M. Lobmeyer, L. H. Cunha, K. Joshi and S. L. Biswal, Soft Matter, 2021, 17, 1120–1155 RSC.
- J. Aizenberg, J. C. Weaver, M. S. Thanawala, V. C. Sundar, D. E. Morse and P. Fratzl, Science, 2005, 309, 275–278 CrossRef CAS PubMed.
- E. Koos, J. Johannsmeier, L. Schwebler and N. Willenbacher, Soft Matter, 2012, 8, 6620–6628 RSC.
- T. Domenech and S. S. Velankar, Soft Matter, 2015, 11, 1500–1516 RSC.
- S. Bindgen, F. Bossler, J. Allard and E. Koos, Soft Matter, 2020, 16, 8380–8393 RSC.
- K. E. Jensen, R. Sarfati, R. W. Style, R. Boltyanskiy, A. Chakrabarti, M. K. Chaudhury and E. R. Dufresne, Proc. Natl. Acad. Sci. U. S. A., 2015, 112, 14490–14494 CrossRef CAS PubMed.
- Z. Cai, A. Skabeev, S. Morozova and J. T. Pham, Commun. Mater., 2021, 2, 21 CrossRef CAS.
- L. Hauer, Z. Cai, A. Skabeev, D. Vollmer and J. T. Pham, Phys. Rev. Lett., 2023, 130, 058205 CrossRef CAS PubMed.
- A. Scheludko and D. Nikolov, Colloid Polym. Sci., 1975, 253, 396–403 CrossRef.
- A. Scheludko, B. Toshev and D. Bojadjiev, J. Chem. Soc., Faraday Trans. 1, 1976, 72, 2815–2828 RSC.
- M. Zanini and L. Isa, J. Phys.: Condens. Matter, 2016, 28, 313002 CrossRef PubMed.
- N. Vogel, J. Ally, K. Bley, M. Kappl, K. Landfester and C. K. Weiss, Nanoscale, 2014, 6, 6879–6885 RSC.
- N. Arai, S. Watanabe, M. T. Miyahara, R. Yamamoto, U. Hampel and G. Lecrivain, Soft Matter, 2020, 16, 695–702 RSC.
- V. N. Paunov, Langmuir, 2003, 19, 7970–7976 CrossRef CAS.
- L. Isa, F. Lucas, R. Wepf and E. Reimhult, Nat. Commun., 2011, 2, 438 CrossRef PubMed.
- C. Shi, L. Xie, L. Zhang, X. Lu and H. Zeng, J. Colloid Interface Sci., 2020, 558, 173–181 CrossRef PubMed.
- J. Bowen, D. Cheneler, J. W. Andrews, A. R. Avery, Z. Zhang, M. C. Ward and M. J. Adams, Langmuir, 2011, 27, 11489–11500 CrossRef CAS PubMed.
- D. Yang, X. Peng, Q. Peng, T. Wang, C. Qiao, Z. Zhao, L. Gong, Y. Liu, H. Zhang and H. Zeng, Engineering, 2022, 18, 49–61 CrossRef CAS.
- L. Xie, J. Wang, Q. Lu, W. Hu, D. Yang, C. Qiao, X. Peng, Q. Peng, T. Wang and W. Sun, Adv. Colloid Interface Sci., 2021, 295, 102491 CrossRef CAS PubMed.
- L. Xie, X. Cui, L. Gong, J. Chen and H. Zeng, Langmuir, 2020, 36, 2985–3003 CrossRef CAS PubMed.
- M. Pan, L. Gong, L. Xiang, W. Yang, W. Wang, L. Zhang, W. Hu, L. Han and H. Zeng, J. Membr. Sci., 2021, 625, 119140 CrossRef CAS.
- X. Mao, D. Yang, L. Xie, Q. Liu, T. Tang, H. Zhang and H. Zeng, J. Phys. Chem. B, 2021, 125, 7320–7331 CrossRef CAS PubMed.
- M. P. Neubauer, M. Poehlmann and A. Fery, Adv. Colloid Interface Sci., 2014, 207, 65–80 CrossRef CAS PubMed.
- N. Yang, C. Su, Y. Zhang, J. Jia, R. L. Leheny, K. Nishinari, Y. Fang and G. O. Phillips, J. Colloid Interface Sci., 2020, 570, 362–374 CrossRef CAS PubMed.
- W. A. Ducker, T. J. Senden and R. M. Pashley, Nature, 1991, 353, 239–241 CrossRef CAS.
- W. A. Ducker, T. J. Senden and R. M. Pashley, Langmuir, 1992, 8, 1831–1836 CrossRef CAS.
- J. K. Ferri, P. Carl, N. Gorevski, T. P. Russell, Q. Wang, A. Böker and A. Fery, Soft Matter, 2008, 4, 2259–2266 RSC.
- J. Erath, S. Schmidt and A. Fery, Soft Matter, 2010, 6, 1432–1437 RSC.
- S. M. Flores and J. L. Toca-Herrera, Nanoscale, 2009, 1, 40–49 RSC.
- A. B. Mathur, G. A. Truskey and W. M. Reichert, Biophys. J., 2000, 78, 1725–1735 CrossRef CAS PubMed.
- A. E. Brown, A. Hategan, D. Safer, Y. E. Goldman and D. E. Discher, Biophys. J., 2009, 96, 1952–1960 CrossRef CAS PubMed.
- A. Vial, C. Taveneau, L. Costa, B. Chauvin, H. Nasrallah, C. Godefroy, P. Dosset, H. Isambert, K. X. Ngo and S. Mangenot, Nanoscale, 2021, 13, 12484–12493 RSC.
- C. Poudel, I. Mela and C. F. Kaminski, Methods Appl. Fluoresc., 2020, 8, 024005 CrossRef CAS.
- N. Hain, S. Handschuh-Wang, D. Wesner, S. I. Druzhinin and H. Schönherr, J. Colloid Interface Sci., 2019, 547, 162–170 CrossRef CAS PubMed.
- T. F. Fernandes, O. Saavedra-Villanueva, E. Margeat, P.-E. Milhiet and L. Costa, Sci. Rep., 2020, 10, 7098 CrossRef CAS PubMed.
- R. F. Tabor, H. Lockie, D. Mair, R. Manica, D. Y. Chan, F. Grieser and R. R. Dagastine, J. Phys. Chem. Lett., 2011, 2, 961–965 CrossRef CAS.
- M. Eriksson, M. Tuominen, M. Jarn, P. M. Claesson, V. Wallqvist, H.-J. R. Butt, D. Vollmer, M. Kappl, J. Schoelkopf and P. A. Gane, ACS Nano, 2019, 13, 2246–2252 CAS.
- S. Mettu, Q. Ye, M. Zhou, R. Dagastine and M. Ashokkumar, Soft Matter, 2018, 14, 3192–3201 RSC.
- J. T. Pham, F. Schellenberger, M. Kappl and H.-J. Butt, Phys. Rev. Mater., 2017, 1, 015602 CrossRef.
- J. D. Glover and J. T. Pham, Soft Matter, 2020, 16, 5812–5818 RSC.
- F. Schellenberger, P. Papadopoulos, M. Kappl, S. A. L. Weber, D. Vollmer and H. J. Butt, Phys. Rev. Lett., 2018, 121, 048002 CrossRef CAS PubMed.
- J. D. Glover, X. Yang, R. Long and J. T. Pham, Nat. Commun., 2023, 14, 2362 CrossRef CAS PubMed.
- S. E. Anachkov, I. Lesov, M. Zanini, P. A. Kralchevsky, N. D. Denkov and L. Isa, Soft Matter, 2016, 12, 7632–7643 RSC.
- Y. Tang and S. Cheng, Phys. Rev. E, 2018, 98, 032802 CrossRef CAS.
- Q.-X. Huang, Y.-T. Fei, S. Gonda, I. Misumi, O. Sato, T. Keem and T. Kurosawa, Meas. Sci. Technol., 2006, 17, 1417–1423 CrossRef CAS.
- S. Moreno-Flores, Microsc. Res. Tech., 2016, 79, 1045–1049 CrossRef PubMed.
- N. Cross and R. Picknett, Trans. Faraday Soc., 1963, 59, 846–855 RSC.
- T. Gillespie and W. Settineri, J. Colloid Interface Sci., 1967, 24, 199–202 CrossRef CAS.
- H.-J. Butt, W. J. P. Barnes, A. Del Campo, M. Kappl and F. Schönfeld, Soft Matter, 2010, 6, 5930–5936 RSC.
- H.-J. Butt and M. Kappl, Adv. Colloid Interface Sci., 2009, 146, 48–60 CrossRef CAS PubMed.
- J. Ally, E. Vittorias, A. Amirfazli, M. Kappl, E. Bonaccurso, C. E. McNamee and H.-J. R. Butt, Langmuir, 2010, 26, 11797–11803 CrossRef CAS PubMed.
- M. Zanini, I. Lesov, E. Marini, C.-P. Hsu, C. Marschelke, A. Synytska, S. E. Anachkov and L. Isa, Langmuir, 2018, 34, 4861–4873 CrossRef CAS PubMed.
- A. G. Banpurkar, K. P. Nichols and F. Mugele, Langmuir, 2008, 24, 10549–10551 CrossRef CAS PubMed.
- C. A. Schneider, W. S. Rasband and K. W. Eliceiri, Nat. Methods, 2012, 9, 671–675 CrossRef CAS PubMed.
- J. D. Berry, M. J. Neeson, R. R. Dagastine, D. Y. Chan and R. F. Tabor, J. Colloid Interface Sci., 2015, 454, 226–237 CrossRef CAS PubMed.
- E. Huang, A. Skoufis, T. Denning, J. Qi, R. R. Dagastine, R. F. Tabor and J. D. Berry, J. Open Source Software, 2021, 6, 2604 CrossRef.
Footnote |
| † Electronic supplementary information (ESI) available. See DOI: https://doi.org/10.1039/d3sm00470h |
| This journal is © The Royal Society of Chemistry 2023 |

