
 Open Access Article
 This Open Access Article is licensed under a Creative Commons Attribution-Non Commercial 3.0 Unported Licence
Homogeneous Fe2O3 coatings on carbon nanotube structures for supercapacitors†
Pengmei
Yu
 a,
Mariona
Coll
*a,
Roger
Amade
bc,
Islam
Alshaikh
bc,
Fernando
Pantoja-Suárez
bcd,
Esther
Pascual
bc,
José Luís
Andújar
bc and
Enric Bertran
Serra
bc
a,
Mariona
Coll
*a,
Roger
Amade
bc,
Islam
Alshaikh
bc,
Fernando
Pantoja-Suárez
bcd,
Esther
Pascual
bc,
José Luís
Andújar
bc and
Enric Bertran
Serra
bc
aInstitut de Ciència de Materials de Barcelona (ICMAB-CSIC), Campus de la UAB, 08193 Bellaterra, Barcelona, Spain. E-mail: mcoll@icmab.es; Tel: +34 935801853
bDepartament de Física Aplicada, Universitat de Barcelona, Martí i Franquès 1, 08028 Barcelona, Spain
cInstitute of Nanoscience and Nanotechnology (IN2UB), Universitat de Barcelona, Avda. Joan XXIII, s/n, 08028 Barcelona, Spain
dDepartamento de Materiales, Facultad de Ingeniería Mecánica, Escuela Politécnica Nacional, Ladrón de Guevara, E11-253, Quito, Ecuador
First published on 26th February 2020
Abstract
The combination of carbon nanotubes with transition metal oxides can exhibit complementary charge storage properties for use as electrode materials for next generation energy storage devices. One of the biggest challenges so far is to synthesize homogeneous oxide coatings on carbon nanotube structures preserving their integrity. Here we present the formation of conformal coatings of Fe2O3 on vertically aligned carbon nanotubes obtained by atomic layer deposition. We investigate the effect of pristine, nitrogen plasma and water plasma treated carbon nanotube surfaces on the ALD-growth of Fe2O3 using ferrocene and ozone precursors. The surface morphology, coating thickness, microstructure and surface chemistry of iron oxide–carbon nanotube composites and their ultimate influence on the electrochemical behavior of the composites are evaluated. The most effective surface functionalization is that achieved by H2O plasma treatment, whereas untreated carbon nanotubes, despite the lack of active sites in the starting pristine surface, can be coated with an inhomogeneous Fe2O3 film.
1. Introduction
Miniaturized and powerful electrochemical energy storage systems have been intensively studied because of the increasing need for wireless devices and sensor networks for Internet of Things applications.1–3 For any electrochemical energy storage devices, such as supercapacitors or rechargeable batteries, electrode materials are key factors for achieving high performances. Electrodes made of carbon nanotubes (CNTs) are commonly studied owing to their outstanding conductive ability, large interfacial surface area and structural and mechanical robustness.4,5 In particular, electrodes of vertically aligned carbon nanotubes (VACNTs) present a well-ordered nanostructure that allows exposing most of their surface area to the electrolyte and may serve as scaffolds for the deposition of electrochemically active oxides. The charge storage capacity of CNTs is known to increase after performing plasma treatment of their surface,6–8 which introduces surface functional groups and increases both the number of defects and wettability of the electrodes. However, their low theoretical capacity limits their further applications. The synthesis of composite carbon materials with high capacitance transition metal oxides (TMOs) could show a synergistic effect and fulfill the basic requirements for next-generation energy storage devices.2,9 Typical TMOs examined in combination with carbonaceous electrodes are TiO2,10 V2O5,11 MoO3−x,12 MnO2,13 Fe2O3,14–17 Fe3O4,18,19 Co3O4,20,21 and RuO2.22–24 Among them, iron oxide is broadly explored as a nontoxic, inexpensive and abundant material with high theoretical capacitance.25,26 Using a variety of deposition techniques sophisticated Fe2O3 nanostructures have been successfully fabricated including nanoparticles,16–18 nanorods,15,16 ribbons,14 sandwich-like sheets19 and 3D ovoid architectures.16Importantly, the performance of these energy storage devices depends on the thickness and conformality of the TMO coating. Therefore, atomic layer deposition (ALD) provides an attractive way to synthesize such structures. ALD is a well-established thin film deposition technique in which the alternate pulsing of gas-phase precursors reacting in a self-limiting manner with the active sites of the substrate surface allows the fabrication of ultrathin, pin-hole free and highly conformal coatings on complex nanometric structures at relatively low temperature, thus outmatching any other existing thin film deposition technique.27,28
Considering the inertness of the CNT surface, careful interface engineering is called for in order to create binding sites to promote the nucleation and growth of ALD-transition metal oxides. Several strategies have been developed for this purpose. For example, non-covalent modifications using dodecyl sulfate treatment29 or alternating exposure to nitrogen dioxide gas30 have proved successful for coaxially coating single-walled carbon nanotubes with Al2O3. Acid and oxidative plasma treatments and nitrogen doping can also generate functional groups to tailor the shape and distribution of the TMO coating.31–33 The performance of these composites could be further improved by better understanding the role of the functional groups present in the CNT surface as anchoring sites for the ALD process and their effect on the electrochemical properties of the composites.
In this work, we investigated the effect of pristine, water plasma and nitrogen plasma treated CNT surfaces on the ALD-growth of Fe2O3 using ferrocene and ozone precursors to prepare heterostructural one dimensional coaxial nanotubes with two different iron oxide thicknesses, 6 nm and 30 nm. We compared the coating surface morphology, conformality and induced chemical changes as a function of the surface treatment. We also evaluated their effects on the electrochemical performance.
2. Results and discussion
2.1. Morphological, structural and compositional characterization
Typical surface morphologies of untreated CNTs (utCNTs), water plasma CNTs (wpCNTs) and nitrogen plasma CNTs (npCNTs) before and after 6 nm and 30 nm iron oxide coating are shown in Fig. 1.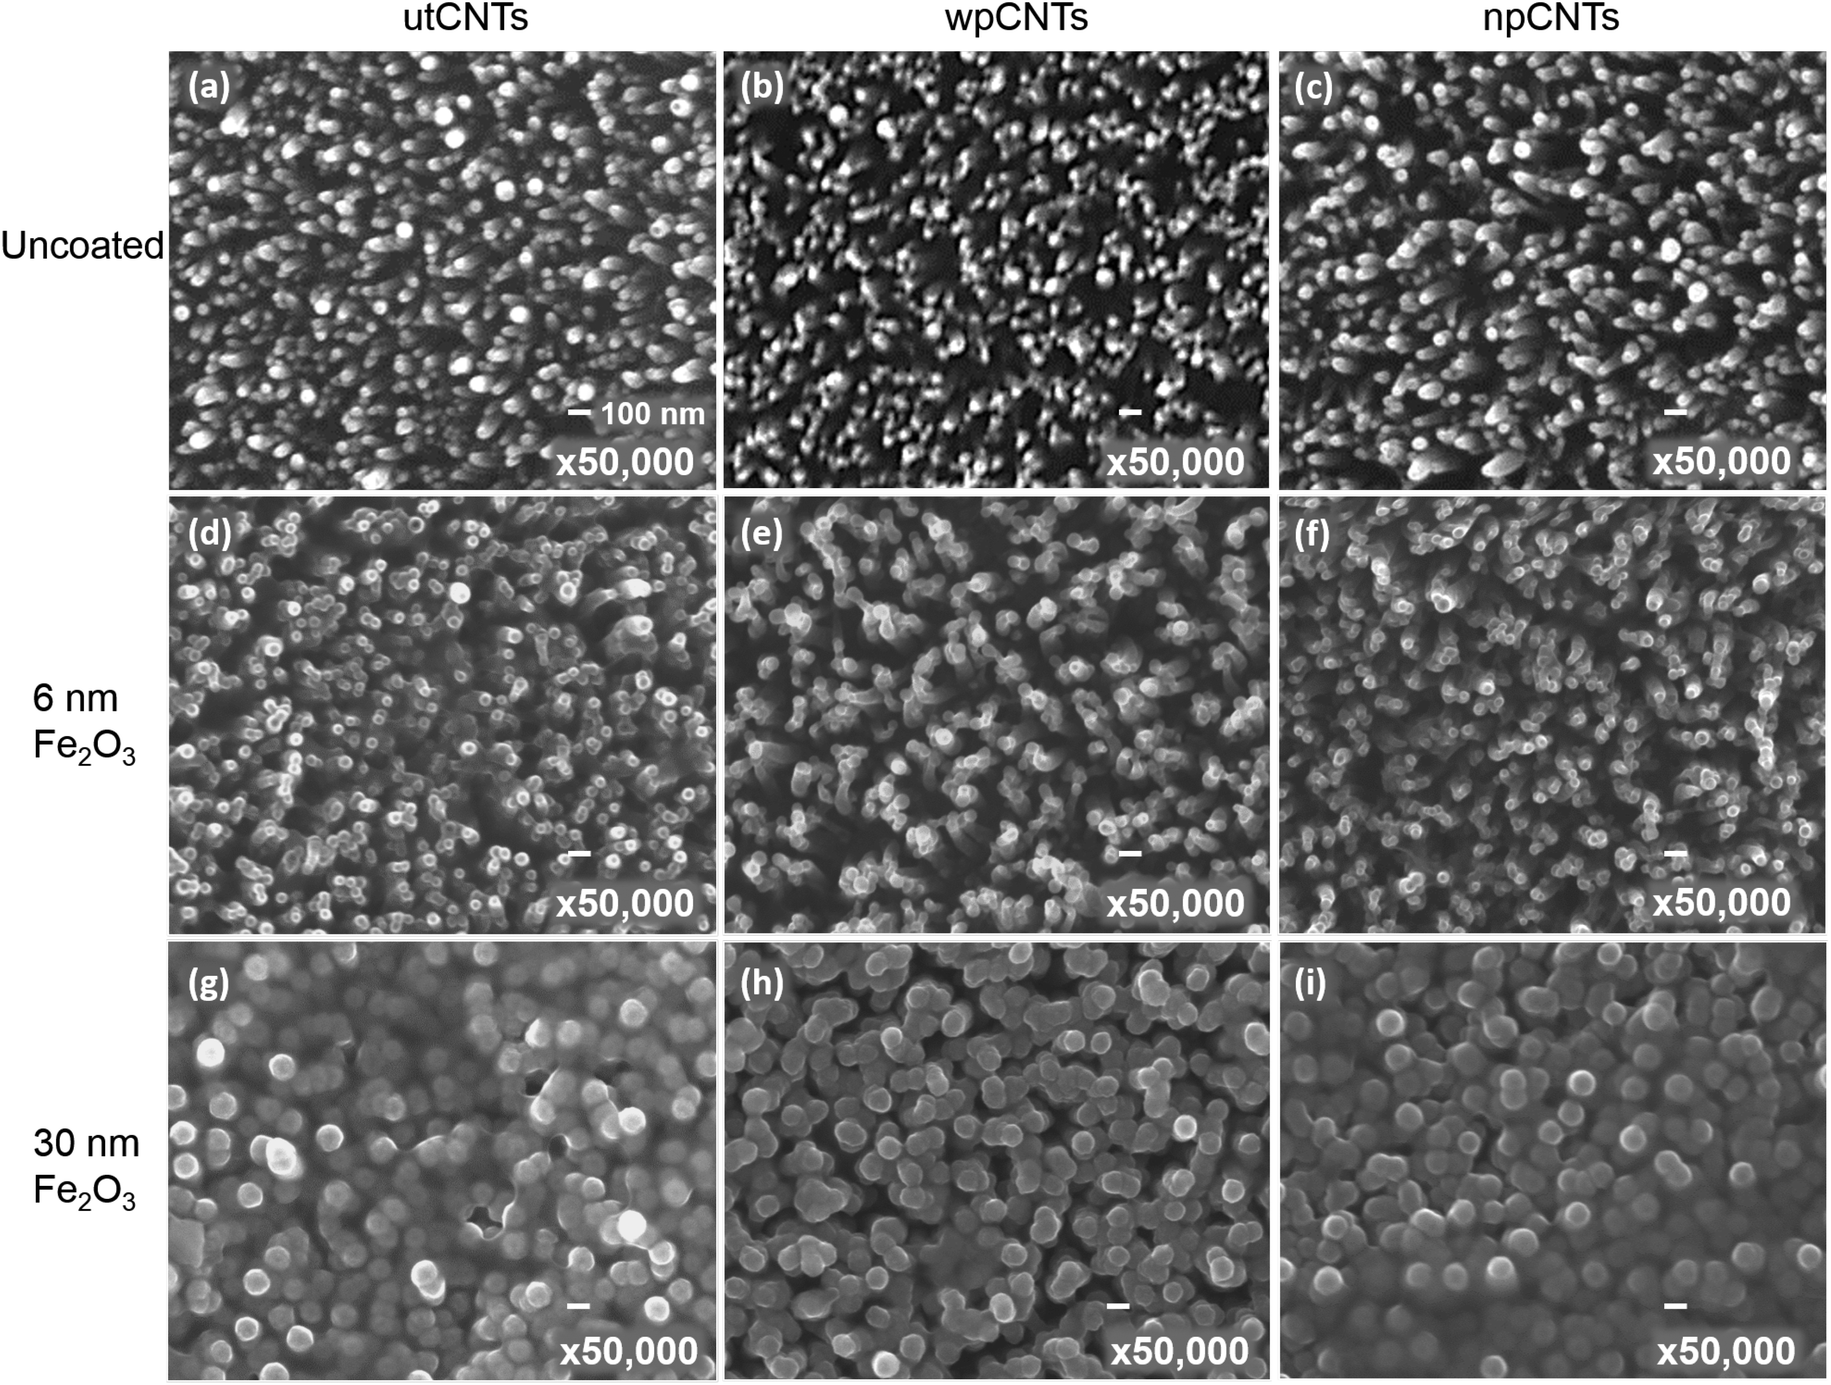 | ||
| Fig. 1 SEM micrographs of pristine, 6 nm and 30 nm ALD Fe2O3 coated untreated (utCNTs), water plasma treated (wpCNTs) and nitrogen plasma treated carbon nanotubes (npCNTs). The bar scale corresponds to 100 nm in all the images. | ||
The uncoated CNTs preserve the vertical alignment regardless of the plasma treatment although the tips of the wpCNTs tend to be narrower and the length decreased, Fig. 1(a–c), as previously reported by Hussain et al.7 Upon 6 nm Fe2O3 coating, the diameter of the CNTs increases and the Fe2O3 composites of plasma treated CNTs are less aggregated than the untreated ones Fig. 1(d–f). For the sake of clarity, these two scenarios are schematized in Fig. 2(a) and (b). Fig. 2(a) illustrates the structure of conformally coated and discrete CNTs and Fig. 2(b) presents the coated CNTs that show aggregation in some areas as a result of the inhomogeneous Fe2O3 coating. For 30 nm coating, the distance between neighbouring CNTs is further decreased and the CNTs remain intact, in good agreement with the formation of a thicker coating, Fig. 1(g–i). An obvious difference in the 30 nm series is that Fe2O3@utCNTs and Fe2O3@npCNTs present a continuous film on top of the CNTs, which is schematized in Fig. 2(c), whereas for Fe2O3@wpCNTs, the presence of a continuous film is not so evident.
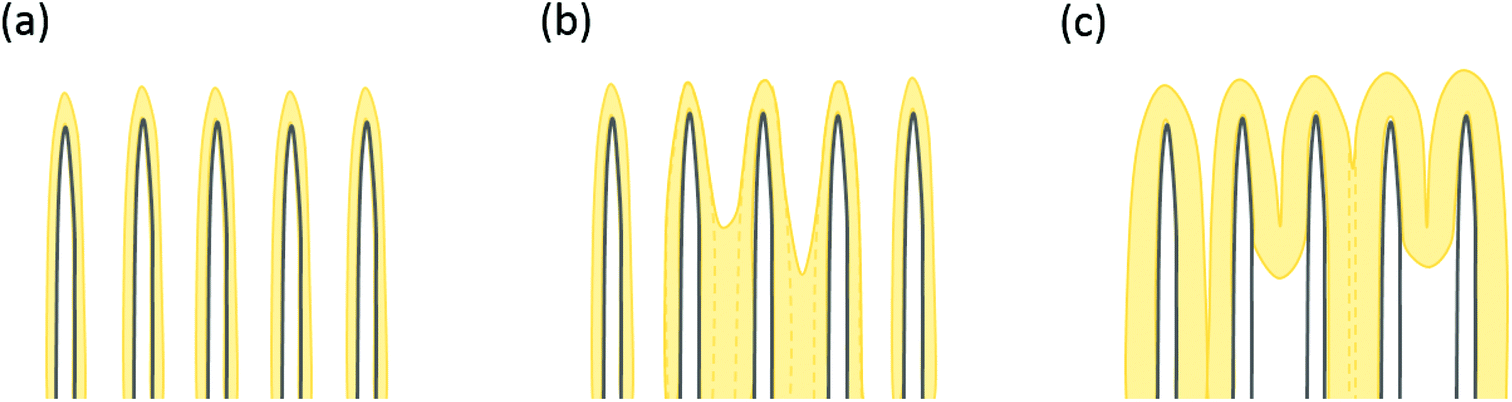 | ||
| Fig. 2 Illustration of different ALD coatings of Fe2O3 on the CNT surface: (a) conformal coating; (b) partial conformal coating and partial CNT aggregation; (c) thicker and non-conformal coating on CNTs. | ||
From this surface morphology analysis it is found that iron oxide coating took place regardless of the surface functionalization of the CNT surface although the deposition on the untreated CNTs is less homogeneous. Also, these results contrast with previous studies on CNT@Fe2O3 prepared via ALD from ferrocene and oxygen which claimed that prior chemical functionalization was needed to anchor the Fe2O3 film.32 We attribute this difference to the use of a more powerful oxidant source than oxygen (i.e. ozone) capable of creating active sites during the ALD process, as will be discussed later.
To further investigate the film homogeneity and crystallinity of the CNTs, TEM images were acquired for pristine utCNTs, 6 nm and 30 nm iron oxide coatings and elemental analysis was performed. Fig. 3(a) shows the microstructure of a pristine utCNT covered with amorphous C. The inner membranes with a bamboo-like structure can also be identified as darker areas inside the tube. Fig. 3(b) shows a uniform and continuous film of 6 nm thickness on the wpCNTs. Line profile elemental analysis performed across the coated wpCNTs (identified as a green line in Fig. 3(b)) shows that Fe and O are mostly located in the shell of the CNTs, whereas C dominates in the core of the structure, confirming the conformal coating of the iron oxide layer, Fig. 3(c). Finally, higher magnification TEM images of the 6 nm Fe2O3 coating on the wpCNTs allowed the identification of the interplanar spacing of iron oxide (d ∼ 0.269 nm), indicating the formation of the α-Fe2O3 hematite phase. Also, crystalline iron oxide coexists with isolated areas of amorphous iron oxide. The microstructure of 6 nm Fe2O3@npCNTs is shown in Fig. 4(a). The thickness of the coating is in good agreement with the expected value from the ALD cycles and also reveals a conformal coating. The 30 nm coatings on the utCNTs and on wpCNTs are compared in Fig. 4(b) and (c), respectively. Fe2O3@wpCNTs exhibits a cleaner morphology than Fe2O3@utCNTs. This difference is attributed to the fact that water plasma treatment removed amorphous carbon and it is possible to see graphene membranes inside the nanotubes. Also, the remaining Fe catalyst in the CNT preparation process can be observed on the tips of the nanotubes.7 Elemental mapping of the 30 nm coatings further confirms the conformal deposition of iron oxide in the thicker films as well, see ESI Fig. S1.†
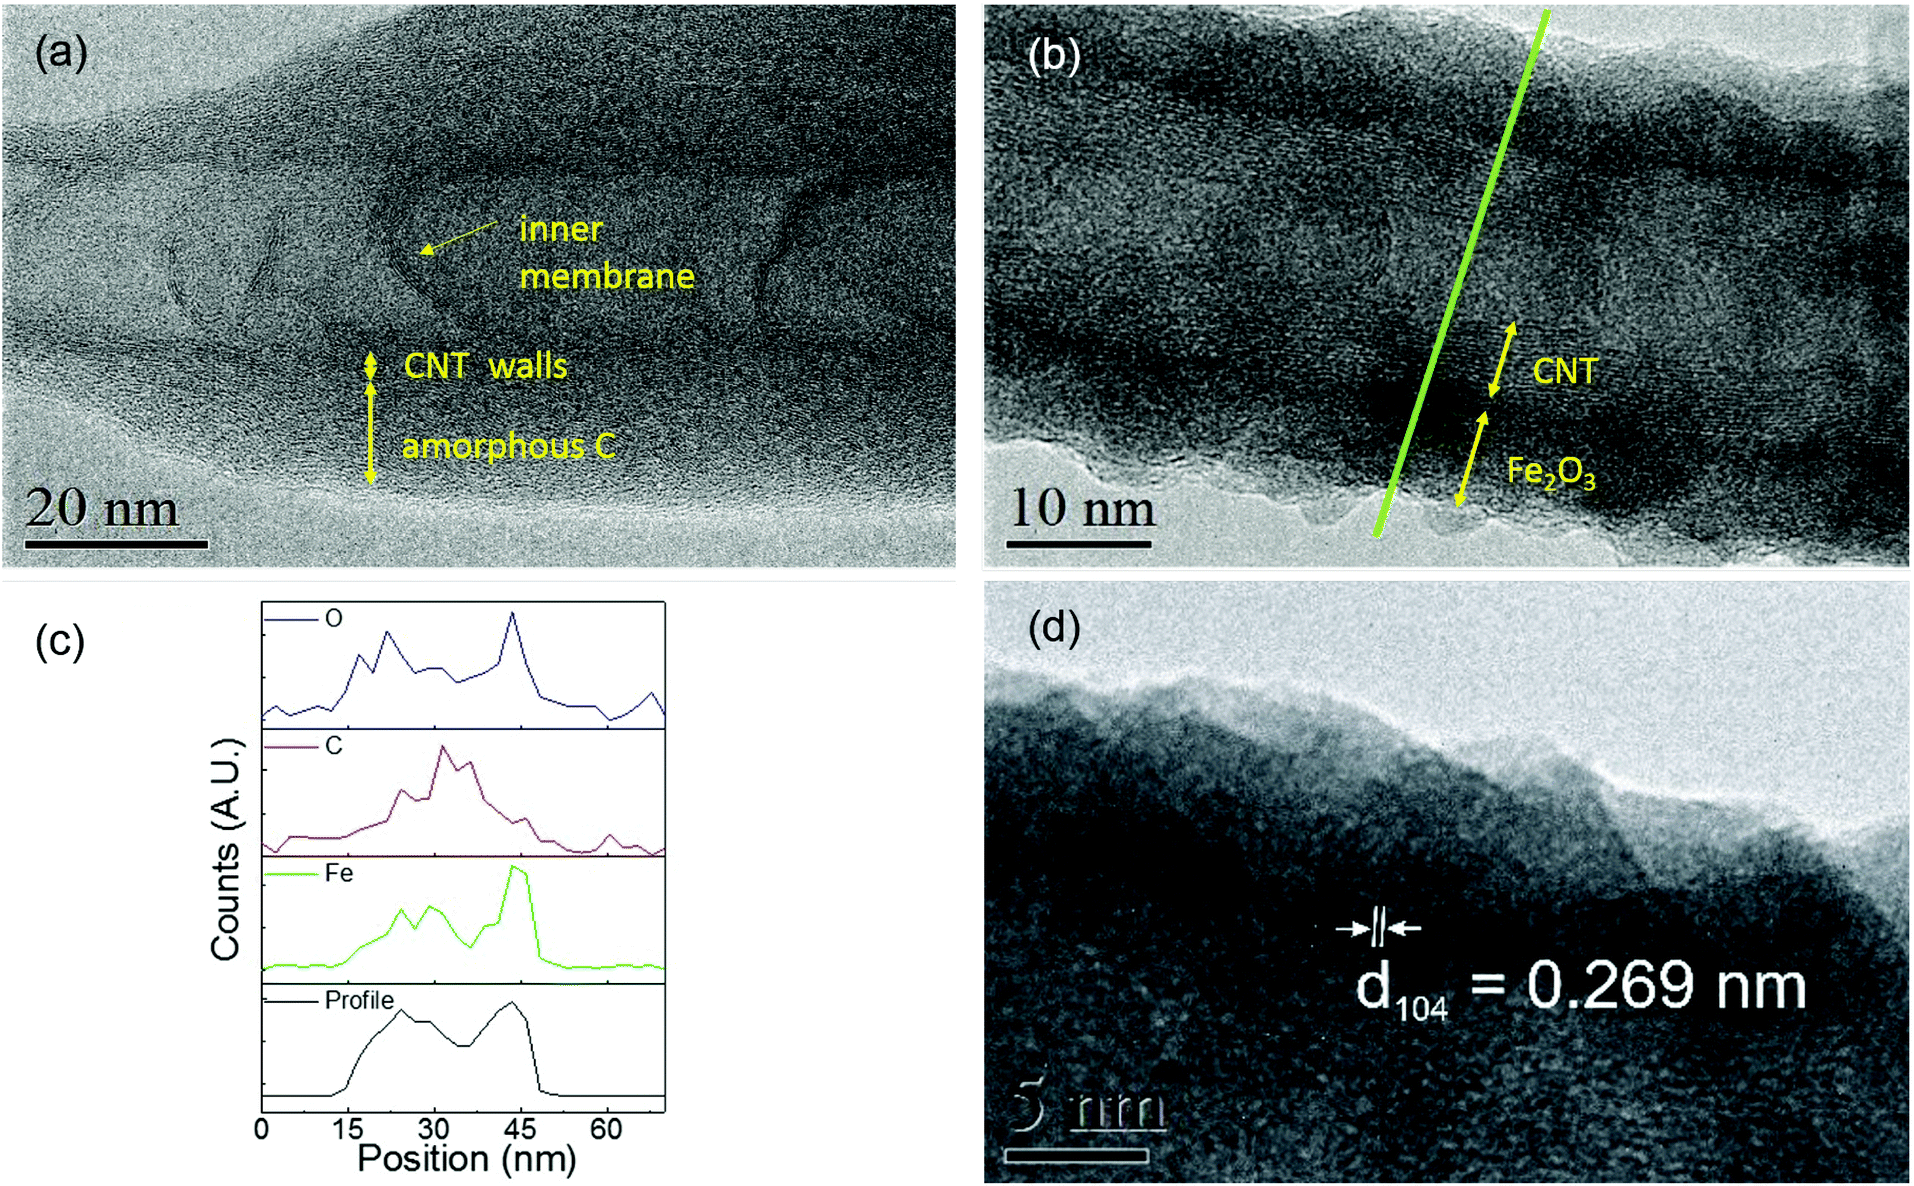 | ||
| Fig. 3 High resolution TEM analysis of (a) pristine utCNTs. CNT walls, inner membranes and the amorphous C layer are indicated by arrows. (b) 6 nm Fe2O3@wpCNTs; (c) elemental line profile of O, C and Fe acquired along the green line marked in (b). (d) High resolution TEM of the Fe2O3 coating on wpCNTs revealing an interplanar spacing of d ∼ 0.269 nm for iron oxide. | ||
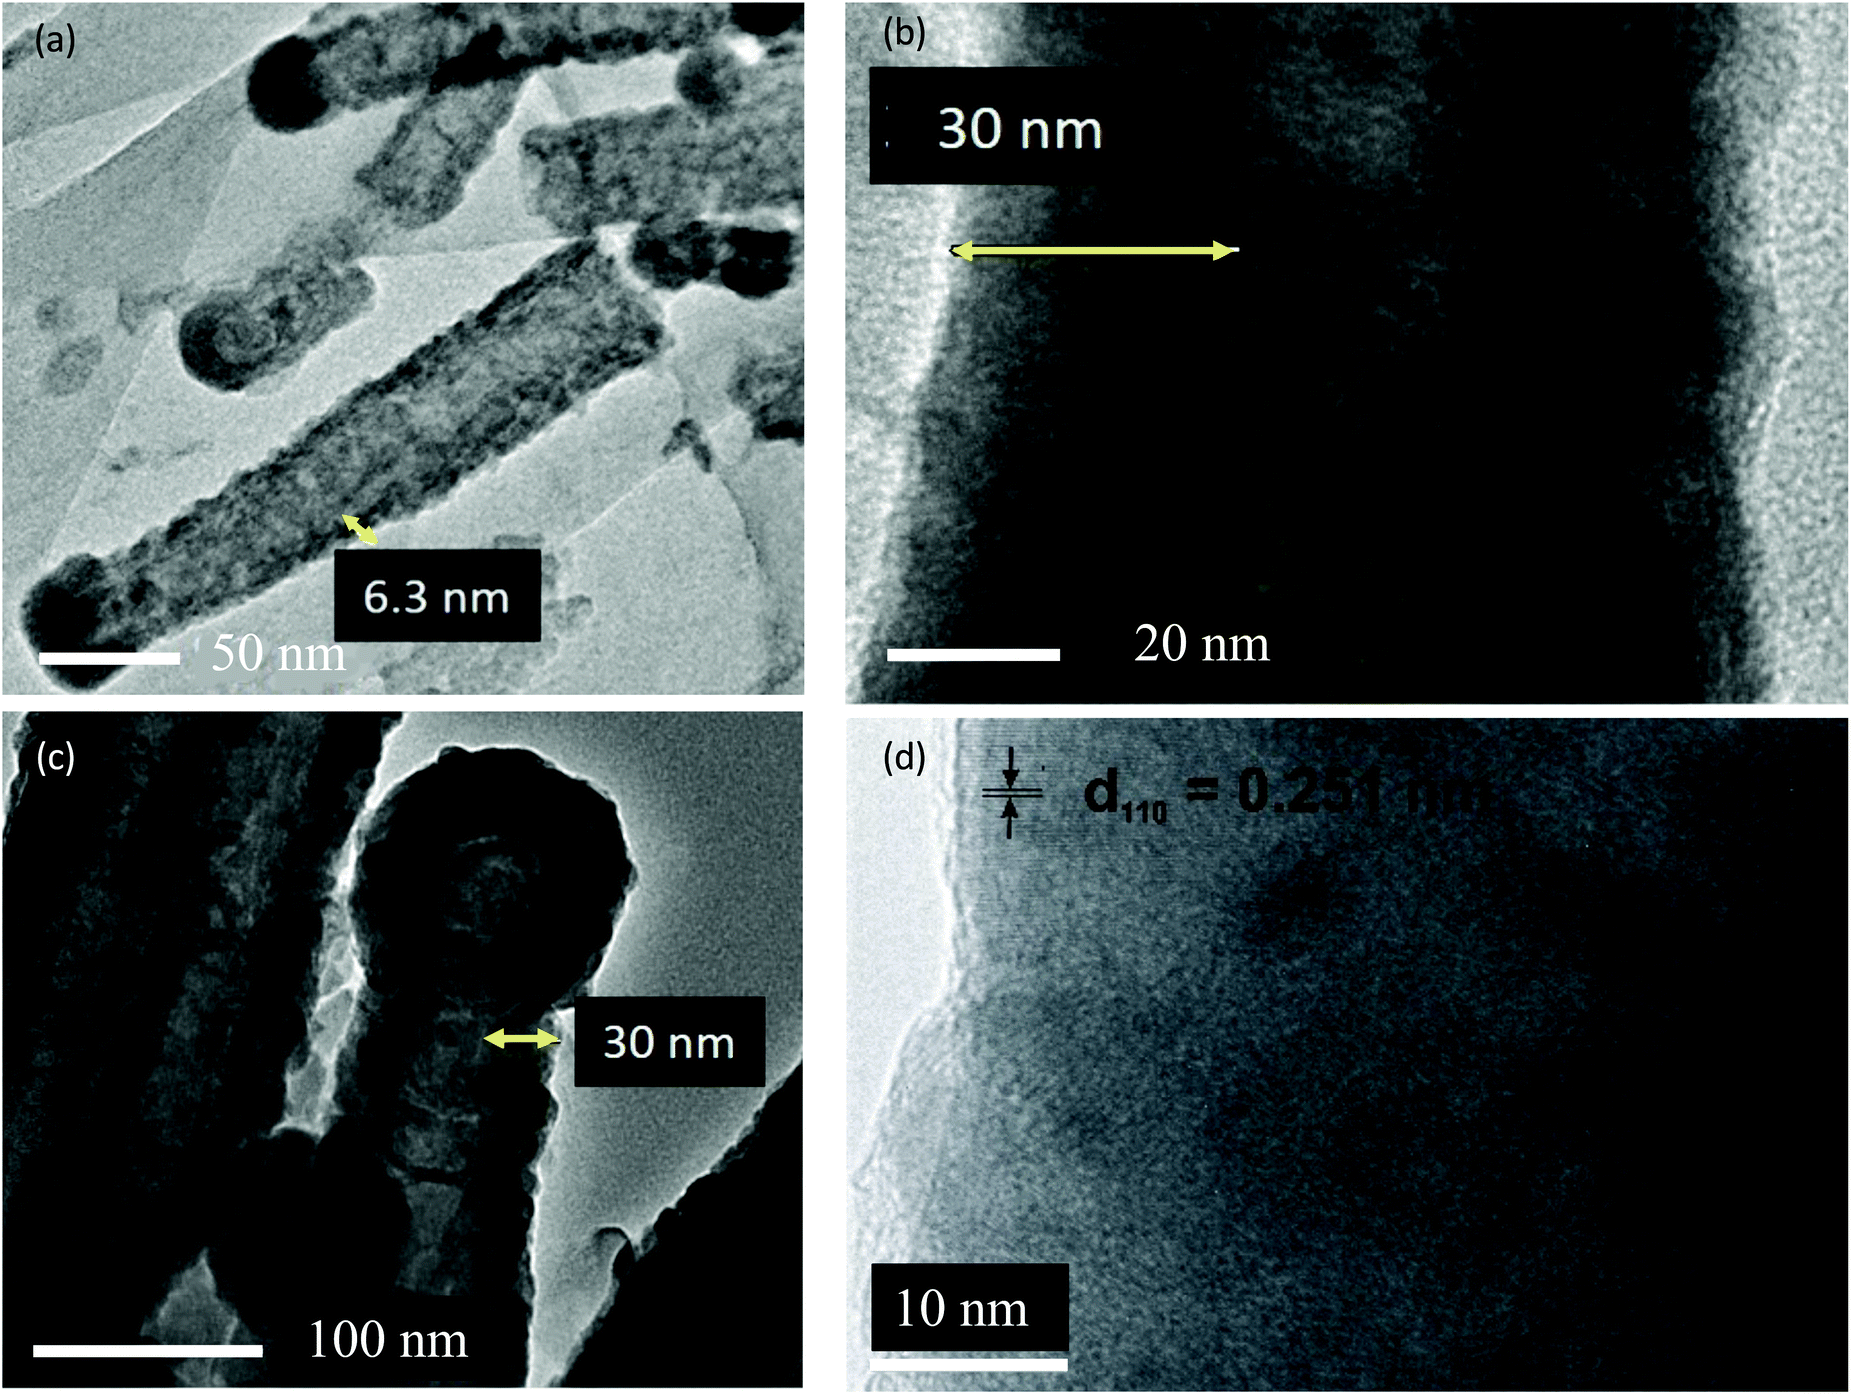 | ||
| Fig. 4 (a) TEM images of 6 nm Fe2O3@npCNTs and (b) 30 nm Fe2O3@utCNTs and (c) and (d) high resolution TEM images of 30 nm Fe2O3@wpCNTs. | ||
The surface chemical compositions of the iron oxide coated utCNTs, npCNTs and wpCNTs were further analysed by XPS. High resolution Fe 2p core level spectra are depicted in Fig. 5(a). The spectra reveal a typical spin–orbit doublet feature at 724.7 eV (2p1/2) and 711.2 eV (2p3/2), and the corresponding satellite peak at 719.4 eV. The difference between 2p3/2 and its satellite peak is 8.4 eV, confirming the +3 oxidation state of iron34 in the three different composites.
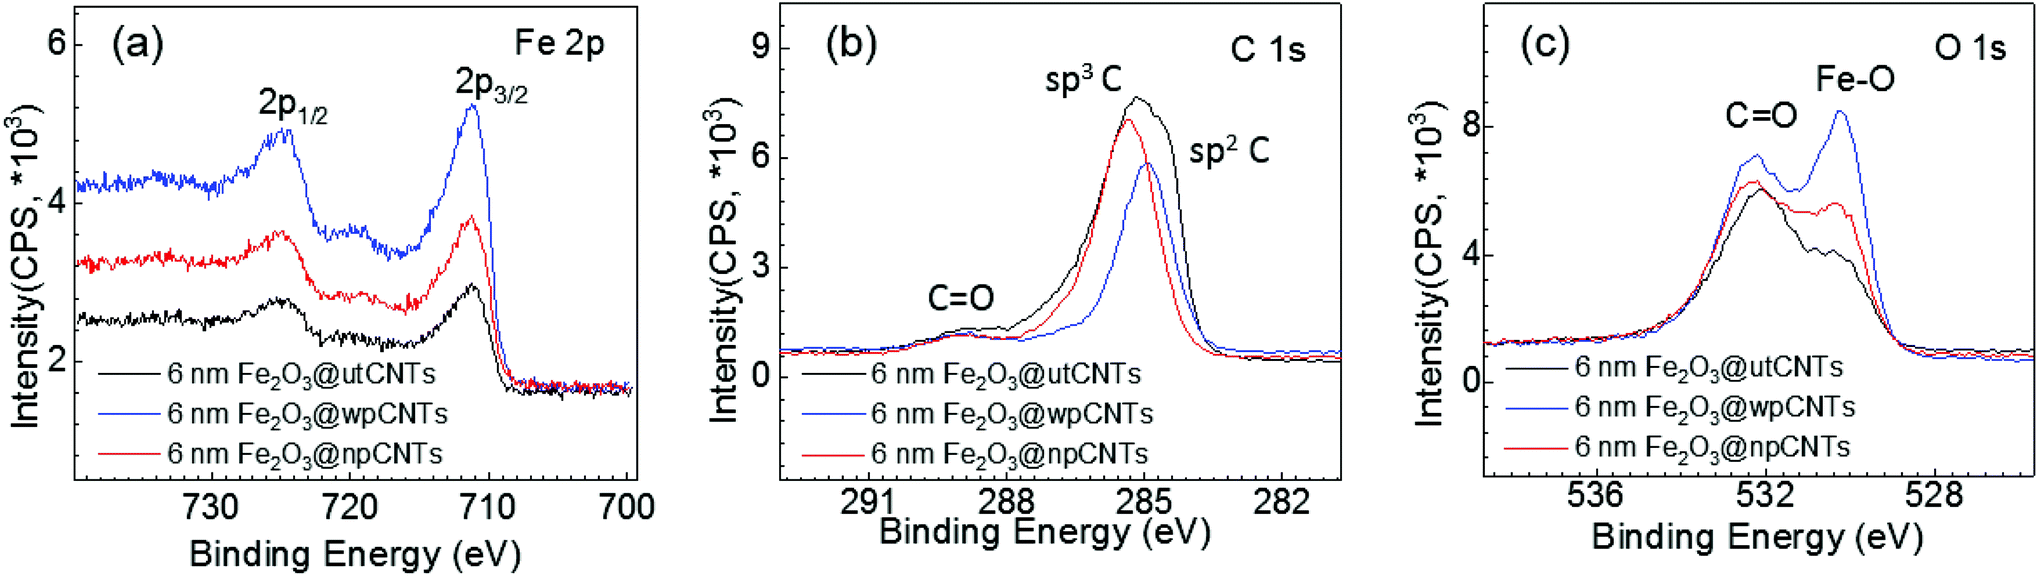 | ||
| Fig. 5 (a) High-resolution Fe 2p spectra; (b) C 1s spectra and (c) O 1s spectra of 6 nm Fe2O3@CNTs. | ||
High resolution C 1s spectra are shown in Fig. 5(b). The main peak is assigned to the graphitic carbon of the CNTs and the low intensity peak located at higher binding energies (288.4 eV) to the C![[double bond, length as m-dash]](https://www.rsc.org/images/entities/char_e001.gif) O bonds. Note that the main peak is centered at slightly different binding energies depending on the plasma treatment. For gaining deeper insight into the bonding chemistry of the graphitic carbon, the C 1s spectra have been deconvoluted into at least four component Gaussian peaks (see Fig. S2†). For Fe2O3@utCNTs, the main peak is broad and asymmetric identifying a strong contribution assigned to sp3 hybridized graphitic-like carbon (C–C), i.e. amorphous carbon, and a smaller contribution at a slightly lower binding energy, 284.5 eV, attributed to sp2 hybridized carbon atoms (CC).35 Along with the previously identified contribution of CO at 288.4 eV, the peak deconvolution identifies a shoulder at 286.6 eV due to the C–O bonds. For Fe2O3@npCNTs the main peak is narrower and centered at 285.3 eV, suggesting that the sp3 contribution dominates. Finally, Fe2O3@wpCNTs shows a peak centered at 284.9 eV, revealing that the main contribution arises from the sp2 hybridized carbon atoms. Therefore, the plasma treated samples show a decreased C sp3 concentration compared to the utCNTs, in good agreement with the partial removal of amorphous carbon upon plasma treatment.8
O bonds. Note that the main peak is centered at slightly different binding energies depending on the plasma treatment. For gaining deeper insight into the bonding chemistry of the graphitic carbon, the C 1s spectra have been deconvoluted into at least four component Gaussian peaks (see Fig. S2†). For Fe2O3@utCNTs, the main peak is broad and asymmetric identifying a strong contribution assigned to sp3 hybridized graphitic-like carbon (C–C), i.e. amorphous carbon, and a smaller contribution at a slightly lower binding energy, 284.5 eV, attributed to sp2 hybridized carbon atoms (CC).35 Along with the previously identified contribution of CO at 288.4 eV, the peak deconvolution identifies a shoulder at 286.6 eV due to the C–O bonds. For Fe2O3@npCNTs the main peak is narrower and centered at 285.3 eV, suggesting that the sp3 contribution dominates. Finally, Fe2O3@wpCNTs shows a peak centered at 284.9 eV, revealing that the main contribution arises from the sp2 hybridized carbon atoms. Therefore, the plasma treated samples show a decreased C sp3 concentration compared to the utCNTs, in good agreement with the partial removal of amorphous carbon upon plasma treatment.8
By comparing Fe2O3@wpCNTs vs. Fe2O3@npCNTs, it is observed that the Fe2O3@npCNTs composite shows a larger contribution of C–C sp3 hybridization, confirming that the nitrogen plasma treatment is less effective at removing amorphous carbon than water plasma treatment. The amount of sp3 C and sp2 C in each composite has been calculated from the C 1s XPS deconvolution and is listed in Table S1.† All three scenarios show the presence of carbon–oxygen bonds, considered to be the main anchoring sites for the iron oxide deposition. Note that the CC bonds are susceptible to react upon N2 or H2O plasma treatment7,8 but they could also be oxidized with O3![[thin space (1/6-em)]](https://www.rsc.org/images/entities/char_2009.gif) 36 during the ALD process creating CO or C–O bonds as active sites. This is relevant because covalent functionalization can improve the anchoring of the ALD precursors for the iron oxide coating but it can also change the conductance of the nanotube and can be detrimental to the electrochemical properties,30 as will be discussed below.
36 during the ALD process creating CO or C–O bonds as active sites. This is relevant because covalent functionalization can improve the anchoring of the ALD precursors for the iron oxide coating but it can also change the conductance of the nanotube and can be detrimental to the electrochemical properties,30 as will be discussed below.
The O 1s high resolution spectra, Fig. 5(c), show two main contributions at 532.2 eV and 530.3 eV attributed to the CO bonds and Fe–O bonds, respectively. The weight of the two contributions varies depending on the nature of the plasma treatment. Fe2O3@wpCNTs shows the largest contribution of the Fe–O bond, indicating a larger amount of Fe2O3. For Fe2O3@utCNTs, the largest contribution is the one corresponding to CO. It is important to note that the Fe2O3@utCNTs composite also shows Fe–O bond contribution which is in agreement with the formation of the iron oxide coating.
As anticipated in the SEM analysis, our results suggest that the iron oxide coating can be obtained on CNTs without previous plasma treatment. The O3 gas introduced in the reaction chamber during the ALD process could also promote the transformation of C–C and CC bonds of the CNTs into CO and OC–O37 increasing the amount of anchoring sites, in good agreement with the species detected by XPS. In fact, this is supported by the formation of Fe2O3 in the three systems regardless of the surface treatment (untreated and N2 and H2O plasma treated). The non-uniform coverage of the utCNTs identified from the SEM analysis, Fig. 1(g), could lie in the propensity of the carbon bonds at the tips of the CNTs to react under oxidizing conditions (i.e. ozone) because they are under higher strain due to their large curvature providing lower activation energy,38 being the anchoring sites for the subsequent reaction with ferrocene.
According to this observation, the reaction mechanism of iron oxide formation in our composite systems could be similar to that previously described for ferrocene and O2 on modified CNTs.32 Ferrocene would chemically bond with the functional groups on the CNT surface (–COOH and –OH for wpCNTs and utCNTs upon activation by ozone; graphite-like N and pyridine-like N for npCNTs) and during the ozone pulse the ferrocene ligand will oxidize and create new anchoring sites for the following ALD cycle.
2.2. Electrochemical properties
It is well known that surface modification of as-grown CNTs helps improving the electrochemical response.7,39 Here we investigate how both surface functionalization and Fe2O3 coating influences the electrochemical properties. The areal capacitance of the samples was calculated from the cyclic voltammograms applying eqn (1),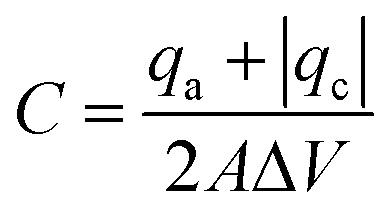 | (1) |
 | ||
| Fig. 6 Areal capacitance of carbon nanotubes with and without plasma treatment, covered with 6 and 30 nm thickness ALD-iron oxide at a 50 mV s−1 scan rate. | ||
 | ||
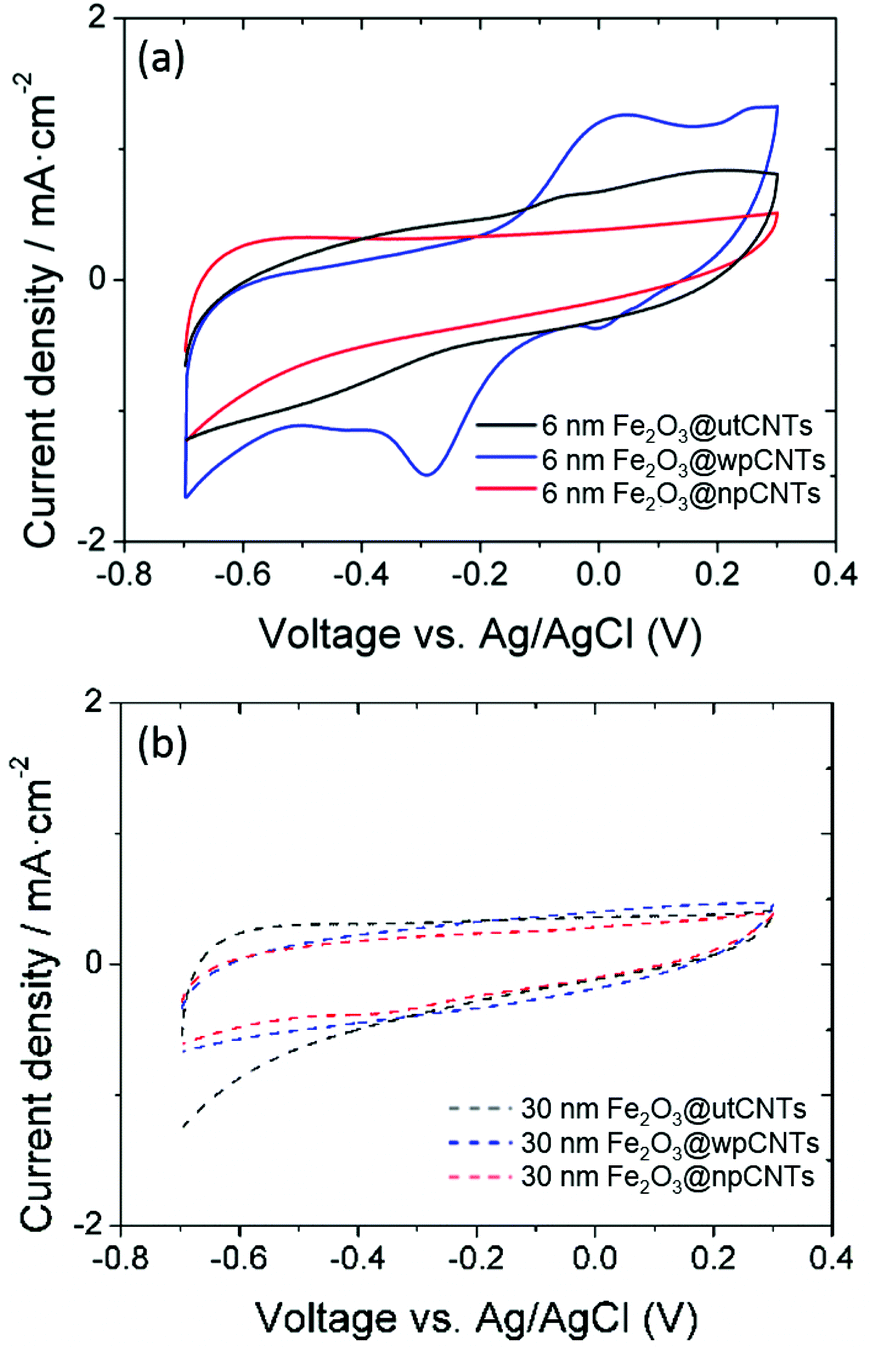
| Fig. 7 Cyclic voltammograms of 6 nm Fe2O3@wpCNTs at scan rates from 10 to 150 mV s−1. | ||
The areal capacitance of the carbon nanotubes increases after atomic layer deposition of iron oxide from below 1 mF cm−2 for bare CNTs (not shown) up to 32 mF cm−2 at a scan rate of 10 mV s−1 (6 nm Fe2O3@wpCNTs in Fig. 8). If the layer of iron oxide is too thick, i.e., in the order of the CNT separation distance, the capacitance decreases again due to the reduction of the nanocomposite porosity and thus the electrochemically active surface area. An iron oxide layer of about 6 nm thickness appears to be suitable for high areal capacitance, while a 30 nm thick layer reduces the electrochemically active area of the electrode. In addition, the water plasma treatment of the nanotubes allows the removal of amorphous carbon and surface functionalization with oxygen groups, which result in a better electrochemical performance of the deposited oxide. In contrast, the nitrogen plasma treatment of the CNT surface has a negative effect on the areal capacitance of the nanocomposite. Nitrogen plasma allows the partial removal of amorphous carbon and the introduction of the nitrogen groups on the CNT surface.39 However, these groups along with a larger amount of amorphous C compared to the water plasma treated samples seem to be detrimental to the formation of an electrochemically active layer of iron oxide for supercapacitor applications.
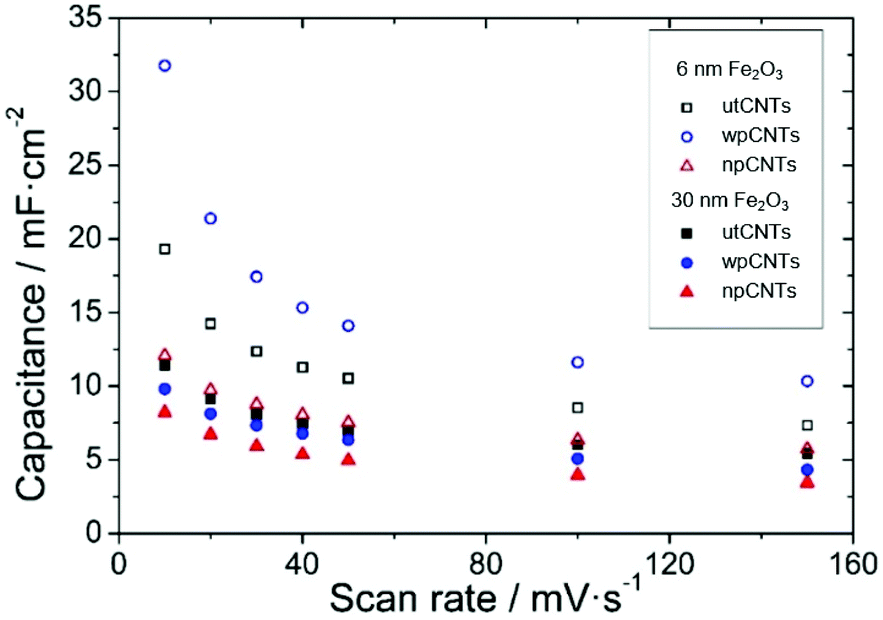 | ||
| Fig. 8 Areal capacitances of different nanocomposites versus scan rates. | ||
Electrochemical Impedance Spectroscopy provides further information about the processes taking place at the interfaces and bulk of the samples. The Nyquist plot presents the typical behavior of capacitive porous electrodes with the data becoming steeper in the low-frequency region of the spectra (Fig. 9). A modified Randles circuit allows fitting the experimental points with circuit elements in series and parallel configurations describing charge storage and transfer processes between the electrode and the electrolyte (inset in Fig. 9). The intersection point with the real axis in the Nyquist spectra (see inset graph in Fig. 9) corresponds to the cell internal resistance (RS). The charge transfer resistance (RCT) describes transfer processes between the electrode and electrolyte and is connected in parallel with the double layer capacitance (CDL). In the mid-frequency region of the spectra a Warburg element (WO) refers to the diffusion of ions through the porous structure of the electrode, expressed by A/(jω)n where A is the Warburg coefficient, ω is the angular frequency and n is an exponent. At low frequencies, the points of the spectra become steeper in accordance with a polarized capacitive behavior which is described by mass capacitance (CL) in parallel with leakage resistance (RL). The whole spectra were fitted using ZVIEW software (Version 2.1, Scribner Associates, Inc., Southern Pines, NC, USA) and the equivalent circuit parameters obtained are given in Table 1.
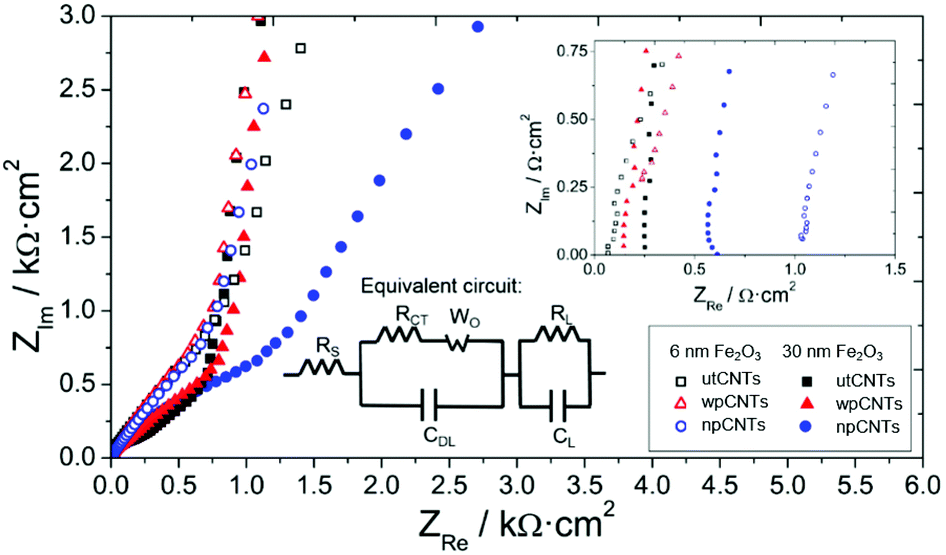 | ||
| Fig. 9 Nyquist plot of different CNT samples covered with 6 and 30 nm iron oxide by ALD. The inset shows the intersection with the real axis in the high-frequency region and the modified Randles equivalent circuit used to fit the data. | ||
| Electrode material | R S (Ω cm2) | R CT (Ω cm2) | A (kΩ s−n) | n | C DL (mF cm−2) | R L (Ω cm2) | C L (mF cm−2) |
|---|---|---|---|---|---|---|---|
| 6 nm Fe2O3@utCNTs | 0.08 | 0.37 | 0.5 | 0.56 | 0.20 | 566 | 3.5 |
| 6 nm Fe2O3@npCNTs | 0.12 | 0.25 | 5.5 | 0.64 | 0.07 | 68 | 7.0 |
| 6 nm Fe2O3@wpCNTs | 1.08 | 2 × 10⁻⁷ | 0.5 | 0.45 | 0.32 | 341 | 6.0 |
| 30 nm Fe2O3@utCNTs | 0.28 | 79 | 2.8 | 0.40 | 0.074 | 1.3 | 0.30 |
| 30 nm Fe2O3@npCNTs | 0.18 | 11 | 4.0 | 0.42 | 0.081 | 0.42 | 0.33 |
| 30 nm Fe2O3@wpCNTs | 0.66 | 5 × 10⁻⁷ | 7.0 | 0.44 | 0.095 | 191 | 0.70 |
The internal resistances of the samples are similar, which is related to electrolyte resistance, cables, and contact resistances of the cell,42 and take values in the range of 0.08 to 1.08 Ω cm2, with the wpCNTs presenting the highest values. This result is assumed to be related to the oxygen groups incorporated on the surface of the CNTs after the water plasma treatment, which may increase the resistance of the nanotubes as observed previously.43 The charge transfer resistance between the nanocomposite and the electrolyte presents the lowest value for the water-plasma treated samples, which indicates excellent contact between the iron oxide layer and the carbon nanotubes. The untreated sample shows the highest RCT values due to the amorphous carbon present on the surface of the nanotubes which avoids good contact with the oxide coverage and the CNTs. As expected, the RCT value increases with iron oxide thickness due to its low conductivity. The Warburg coefficient also increases from 6 to 30 nm deposition thickness, in agreement with higher ion diffusion resistance through the pores of the sample. The Warburg exponent values are around 0.45, except for the 6 nm Fe2O3@npCNTs sample, which presents a value of 0.64 related to diffusion taking place only at the surface of the electrode.44 The double layer capacitance, associated with the electrostatic charging of the electrode, reaches a maximum value for the 6 nm Fe2O3@wpCNTs sample. The leakage resistance presents a minimum for the nitrogen-plasma treated samples (6 and 30 nm iron oxide thickness), which explains the low charge storage capacity of these samples. 30 nm Fe2O3@wpCNTs (0.7 mF cm−2) and 6 nm Fe2O3@npCNTs (7 mF cm−2) present the maximum mass capacitance values for their respective thicknesses. However, the low RL of the nitrogen-plasma treated sample results in low energy storage capability. Thus, 6 nm Fe2O3@wpCNTs shows optimum values of leakage resistance, double layer and mass capacitances. This is assumed to be related to the more effective removal of amorphous carbon (see Fig. S2†), and the introduction of the oxygen groups that promote a conformal coating and an optimum interface between the CNT and the metal oxide. The nitrogen plasma treatment is not so effective in removing the amorphous carbon (see Fig. S2†) and introduces nitrogen groups that avoid the stable accumulation of charges at the interfacial region between the electrode and electrolyte. The overall capacitance obtained from the fitting of EIS data is of the same order of magnitude as those obtained by cyclic voltammetry. The values are also similar to those already reported in the literature (37 mF cm−2) for vertically oriented CNTs covered with metal oxide nanoparticles.45 Other works present higher areal capacitance values (around 600 mF cm−2).26 However, the nanotubes are not vertically aligned but rather randomly oriented and with a higher mass loading (30–50 mg cm−2). Other materials deposited on VACNTs have been studied and show similar areal capacitance values, i.e. 37.5 mF cm−2 for DC-sputtered vanadium nitrate on VACNTs.46 Extremely high areal capacitance values have been obtained using asymmetric supercapacitors with binary metal sulfides and polypyrrole on VACNTs (3.3 F cm−2).47 By analyzing the morphology and thickness of the iron oxide coating from SEM and TEM images, the mass loading of our samples was estimated to be 30–160 μg cm−2, depending on the thickness. This corresponds to a theoretical specific capacitance of about 1000 F g−1 at 1 A g−1, which is in agreement with previous works on the ALD of iron oxide on CNTs.40 These values are also similar to those obtained using other deposition techniques such as the hydrothermal method. Using this technique Fe2O3 was deposited on CNT sponges providing 269.3 F g−1 specific capacitance,48 and iron oxide nanoparticles were deposited on nitrogen-doped reduced graphene oxide providing up to 618 F g−1.49
3. Experimental
3.1. Growth of carbon nanotubes
Synthesis of 1 μm-long vertically aligned-multiwalled CNTs (VA-MWCNTs) was carried out in a PECVD (plasma-enhanced chemical vapour deposition) reactor which allows to do sputtering, PECVD and plasma functionalization. A Papyex© flexible graphite sheet (n998) of 0.2 mm thickness was used as a substrate. At a chamber base pressure below 4 × 10⁻⁴ Pa, 3 nm of the Fe catalyst was sputtered on the graphite substrate using 128 sccm Ar. In order to anneal the catalyst layer, the sample was located below the graphite thermal resistance (2 Ω). The annealing process was achieved at 680 °C under 2 mbar hydrogen pressure with 750 s ramp time and 120 s hold time. Subsequently, the PECVD process was carried out for 15 min, at the same temperature, under 1 mbar pressure, applying 50 W plasma power and with 100 and 50 sccm gas flow of NH3 and C2H2, respectively.Two different plasma treatments were performed on the CNT samples in order to introduce the nitrogen (nitrogen plasma) and oxygen (water plasma) functional groups on their surface and analyze their effect on the ALD-deposition of iron oxide and the electrochemical properties of the nanocomposites. The conditions for the water plasma treatment were: 30 s, 50 Pa water vapor pressure, and 50 W plasma power, and for the nitrogen plasma treatment: 120 s, 50 Pa nitrogen pressure with a flow of 100 sccm and 50 W plasma power.8
3.2. Deposition of Fe2O3 coatings
Fe2O3 coatings on untreated CNTs (utCNTs), water plasma CNTs (wpCNTs)7 and nitrogen plasma CNTs (npCNTs)8 were prepared by atomic layer deposition in a Cambridge NanoTech Savannah 100 ALD system. Reference p-type boron-doped Si (100) pieces were placed in the ALD reactor simultaneously with the CNT samples for determining the Fe2O3 growth rate and film thickness. The deposition process was realized via alternating ferrocene Fe(Cp)2 (heated at 80–100 °C) and ozone (O3) pulses at 200–250 °C. Exposure mode was employed by closing the exit valve of the reactor for a certain amount of time before the subsequent purging procedure, allowing precursor penetration into the deep CNT trenches and ensuring adequate reaction time between the precursors and CNT surface groups. The pulse/exposure/purge sequence applied to this system was 2–3.5 s/30–50 s/20–40 s for ferrocene and 0.2–1 s/20–40 s/20–40 s for ozone. A 40 sccm nitrogen gas flow was used as both the carrier and purge gas. The thickness of the coatings (6 nm and 30 nm) was adjusted by varying the number of ALD cycles. Note that below 6 nm the film was not continuous.3.3. Fe2O3@CNTs characterization
The morphological and structural details of the samples were obtained using field emission scanning electron microscopy (SEM) (JEOL JSM-7001F, operated at 20 kV, JEOL Ltd, Tokyo, Japan) and transmission electron microscopy (TEM) (Hitachi H-800 MT, Hitachi Ltd, Tokyo, Japan). The carbon nanocomposites were transferred to the TEM grid by scratching off from the substrates to a pure ethanol solution, dispersed in an ultrasonic bath for 1 hour and a few drops of the solution was allowed to dry on a TEM grid.The surface chemical composition was studied by X-ray photoelectron spectroscopy (XPS) carried out with a PHI 5500 Multitechnique System (Physical Electronics, Germany) equipped with a monochromatic X-ray source (aluminum Kα line of 1486.6 eV energy and 350 W), placed perpendicular to the analyzer axis and calibrated using the 3d5/2 line of Ag with a full width at half maximum (FWHM) of 0.8 eV. The analyzed area was a circle of 0.8 mm diameter, and the selected resolution for the spectra was 187.5 eV pass energy and 0.8 eV per step for the general spectra and 11.75 eV pass energy and 0.05 eV per step for the core level spectra. All measurements were made in an ultrahigh vacuum (UHV) chamber with pressure between 5 × 10⁹ and 2 × 10⁸ Torr.
The phase and crystallinity of the iron oxide layer were explored on reference samples by means of Grazing Incidence X-ray Diffraction (GIXRD). Coating thickness analysis was investigated by X-ray reflectivity (XRR). Both studies were performed using a Bruker-AXS model A25 D8 Discover diffractometer (Cu Kα radiation source), revealing that the structure of the as-deposited iron-oxide coating is a pure hematite phase (α-Fe2O3), see ESI Fig. S3.†
The electrochemical properties of the samples were analyzed using a potentiostat/galvanostat (AutoLab, PGSTAT30, Eco Chemie B.V., Utrecht, The Netherlands) and a typical three-electrode cell. Different nanocomposite samples were used as the working electrode in 1 M Na2SO4 solution. A Pt-ring electrode and an Ag/AgCl electrode (3 M KCl internal solution) served as the counter and reference electrode, respectively. The electrochemical behavior of the samples was investigated using cyclic voltammetry (CV) and electrochemical impedance spectroscopy (EIS). All experiments were carried out at room temperature and the geometrical area of the working electrode was set to a constant value of 0.57 cm2. The voltage window during CV was −0.7 to 0.3 V vs. Ag/AgCl at scan rates between 10 and 150 mV s−1. The EIS analysis was performed by applying an alternating voltage of 10 mV amplitude to the samples and recording the response at frequencies between 1 Hz and 100 kHz in logarithmic spacing.
4. Conclusions
In this work we have prepared Fe2O3@CNTs coaxial heterostructures in which the oxide scaffold is grown by ALD. We have investigated the effect of nanotube surface functionalization through different plasma treatments (N2 and H2O plasma) on the deposition of the iron oxide coating and on the electrochemical properties. By using ozone as an oxidant source in the ALD deposition, iron oxide coating can be achieved regardless of the surface treatment. Nonetheless, untreated CNTs result in less homogeneous coatings. The iron oxide coating increases the areal capacitance although too thick coating (30 nm) reduces the active area and the electrochemical performance. We have identified that Fe2O3@wpCNTs composites show optimum values of leakage resistance, double layer and mass capacitances. Therefore, the H2O plasma treatment promotes the best anchoring sites for conformal ALD iron oxide deposition and excellent contact between the oxide coating and the CNTs, by effectively removing amorphous C, for the electrochemical response.Conflicts of interest
There are no conflicts to declare.Acknowledgements
The authors acknowledge financial support from the Spanish MINECO (Severo Ochoa Programme for Centres of Excellence in R&D SEV-2015-0496 and MAT2017-83169-R, ENE2014-56109-C3-1-R, ENE2014-56109-C3-3-R, ENE2017-89210-C2-1-R, ENE2017-89210-C2-2-R AEI/FEDER), and by AGAUR of Generalitat de Catalunya, grant numbers 2017SGR1086 and 2017SGR1519 We also thank the China Scholarship Council for CSC fellowship No. 201606920073 to P.Y. IA and FP acknowledge the financial support of their PhD studies from MICINN and SENESCYT of the Ecuadorian Government, which provided financial support through its scholarship program for 2014, respectively. The authors would also like to thank the CCiT-UB for help with the surface analysis and the structural and morphological characterization of the samples.References
- J. I. Hur, L. C. Smith and B. Dunn, Joule, 2018, 2, 1187–1201 CrossRef CAS.
- C. Lethien, J. Le Bideau and T. Brousse, Energy Environ. Sci., 2019, 12, 96–115 RSC.
- L. Liu, H. Zhao and Y. Lei, InfoMat, 2019, 1, 74–84 CrossRef.
- P. G. Bruce, B. Scrosati and J.-M. Tarascon, Angew. Chem., Int. Ed., 2008, 47, 2930–2946 CrossRef CAS PubMed.
- S. Najib and E. Erdem, Nanoscale Adv., 2019, 1, 2817–2827 RSC.
- P. Dulyaseree, V. Yordsri and W. Wongwiriyapan, Jpn. J. Appl. Phys., 2016, 55, 02BD05 CrossRef.
- S. Hussain, R. Amade, E. Jover and E. Bertran, Nanotechnology, 2012, 23, 385604 CrossRef CAS PubMed.
- S. Hussain, R. Amade, E. Jover and E. Bertran, J. Mater. Sci., 2013, 48, 7620–7628 CrossRef CAS.
- M. R. Lukatskaya, B. Dunn and Y. Gogotsi, Nat. Commun., 2016, 7, 12647 CrossRef PubMed.
- S. Yang, X. Feng and K. Müllen, Adv. Mater., 2011, 23, 3575–3579 CrossRef CAS PubMed.
- Y.-S. Kim, H.-J. Ahn, S. H. Nam, S. H. Lee, H.-S. Shim and W. B. Kim, Appl. Phys. Lett., 2008, 93, 103104 CrossRef.
- X. Xiao, Z. Peng, C. Chen, C. Zhang, M. Beidaghi, Z. Yang, N. Wu, Y. Huang, L. Miao, Y. Gogotsi and J. Zhou, Nano Energy, 2014, 9, 355–363 CrossRef CAS.
- A. L. M. Reddy, M. M. Shaijumon, S. R. Gowda and P. M. Ajayan, Nano Lett., 2009, 9, 1002–1006 CrossRef CAS PubMed.
- M. B. Sassin, A. N. Mansour, K. A. Pettigrew, D. R. Rolison and J. W. Long, ACS Nano, 2010, 4, 4505–4514 CrossRef CAS PubMed.
- X. Lu, Y. Zeng, M. Yu, T. Zhai, C. Liang, S. Xie, M. Balogun and Y. Tong, Adv. Mater., 2014, 26, 3148–3155 CrossRef CAS PubMed.
- Q. X. Low and G. W. Ho, Nano Energy, 2014, 5, 28–35 CrossRef CAS.
- B. Joshi, E. Samuel, H. S. Jo, Y.-I. Kim, S. Park, M. T. Swihart, W. Y. Yoon and S. S. Yoon, Electrochim. Acta, 2017, 253, 479–488 CrossRef CAS.
- W. Shi, J. Zhu, D. H. Sim, Y. Y. Tay, Z. Lu, X. Zhang, Y. Sharma, M. Srinivasan, H. Zhang, H. H. Hng and Q. Yan, J. Mater. Chem., 2011, 21, 3422–3427 RSC.
- Q. Qu, S. Yang and X. Feng, Adv. Mater., 2011, 23, 5574–5580 CrossRef CAS PubMed.
- X.-C. Dong, H. Xu, X.-W. Wang, Y.-X. Huang, M. B. Chan-Park, H. Zhang, L.-H. Wang, W. Huang and P. Chen, ACS Nano, 2012, 6, 3206–3213 CrossRef CAS PubMed.
- S. Yang, X. Feng, S. Ivanovici and K. Müllen, Angew. Chem., Int. Ed., 2010, 49, 8408–8411 CrossRef CAS PubMed.
- T. M. Dinh, A. Achour, S. Vizireanu, G. Dinescu, L. Nistor, K. Armstrong, D. Guay and D. Pech, Nano Energy, 2014, 10, 288–294 CrossRef CAS.
- X. Wang, Y. Yin, C. Hao and Z. You, Carbon, 2015, 82, 436–445 CrossRef CAS.
- J. Li, M. Zhu, Z. An, Z. Wang, M. Toda and T. Ono, J. Power Sources, 2018, 401, 204–212 CrossRef CAS.
- Z. Wang and C.-J. Liu, Nano Energy, 2015, 11, 277–293 CrossRef CAS.
- C. Guan, J. Liu, Y. Wang, L. Mao, Z. Fan, Z. Shen, H. Zhang and J. Wang, ACS Nano, 2015, 9, 5198–5207 CrossRef CAS PubMed.
- J. W. Elam, N. P. Dasgupta and F. B. Prinz, MRS Bull., 2011, 36, 899–906 CrossRef CAS.
- M. Coll and M. Napari, APL Mater., 2019, 7, 110901 CrossRef.
- G.-D. Zhan, X. Du, D. M. King, L. F. Hakim, X. Liang, J. A. McCormick and A. W. Weimer, J. Am. Ceram. Soc., 2008, 91, 831–835 CrossRef CAS.
- D. B. Farmer and R. G. Gordon, Nano Lett., 2006, 6, 699–703 CrossRef CAS PubMed.
- N. Kemnade, C. J. Shearer, D. J. Dieterle, A. S. Cherevan, P. Gebhardt, G. Wilde and D. Eder, Nanoscale, 2015, 7, 3028–3034 RSC.
- X. Meng, M. Ionescu, M. N. Banis, Y. Zhong, H. Liu, Y. Zhang, S. Sun, R. Li and X. Sun, J. Nanopart. Res., 2010, 13, 1207–1218 CrossRef.
- L. Acauan, A. C. Dias, M. B. Pereira, F. Horowitz and C. P. Bergmann, ACS Appl. Mater. Interfaces, 2016, 8, 16444–16450 CrossRef CAS PubMed.
- A. P. Grosvenor, B. A. Kobe, M. C. Biesinger and N. S. McIntyre, Surf. Interface Anal., 2004, 36, 1564–1574 CrossRef CAS.
- S. Kim, J. Kim, J. Lim, H. Lee, Y. Jun and D. Kim, J. Mater. Chem. C, 2014, 2, 6985–6990 RSC.
- C. Chen, B. Liang, A. Ogino, X. Wang and M. Nagatsu, J. Phys. Chem. C, 2009, 113, 7659–7665 CrossRef CAS.
- F. Morales-Lara, M. J. Pérez-Mendoza, D. Altmajer-Vaz, M. García-Román, M. Melguizo, F. J. López-Garzón and M. Domingo-García, J. Phys. Chem. C, 2013, 117, 11647–11655 CrossRef CAS.
- S. Hussain, R. Amade, E. Jover and E. Bertran, J. Cluster Sci., 2015, 26, 315–336 CrossRef CAS.
- S. Hussain, R. Amade, H. Moreno and E. Bertran, Diamond Relat. Mater., 2014, 49, 55–61 CrossRef CAS.
- M. Li and H. He, Vacuum, 2017, 143, 371–379 CrossRef CAS.
- B. E. Conway, Electrochemical Supercapacitors: Scientific Fundamentals and Technological Applications, Kluwer Academica Plenum Publishers, New York, NY, USA, 1999 Search PubMed.
- Z. Bo, Z. Wen, H. Kim, G. Lu, K. Yu and J. Chen, Carbon, 2012, 50, 4379–4387 CrossRef CAS.
- S. Hussain, R. Amade and E. Bertran, Mater. Chem. Phys., 2014, 148, 914–922 CrossRef CAS.
- C. Masarapu, H. F. Zeng, K. H. Hung and B. Wei, ACS Nano, 2009, 3, 2199–2206 CrossRef CAS PubMed.
- O. Pitkänen, T. Järvinen, H. Cheng, G. S. Lorite, A. Dombovari, L. Rieppo, S. Talapatra, H. M. Duong, G. Tóth, K. L. Juhász, Z. Kónya, A. Kukovecz, P. M. Ajayan, R. Vajtai and K. Kordás, Sci. Rep., 2017, 7, 16594 CrossRef PubMed.
- N. Ouldhamadouche, A. Achour, R. Lucio-Porto, M. Islam, S. Solaymani, A. Arman, A. Ahmadpourian, H. Achour, L. Le Brizoual, M. A. Djouadi and T. Brousse, J. Mater. Sci. Technol., 2018, 34, 976–982 CrossRef.
- X. Cai, R. V. Hansen, L. Zhang, B. Li, C. K. Poh, S. H. Lim, L. Chen, J. Yang, L. Lai, J. Lin and Z. Shen, J. Mater. Chem. A, 2015, 3, 22043–22052 RSC.
- X. Cheng, X. Gui, Z. Lin, Y. Zheng, M. Liu, R. Zhan, Y. Zhu and Z. Tang, J. Mater. Chem. A, 2015, 3, 20927–20934 RSC.
- Z. Ma, X. Huang, S. Dou, J. Wu and S. Wang, J. Phys. Chem. C, 2014, 118, 17231–17239 CrossRef CAS.
Footnote |
| † Electronic supplementary information (ESI) available: EDX mapping of 30 nm and 6 nm Fe2O3@wpCNTs, GIXRD and XRR data for ALD Fe2O3 films and deconvoluted XPS C 1s spectra of ALD Fe2O3@CNTs. See DOI: 10.1039/C9DT04908H |
| This journal is © The Royal Society of Chemistry 2020 |