Fe3O4@GO magnetic nanocomposites protect mesenchymal stem cells and promote osteogenic differentiation of rat bone marrow mesenchymal stem cells†
He
Zhang‡
a,
Sirong
Li‡
b,
Yufeng
Liu
 b,
Yijun
Yu
c,
Shichao
Lin
 b,
Quan
Wang
b,
Leiying
Miao
*c,
Hui
Wei
b,
Quan
Wang
b,
Leiying
Miao
*c,
Hui
Wei
 *bd and
Weibin
Sun
*a
aDepartment of Periodontology, Nanjing Stomatological Hospital, Medical School of Nanjing University, Nanjing, Jiangsu 210093, China
bDepartment of Biomedical Engineering, College of Engineering and Applied Sciences, Nanjing National Laboratory of Microstructures, Jiangsu Key Laboratory of Artificial Functional Materials, Nanjing University, Nanjing, Jiangsu 210093, China. E-mail: weihui@nju.edu.cn
cDepartment of Cariology and Endodontics, Nanjing Stomatological Hospital, Medical School of Nanjing University, Nanjing, Jiangsu 210093, China
dState Key Laboratory of Analytical Chemistry for Life Science and State Key Laboratory of Coordination Chemistry, School of Chemistry and Chemical Engineering, Chemistry and Biomedicine Innovation Center (ChemBIC), Nanjing University, Nanjing, Jiangsu 210023, China
First published on 1st September 2020
Abstract
Fe3O4 nanoparticles (Fe3O4 NPs) are typical magnetic materials for bone tissue regeneration. However, the accompanying oxidative stress during the reaction process of Fe3O4 NPs and H2O2 in bone remodeling and disease may hinder their application. In order to reduce this side effect, we selected graphene oxide (GO) to modify Fe3O4 NPs. We showed that Fe3O4@GO magnetic nanocomposites (Fe3O4@GO MNCs) eliminated 30% of H2O2 in 3 h, and reduced the amount of ˙OH, the intermediate product of the Fenton reaction. The cellular study demonstrated that Fe3O4@GO MNCs reduced the cell damage caused by reactive oxygen species (ROS) and improved the activity of mesenchymal stem cells (MSCs). Moreover, when the magnetic field and bone morphogenetic protein-2 (BMP2) delivered by Fe3O4@GO MNCs worked together, osteogenic differentiation of MSCs in vitro was well promoted.
Introduction
Physical cues such as mechanical,1 electrical,2 and magnetic3 stimulation play a crucial role in manipulating the cell fate processes, such as proliferation,4 differentiation of cells,5 as well as the permeability of ions across the cell membrane.6,7 As early as the last century, static magnetic field (SMF) had been applied to orthodontic treatments,8 demonstrating the clinical feasibility of magnetic stimulation.9,10 Over the decades, magnetic fields in the form of pulse electromagnetic field (PEF) and SMF have been proven to be effective in bone repair and regeneration11,12 because of their ability to promote the osteogenesis of osteoblasts during bone formation.13,14 Exploration of clinical application along with inspiring progress in biomagnetism encouraged researchers to develop magnetic materials as carriers to load stem cells or growth factors for tissue engineering.15 In this regard, some of us recently demonstrated that in the presence of SMF, magnetic electrospun fibrous scaffolds with iron-doped hydroxyapatite not only promoted the proliferation and osteogenic differentiation of loaded mesenchymal stem cells (MSCs) in vitro, but also accelerated bone repair and new bone formation in vivo.16 On the other hand, numerous studies revealed a harsh condition for bone tissue regeneration in which the microenvironment was accompanied by the imbalance of reactive oxygen species (ROS).17,18 Therefore, it is necessary to develop a magnetic responsive scaffold/carrier with ROS modulating capability to mitigate locally excessive ROS and maintain the ability to deliver growth factors simultaneously, which would be beneficial to stem cell protection and bone tissue regeneration.ROS is a family of chemical species with strong oxidizing ability. Important biological molecules such as lipid,19 protein,20 and DNA21 can be damaged by ROS, resulting in a decreased survival rate of endogenous/transplanted stem cells and a lowered delivery efficiency of growth factors (e.g., bone morphogenetic protein-2, BMP2).22,23 Meanwhile, the overproduction of ROS is likely to induce inflammatory reactions and tissue injury,24 which are interrelated in multiple diseases.25–27 Therefore, stabilizing ROS is a prerequisite for bone tissue repair.28 Otherwise, abnormally high oxidative stress triggers cell apoptosis at injured tissues, leading to poor survival of the endogenous/transplanted stem cells or growth factors and finally ending up with low therapeutic efficacy.29,30 On the other hand, a low level of ROS at damaged tissues is beneficial to osteogenic rather than adipogenic differentiation of MSCs.31 Therefore, it is of clinical importance to delicately modulate the ROS level for treating bone diseases.32
Iron oxide nanoparticles (i.e., Fe3O4 NPs) as a classical magnetic material draw great attention since they have been successfully approved in magnetic resonance imaging by the Food and Drug Administration (FDA).33,34 Also, recent studies showed that Fe3O4 NPs exhibit an intrinsic peroxidase-like activity.35,36 This offers a possibility for Fe3O4 NPs to play a dual role in both ROS regulation and magnetic response. However, due to the presence of ferrous ions, Fe3O4 NPs underwent a Fenton like pathway which converted hydrogen peroxide into higher active ˙OH.37 The application of Fe3O4 NPs in oxidative stress environment would be limited by the highly reactive hydroxyl radical formed from the Fenton reaction.38,39 To mitigate the disadvantage of Fe3O4 NPs when applied in complex lesion,40 GO was chosen to capture unwilling ˙OH from the Fenton reaction41,42 and to provide cytoprotection.43 In addition, the large surface to volume ratio endows GO additional drug delivery capacity.44,45
To make full use of these advantages, herein we designed Fe3O4@GO magnetic nanocomposites (Fe3O4@GO MNCs) to work synergistically in bone tissue engineering. The Fe3O4@GO MNCs eliminated active intermediates produced by Fe3O4 in the Fenton reaction by capturing ˙OH, providing a mild scavenging activity to regulate ROS while retaining intrinsic magnetic property. The Fe3O4@GO MNCs showed a cytoprotective effect in vitro. We further loaded BMP2 growth factor onto Fe3O4@GO MNCs, demonstrating the enhanced osteogenic differentiation of MSCs in vitro under magnetic regulation. Our results demonstrated an effective strategy for the protection of endogenous/transplanted stem cells and improvement of the osteogenic effect in tissue engineering by both utilizing the magnetic field and regulating the ROS level (Scheme 1).
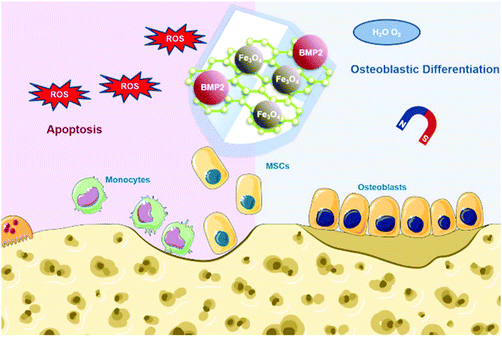 | ||
| Scheme 1 Schematic illustration of Fe3O4@GO/BMP2 protecting mesenchymal stem cells and promoting osteogenic differentiation. | ||
Results and discussion
Characterization of Fe3O4@GO MNCs
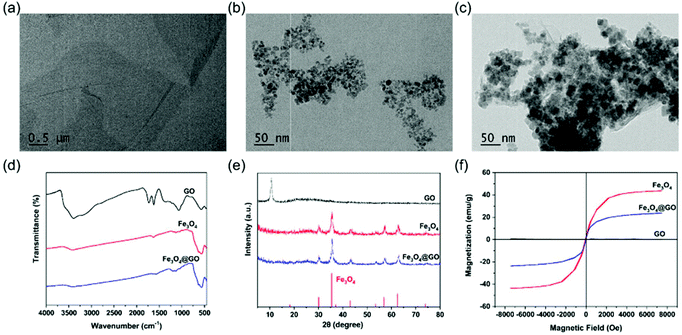
Commercially available GO and Fe3O4@GO MNCs were used. Fe3O4 NPs were synthesized by a hydrothermal method.46 GO, Fe3O4, and Fe3O4@GO MNCs were first characterized by transmission electron microscopy (TEM) imaging. Fig. 1(a) clearly showed a typical GO structure of sheet like regions with a few wrinkles. As shown in Fig. 1(b), irregular Fe3O4 NPs with an average size of 12 nm were observed. For Fe3O4@GO MNCs shown in Fig. 1(c), a large amount of Fe3O4 NPs were observed on sheet like GO. TEM images confirmed the successful assembly of Fe3O4 onto GO to form Fe3O4@GO MNCs. The Fourier transform infrared (FTIR) spectrum of GO (Fig. 1(d)) showed a broad adsorption peak around 3500 cm−1, attributed to the stretching vibration of –COOH and –OH, in line with the negative potential of GO shown in Fig. S2.† The absorption peaks at 2800–3000 cm−1 and 1750 cm−1 were characteristic peaks of the alkyl group and C![[double bond, length as m-dash]](https://www.rsc.org/images/entities/char_e001.gif) O, respectively. The peak at 1358 cm−1 was assigned to the C–O–C stretching vibration. The FTIR spectrum of Fe3O4@GO MNCs showed absorption peaks at 570, 1738, and 3430 cm−1, which corresponded to the stretching vibration peak of Fe–O, C
O, respectively. The peak at 1358 cm−1 was assigned to the C–O–C stretching vibration. The FTIR spectrum of Fe3O4@GO MNCs showed absorption peaks at 570, 1738, and 3430 cm−1, which corresponded to the stretching vibration peak of Fe–O, C![[double bond, length as m-dash]](https://www.rsc.org/images/entities/char_e001.gif) O, and O–H, respectively. Powder X-ray diffraction (PXRD) was also used to determine the chemical composition and phase purity of Fe3O4@GO MNCs. Fig. 1(e) shows the diffraction peak of GO (black line) at 2θ = 11.7°, and there was a broad diffraction peak at 2θ = 24.8°. Fe3O4@GO MNCs (blue line) retained the characteristic diffraction peaks of Fe3O4 (red line) at 2θ = 30°, 35°, 43°, 57°, and 63°. The XRD profile of GO exhibited a strong single reflection at 2θ = 11.7°, which corresponds to an interlayer d001 spacing of 0.8 nm. This spacing is in line with the XRD characteristic values for GO in previous reports.47,48 Although it was not obvious to see the XRD peak of GO in the curve of Fe3O4@GO MNCs, FTIR and XPS results still clearly demonstrated the presence of GO in Fe3O4@GO MNCs. We attributed the missing peak of GO at 11.7° to the great amount difference between Fe3O4 and GO, which can be proved in TEM imaging. In Fig. 1c, most of the GO was shielded by Fe3O4, thereby weakening the XRD signal of GO. A similar shielding effect of XRD in Fe3O4@GO MNCs was also found in a previous report.49 The hysteresis loops in Fig. 1(f) show the retained superparamagnetic behavior of Fe3O4@GO MNCs (blue line), which was derived from Fe3O4 (red line). The saturation magnetization of Fe3O4@GO MNCs was about 23 emu g−1, while that of Fe3O4 reached about 43 emu g−1.
O, and O–H, respectively. Powder X-ray diffraction (PXRD) was also used to determine the chemical composition and phase purity of Fe3O4@GO MNCs. Fig. 1(e) shows the diffraction peak of GO (black line) at 2θ = 11.7°, and there was a broad diffraction peak at 2θ = 24.8°. Fe3O4@GO MNCs (blue line) retained the characteristic diffraction peaks of Fe3O4 (red line) at 2θ = 30°, 35°, 43°, 57°, and 63°. The XRD profile of GO exhibited a strong single reflection at 2θ = 11.7°, which corresponds to an interlayer d001 spacing of 0.8 nm. This spacing is in line with the XRD characteristic values for GO in previous reports.47,48 Although it was not obvious to see the XRD peak of GO in the curve of Fe3O4@GO MNCs, FTIR and XPS results still clearly demonstrated the presence of GO in Fe3O4@GO MNCs. We attributed the missing peak of GO at 11.7° to the great amount difference between Fe3O4 and GO, which can be proved in TEM imaging. In Fig. 1c, most of the GO was shielded by Fe3O4, thereby weakening the XRD signal of GO. A similar shielding effect of XRD in Fe3O4@GO MNCs was also found in a previous report.49 The hysteresis loops in Fig. 1(f) show the retained superparamagnetic behavior of Fe3O4@GO MNCs (blue line), which was derived from Fe3O4 (red line). The saturation magnetization of Fe3O4@GO MNCs was about 23 emu g−1, while that of Fe3O4 reached about 43 emu g−1.
H2O2 and hydroxyl radical scavenging activity of Fe3O4@GO MNCs
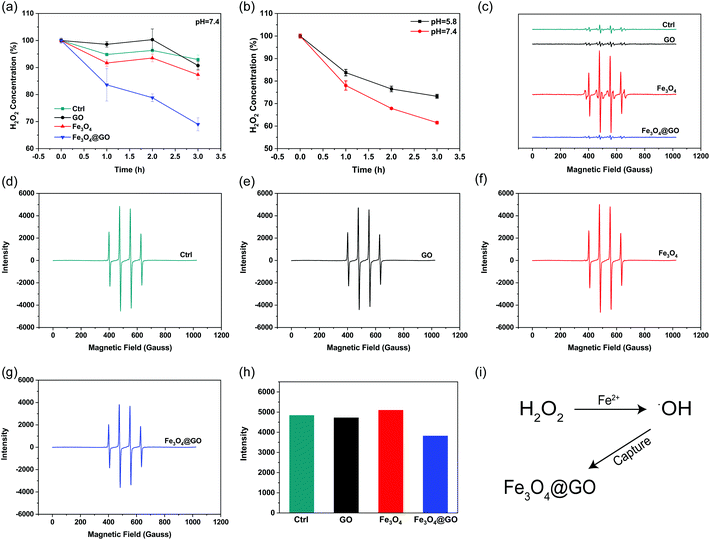
H2O2, a sort of highly oxidative ROS, has been found to be closely related to tissue damage. We used the Ti(SO4)2 method to detect the hydrogen peroxide scavenging activity of Fe3O4@GO MNCs by monitoring the colorimetric signal at 405 nm, which originated from the yellowish oxidized product of Ti(SO4)2 in the presence of H2O2. To mimic the mild environment in the organism, this reaction was carried out in a buffer at pH 7.4. As shown in Fig. 2(a), both Fe3O4@GO MNCs (blue line) and Fe3O4 (red line) exhibited H2O2 scavenging activity within 3 h. Notably, Fe3O4@GO MNCs scavenged more than 30% of H2O2 within 3 h while Fe3O4 scavenged less than 15% of H2O2. This result showed the much higher H2O2 scavenging activity of Fe3O4@GO MNCs than Fe3O4 at pH 7.4. As a comparison, GO showed negligible H2O2 scavenging activity. Moreover, to better mimic the acidic environment of inflammation, the H2O2 scavenging activity of the three materials was also investigated at pH 5.8 and a similar trend was obtained (Fig. S3†). Strikingly, as shown in Fig. 2(b), Fe3O4@GO MNCs presented better activity on degrading H2O2 at pH 7.4 (red line).˙OH is a stronger ROS which could be generated from the Fe3O4-mediated Fenton reaction. Effective scavenging/capturing of ˙OH is beneficial for protecting cells and growth factors from ROS-induced damage. To characterize the ˙OH scavenging ability of Fe3O4@GO MNCs, electron paramagnetic resonance spectroscopy (EPR) was applied with a capture agent 5,5-dimethyl-1-pyridine N-oxide (DMPO) which can specifically capture ˙OH, and generate resultant DMPO/˙OH with distinct characteristic lines of 1![[thin space (1/6-em)]](https://www.rsc.org/images/entities/char_2009.gif) :
:![[thin space (1/6-em)]](https://www.rsc.org/images/entities/char_2009.gif) 2
2![[thin space (1/6-em)]](https://www.rsc.org/images/entities/char_2009.gif) :
:![[thin space (1/6-em)]](https://www.rsc.org/images/entities/char_2009.gif) 2
2![[thin space (1/6-em)]](https://www.rsc.org/images/entities/char_2009.gif) :
:![[thin space (1/6-em)]](https://www.rsc.org/images/entities/char_2009.gif) 1. The strength of the characteristic peak was used for quantitatively monitoring ˙OH levels. As shown in Fig. 2(c), the reaction of Fe3O4 with H2O2 produced a large amount of ˙OH radicals (red line). In contrast, the reaction of Fe3O4@GO MNCs (blue line) or GO (black line) with H2O2 produced very similar peak signals to the control (H2O2 alone, green line), indicating that almost no ˙OH was produced in the reactions. This result demonstrated that the ROS regulation ability of Fe3O4@GO MNCs could eliminate the ˙OH radicals in situ produced by Fe3O4. To further confirm the ˙OH radical scavenging ability of Fe3O4@GO MNCs, FeSO4 and H2O2 (1
1. The strength of the characteristic peak was used for quantitatively monitoring ˙OH levels. As shown in Fig. 2(c), the reaction of Fe3O4 with H2O2 produced a large amount of ˙OH radicals (red line). In contrast, the reaction of Fe3O4@GO MNCs (blue line) or GO (black line) with H2O2 produced very similar peak signals to the control (H2O2 alone, green line), indicating that almost no ˙OH was produced in the reactions. This result demonstrated that the ROS regulation ability of Fe3O4@GO MNCs could eliminate the ˙OH radicals in situ produced by Fe3O4. To further confirm the ˙OH radical scavenging ability of Fe3O4@GO MNCs, FeSO4 and H2O2 (1![[thin space (1/6-em)]](https://www.rsc.org/images/entities/char_2009.gif) :
:![[thin space (1/6-em)]](https://www.rsc.org/images/entities/char_2009.gif) 1) were mixed with NPs and the level of ˙OH radicals was detected by measurement of EPR. Interestingly, there was no significant difference in the peak intensity of DMPO/˙OH for GO (Fig. 2(e)) and Fe3O4 (Fig. 2(f)) groups, compared to the control group (Fig. 2(d)), while Fe3O4@GO MNCs (Fig. 2(g) and (h)) obviously reduced ˙OH radicals. The above results indicated that Fe3O4@GO MNCs not only scavenged the in situ generated ˙OH, but also scavenged ˙OH radicals in the environment. The above results indicated that Fe3O4@GO MNCs do not produce ˙OH even in the presence of H2O2 in a biological environment. Although Fe3O4@GO MNCs did not exhibit high SOD-like activity (Fig. S4†), they regulated ROS through their H2O2 scavenging activity and ˙OH scavenging activity.
1) were mixed with NPs and the level of ˙OH radicals was detected by measurement of EPR. Interestingly, there was no significant difference in the peak intensity of DMPO/˙OH for GO (Fig. 2(e)) and Fe3O4 (Fig. 2(f)) groups, compared to the control group (Fig. 2(d)), while Fe3O4@GO MNCs (Fig. 2(g) and (h)) obviously reduced ˙OH radicals. The above results indicated that Fe3O4@GO MNCs not only scavenged the in situ generated ˙OH, but also scavenged ˙OH radicals in the environment. The above results indicated that Fe3O4@GO MNCs do not produce ˙OH even in the presence of H2O2 in a biological environment. Although Fe3O4@GO MNCs did not exhibit high SOD-like activity (Fig. S4†), they regulated ROS through their H2O2 scavenging activity and ˙OH scavenging activity.
Intracellular ROS scavenging
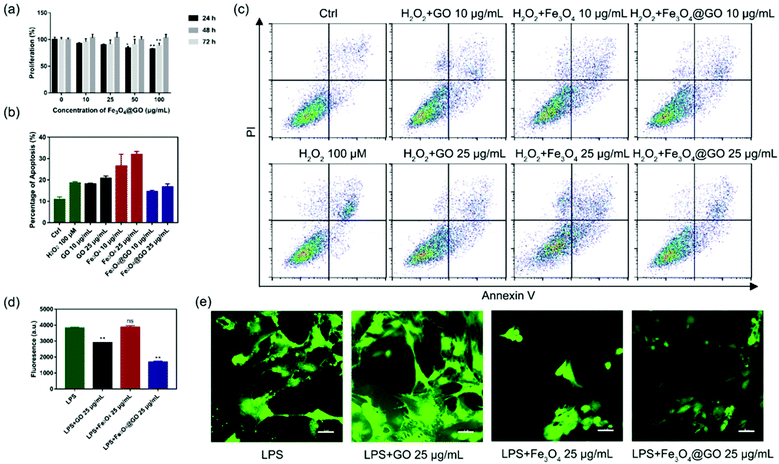
Based on the enzyme-like activity of Fe3O4@GO MNCs, we attempted to apply the nanomaterial to biological environments. The cytotoxicity of Fe3O4@GO MNCs was first evaluated by using the Cell Counting Kit-8 (CCK-8) assay. As shown in Fig. 3(a), MSCs steadily proliferated when incubated with different concentrations of Fe3O4@GO MNCs, and there were no significant differences among 10 and 25 μg mL−1 at each time point. The CCK-8 assay demonstrated the good biocompatibility of Fe3O4@GO MNCs.After confirmation of the good biocompatibility of Fe3O4@GO MNCs, we further explored whether Fe3O4@GO MNCs could protect the transplanted MSCs from ROS-induced apoptosis. To mimic ROS in a biological environment, we used different concentrations of H2O2 to induce apoptosis and analyzed the proportion of apoptosis by using flow cytometry (Fig. S5†). A sublethal dose of H2O2 (100 μM) was selected for following research. Furthermore, we incubated NPs with 100 μM H2O2 pre-treated MSCs. According to the results shown in Fig. 3(b) and (c), Fe3O4@GO MNCs reduced apoptosis caused by H2O2, showing protection on MSCs (Fig. S6†). Interesting, a low concentration of Fe3O4@GO MNCs (10 μg mL−1) even showed better cytoprotection than a high concentration (25 μg mL−1). However, there was no protection effect in either Fe3O4 or GO (10 μg mL−1 and 25 μg mL−1).
Considering that complex tissue regeneration environments are often accompanied by inflammation, a LPS induced inflammation model was established to investigate whether ROS regulated Fe3O4@GO MNCs have anti-inflammation effect. Again, a sublethal concentration of LPS was used to stimulate MSCs. Then 2′,7′-dichlorofluorescein diacetate (DCFH-DA) was used as a fluorescent probe to monitor the intracellular ROS level. Fluorescence images (Fig. 3(d) and (e)) confirmed the increased ROS level in the LPS-treated group, excluding the possibility that nanomaterials induced ROS (Fig. S8†). What's more, Fe3O4@GO MNCs effectively reduced ROS with lower fluorescence intensity. However, the Fe3O4 group showed an enhancement of fluorescence and changes in cell morphology. These results revealed the ability of Fe3O4@GO MNCs to protect MSCs by scavenging intercellular ROS, which ultimately led to higher survival and therapeutic efficacy of the transplanted MSCs.
Fe3O4@GO MNCs induced osteogenic differentiation of MSCs
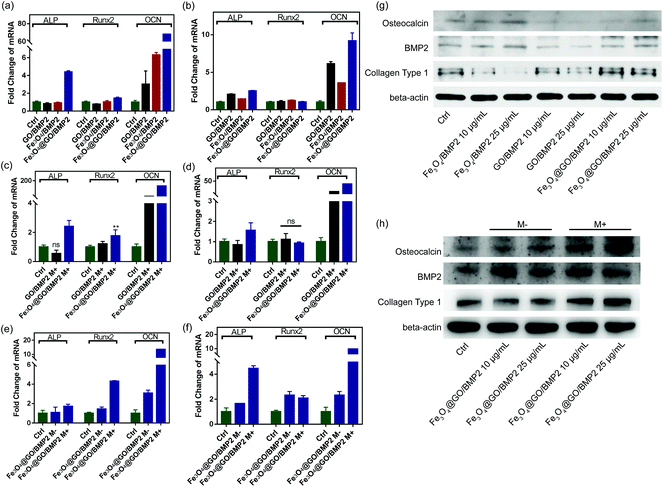
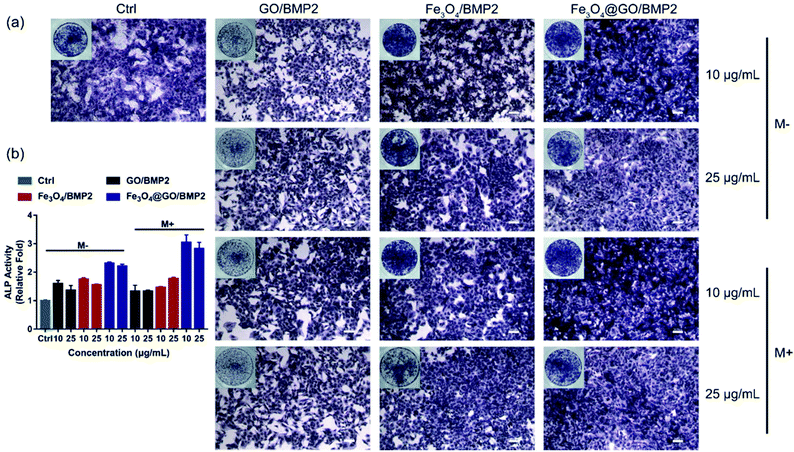
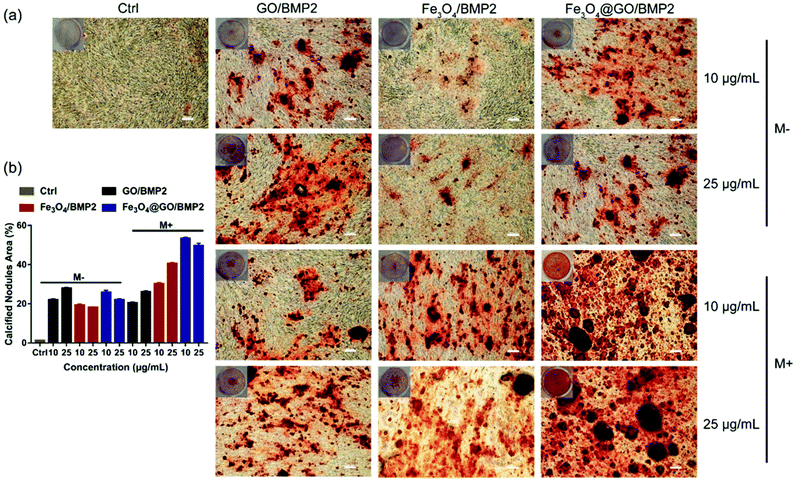
In order to create an osteogenic favored artificial environment under complicated pathological conditions, we not only utilized the magnetic responsiveness from Fe3O4, but also took advantage of the delivery ability from GO. First, BMP2, a classic growth factor with excellent osteogenic induction capacity, was loaded on Fe3O4@GO to fabricate Fe3O4@GO/BMP2 by incubating Fe3O4@GO MNCs with BMP2 solution for 24 h. Subsequently, we evaluated the amount of BMP2 loaded onto the NPs by a centrifugation analysis. After centrifugation, the residual BMP2 in the supernatant was stained with Coomassie Brilliant Blue G250. The concentrations of BMP2 loaded by NPs used for MSC cultures can then be calculated with reference to the standard curve. As shown in Fig. S9,† Fe3O4@GO MNCs showed higher BMP2 loading than Fe3O4 NPs, where 330 ng mL−1, 250 ng mL−1, and 167 ng mL−1 of BMP2 were loaded by 25 μg mL−1 of Fe3O4, GO, and Fe3O4@GO, respectively. The BMP2 loading capability of NPs was well correlated with the zeta potential results, where the more negatively charged NPs had a higher loading capacity of BMP2 (Fig. S2†). Next, we co-cultured MSCs with NPs/BMP2. The RNA level of osteogenic markers was detected 7 d later. It can be found that Fe3O4@GO/BMP2 had a good advantage in promoting osteogenic differentiation of MSC cells, no matter at a low concentration (10 μg mL−1) (Fig. 4(a)) or at a high concentration (25 μg mL−1, Fig. 4(b)). Furthermore, to detect the effects of magnetic field response from NPs on osteogenic induction, we co-cultured MSCs with Fe3O4@GO/BMP2 and GO/BMP2 under a magnetic field. Apparently, Fe3O4@GO/BMP2 with magnetic responsiveness had superior osteogenic ability to GO/BMP2 without magnetic responsiveness (Fig. 4(c) and (d)). This advantage was more prominent at the lower concentration (10 μg mL−1) (Fig. 4(c)). We further compared the osteogenic induction results of two concentrations of Fe3O4@GO/BMP2 (Fig. 4(e) and (f)). RT-PCR results showed that both of the two concentrations showed good osteogenic capacity. The results of western blot (Fig. 4(g) and (h)) are consistent with the above results. Besides, staining alkaline phosphatase (ALP) (Fig. 5) showed that Fe3O4@GO/BMP2 exhibited better osteogenic ability than GO/BMP2 and Fe3O4/BMP2. Moreover, this advantage of Fe3O4@GO/BMP2 became more pronounced with the use of SMF, and the alizarin red staining and quantification of calcium nodule formation (Fig. 6) as a late osteogenic signal also demonstrated that Fe3O4@GO/BMP2 possessed better osteogenic ability with SMF.Experimental
Chemicals
GO was provided by Hangzhou Gaoxi Technology Co., Ltd. Fe3O4@GO MNCs was provided by Nanjing XFNANO Materials Tech. Co., Ltd. Titanium sulfate (Ti(SO4)2) was purchased from Shanghai Macklin Biochemical Co., Ltd. Hydrogen peroxide (H2O2, 30%) and dihydroethidine were purchased from Aladdin Chemical Reagent Co., Ltd. Xanthine and xanthine oxidase were obtained from Sigma-Aldrich. 5,5-Dimethyl-1-pyridine N-oxide (DMPO) was purchased from Nanjing Tongquan Chemical Reagent Co., Ltd. 2′,7′-Dichlorofluorescein diacetate (DCFH-DA) and BCIP/NBT Alkaline Phosphatase Color Development Kit were purchased from Beyotime Chemical Reagent Co., Ltd. Cell Counting Kit-8 (CCK-8) was purchased from KeyGen Biotech Co., Ltd. Annexin V-FITC/PI Apoptosis Detection Kit and SYBR Green PCR Master Mix were purchased from Vazyme Biotech Co., Ltd. Trizol reagent was purchased from Invitrogen Life Technology Co., Ltd. All chemical regents were used as received without further purification. All aqueous solutions were prepared with deionized water (18.2 MΩ cm, Millipore).Instrumentation
Transmission electron microscopy (TEM) (Tecnai F20) was used at an acceleration voltage of 200 kV. Powder X-ray diffraction (PXRD) data were obtained on a Rigaku Ultima diffractometer by using Cu Kα radiation. X-ray photoelectron spectroscopy (XPS) was performed using a PHI 5000 VersaProbe (UlVAC-PHI, Japan). Electron paramagnetic resonance (EPR) spectra were recorded by using an EMX-10/12 EPR spectrometer (Bruker, Germany). Fluorescence microscopy images were captured by using a confocal fluorescence microscope (CFM, A1, Nikon, Japan).Preparation of Fe3O4 NPs
Fe3O4 NPs were prepared following a reported method.46 FeCl2 (0.2 M, 1.0 mL) and FeCl3 solutions (0.1 M, 4.0 mL) were first mixed under nitrogen gas. Aqueous ammonia (0.2 M, 15 mL) was added dropwise to the mixture under stirring. Then the mixture was heated under nitrogen at 80 °C for 1 h. After cooling to room temperature, the obtained Fe3O4 NPs were centrifuged and washed with Milli-Q water.Hydrogen peroxide scavenging activity of NPs
The hydrogen peroxide scavenging activity of NPs was studied by measuring the consumption of H2O2 by the Ti(SO4)2 colorimetric method.50 First, NPs of different concentrations (10 μg mL−1 and 25 μg mL−1) were mixed with 5 mL of H2O2 (1 × 10⁻³ M) and then incubated together at 37 °C with shaking, and marked as solution A. 1.33 mL of Ti(SO4)2 (24%) and 8.33 mL of H2SO4 were added to water to obtain 50 mL of solution B. Then 100 μL of solution A was mixed with 200 μL of solution B thoroughly. After 10 min, NPs were removed by centrifugation, and the absorbance at 405 nm of the supernatant was measured using a UV–Vis spectrophotometer to detect the remaining H2O2. Time dependent hydrogen peroxide scavenging activity was recorded as described every 1 h.Hydroxyl radical scavenging activity of NPs
The ˙OH was detected by using EPR, where the DMPO/˙OH spin adduct was produced and had characteristic lines with relative intensities of 1![[thin space (1/6-em)]](https://www.rsc.org/images/entities/char_2009.gif) :
:![[thin space (1/6-em)]](https://www.rsc.org/images/entities/char_2009.gif) 2
2![[thin space (1/6-em)]](https://www.rsc.org/images/entities/char_2009.gif) :
:![[thin space (1/6-em)]](https://www.rsc.org/images/entities/char_2009.gif) 2
2![[thin space (1/6-em)]](https://www.rsc.org/images/entities/char_2009.gif) :
:![[thin space (1/6-em)]](https://www.rsc.org/images/entities/char_2009.gif) 1. The NPs were added into Fenton agents of 0.2 mM FeSO4 and 0.2 mM H2O2 for 2 min. Subsequently, samples were detected by EPR.
1. The NPs were added into Fenton agents of 0.2 mM FeSO4 and 0.2 mM H2O2 for 2 min. Subsequently, samples were detected by EPR.
Measurement of SOD-like activity
Xanthine and xanthine oxidase were reacted in phosphate buffer (0.1 M, pH 7.4, 37 °C) for 1 h to produce ˙O2−.51 At the same time, a certain amount of nanomaterials was added to eliminate the generated ˙O2−. Forty minutes later, 0.5 mg mL−1 dihydroethidine (HE) in dimethyl sulfoxide was added. After further incubation for 40 min at 37 °C, the fluorescence of the final mixture was measured.Cytotoxicity assay
Cytotoxicity of nanocomposites was tested by using the Cell Counting Kit-8 assay. MSCs (3 × 10³ per well) were cultured in 96-well plates at 37 °C and 5% CO2. Then, 10 μL of CCK-8 solution was added to the medium of cells. The absorbance at 450 nm was measured after incubation for 2 h.Flow cytometry analysis of apoptosis
Treated MSCs were collected and washed with PBS, then resuspended in binding buffer. Next, MSCs were incubated with fluorescein-labelled Annexin V and propidium iodide (PI) prior to flow cytometry. An FITC signal detector (FL1, 525 nm) and a detector reserved for phycoerythrin emission (FL2, 575 nm) were used to determine two kinds of signals. Analysis of data was performed by using CellQuest Software from BD.PCR analysis
Total RNA was extracted by using Trizol reagent. Then RNA was reversely transcribed to cDNA by using a PrimeScript™ II First-Strand Synthesis System. qPCR was performed by using SYBR Green PCR Master Mix, and the resulting Ct values were normalized to GAPDH. All primer sequences are provided in Table 1.| Gene | Primer sequence |
|---|---|
| β-Actin | Forward 5′-GGAGATTACTGCCCTGGCTCCTA-3′ |
| Reverse 5′-GACTCATCGTACTCCTGCTTGCTG-3′ | |
| ALP | Forward 5′-CATCGCCTATCAGCTAATGCACA-3′ |
| Reverse 5′-ATGAGGTCCAGGCCATCCAG-3′ | |
| Runx2 | Forward 5′-CATGGCCGGGAATGATGAG-3′ |
| Reverse 5′-TGTGAAGACCGTTATGGTCAAAGTG-3′ | |
| OCN | Forward 5′-ATGAGGACCCTCTCTCTGCTC-3′ |
| Reverse 5′-CTAAACGGTGGTGCCATAGAT-3′ |
Statistical analysis
Statistical analyses were performed by using GraphPad Prism 7.0. Data were represented as the mean ± standard deviation. One-way analysis of variance (ANOVA) was performed to evaluate the effect of NPs. p values <0.05 were considered statistically significant.Conclusions
In conclusion, ROS scavenging Fe3O4@GO MNCs were developed. GO effectively reduced the hydroxyl radicals which were produced by the Fe3O4-mediated Fenton reaction, and thus resulted in moderate scavenging of ROS. Because of the ROS scavenging and magnetic properties, the Fe3O4@GO MNCs protected the MSCs from ROS damage. When delivered by using Fe3O4@GO MNCs, BMP2 functioned in the inflammatory and oxidative stress environment involved in tissue damage. In addition, SMF as a non-invasive stimulation enhanced osteogenic ability in vitro. This work not only developed a method to fabricate multifunctional nanocomposites, but also proved the delicate regulation of ROS level by Fe3O4@GO MNCs, a prerequisite in the field of tissue regeneration, especially for stem cell implantation and growth factor delivery.Conflicts of interest
The manuscript was written through contributions of all authors. All authors have given approval to the final version of the manuscript. There are no conflicts to declare.Acknowledgements
This work was supported by the Medical Science and Technology Development Foundation, Nanjing Department of Health (YKK18126), Scientific Research Foundation of Graduate School of Nanjing University (2017CL12), National Natural Science Foundation of China (51772144), Project of Invigorating Health Care through Science, Technology and Education Jiangsu Provincial Medical Youth Talent (QNRC2016120).Notes and references
- S. D. Subramony, B. R. Dargis, M. Castillo, E. U. Azeloglu, M. S. Tracey, A. Su and H. H. Lu, Biomaterials, 2013, 34, 1942–1953 Search PubMed.
- M. De Mattei, A. Caruso, G. C. Traina, F. Pezzetti, T. Baroni and V. Sollazzo, Bioelectromagnetics, 1999, 20, 177–182 Search PubMed.
- K. J. McLeod and L. Collazo, Radiat. Res., 2000, 153, 706–714 Search PubMed.
- T. A. Ulrich, E. M. de Juan Pardo and S. Kumar, Cancer Res., 2009, 69, 4167–4174 Search PubMed.
- G. Altman, R. Horan, I. Martin, J. Farhadi, P. Stark, V. Volloch, J. Richmond, G. Vunjak-Novakpvic and D. L. Kaplan, FASEB J., 2002, 16, 270–272 Search PubMed.
- H. Huang, S. Delikanli, H. Zeng, D. M. Ferkey and A. Pralle, Nat. Nanotechnol., 2010, 5, 602–606 Search PubMed.
- C. Shuai, L. Yu, P. Feng, Y. Zhong, Z. Zhao, Z. Chen and W. Yang, Mater. Chem. Front., 2020, 4, 2398–2408 Search PubMed.
- J. H. Noar and R. D. Evans, Br. J. Orthod., 1999, 26, 29–37 Search PubMed.
- D. H. Trock, Rheum. Dis. Clin. North Am., 2000, 26, 51–62 Search PubMed.
- B. Thiesen and A. Jordan, Int. J. Hyperthermia, 2008, 24, 467–474 Search PubMed.
- H. Kotani, H. Kawaguchi, T. Shimoaka, M. Iwasaka, S. Ueno, H. Ozawa, K. Nakamura and K. Hoshi, J. Bone Miner. Res., 2002, 17, 1814–1821 Search PubMed.
- C. A. L. Bassett, S. N. Mitchell and S. R. Gaston, J. Am. Med. Assoc., 1982, 247, 623–628 Search PubMed.
- S. Hao, J. Meng, Y. Zhang, J. Liu, X. Nie, F. Wu, Y. Yang, C. Wang, N. Gu and H. Xu, Biomaterials, 2017, 140, 16–25 Search PubMed.
- C. Shuai, W. Yang, C. He, S. Peng, C. Gao, Y. Yang, F. Qi and P. Feng, Mater. Des., 2020, 185, 108275 Search PubMed.
- W. Zhang, G. Yang, X. Wang, L. Jiang, F. Jiang, G. Li, Z. Zhang and X. Jiang, Adv. Mater., 2017, 29, 1703795 Search PubMed.
- Y. Yu, S. Ren, Y. Yao, H. Zhang, C. Liu, J. Yang, W. Yang and L. Miao, J. Biomed. Nanotechnol., 2017, 13, 835–847 Search PubMed.
- H. Isomura, K. Fujie, K. Shibata, N. Inoue, T. Iizuka, G. Takebe, K. Takahashi, J. Nishihira, H. Izumi and W. Sakamoto, Toxicology, 2004, 197, 92–99 Search PubMed.
- Y. Hamada, H. Fujii and M. Fukagawa, Bone, 2009, 45, S35–S38 Search PubMed.
- S. Leutner, A. Eckert and W. Müller, J. Neural Transm., 2001, 108, 955–967 Search PubMed.
- E. Cabiscol, J. Tamarit and J. Ros, Int. Microbiol., 2000, 3(1), 3–8 Search PubMed.
- R. A. Floyd and K. Hensley, Neurobiol. Aging, 2002, 23, 795–807 Search PubMed.
- K. Ito, A. Hirao, F. Arai, K. Takubo, S. Matsuoka, K. Miyamoto, M. Ohmura, K. Naka, K. Hosokawa and Y. Ikeda, Nat. Med., 2006, 12, 446–451 Search PubMed.
- E. R. Stadtman, Free Radical Biol. Med., 1990, 9, 315–325 Search PubMed.
- D. Brown, K. Donaldson, P. Borm, R. Schins, M. Dehnhardt, P. Gilmour, L. Jimenez and V. Stone, Am. J. Physiol.: Lung Cell. Mol. Physiol., 2004, 286, L344–L353 Search PubMed.
- S. Basu, K. Michaëlsson, H. Olofsson, S. Johansson and H. Melhus, Biochem. Biophys. Res. Commun., 2001, 288, 275–279 Search PubMed.
- S. Reuter, S. C. Gupta, M. M. Chaturvedi and B. B. Aggarwal, Free Radical Biol. Med., 2010, 49, 1603–1616 Search PubMed.
- I. L. Chapple and J. B. Matthews, Periodontology 2000, 2007, 43, 160–232 Search PubMed.
- P. Jia, Y. J. Xu, Z. L. Zhang, K. Li, B. Li, W. Zhang and H. Yang, J. Orthop. Res., 2012, 30, 1843–1852 Search PubMed.
- J. Hoffmann, A. J. Glassford, T. C. Doyle, R. C. Robbins, S. Schrepfer and M. P. Pelletier, Thorac. Cardiovasc. Surg., 2010, 58, 136–142 Search PubMed.
- P. K. Nguyen, J. Riegler and J. C. Wu, Cell Stem Cell, 2014, 14, 431–444 Search PubMed.
- F. Atashi, A. Modarressi and M. S. Pepper, Stem Cells Dev., 2015, 24, 1150–1163 Search PubMed.
- F. Wauquier, L. Leotoing, V. Coxam, J. Guicheux and Y. Wittrant, Trends Mol. Med., 2009, 15, 468–477 Search PubMed.
- I. J. M. De Vries, W. J. Lesterhuis, J. O. Barentsz, P. Verdijk, J. H. Van Krieken, O. C. Boerman, W. J. Oyen, J. J. Bonenkamp, J. B. Boezeman, G. J. Adema, J. W. Bulte, T. W. Scheenen, C. J. Punt, A. Heerschap and C. G. Figdor, Nat. Biotechnol., 2005, 23, 1407–1413 Search PubMed.
- D. Liu, W. Wu, J. Ling, S. Wen, N. Gu and X. Zhang, Adv. Funct. Mater., 2011, 21, 1498–1504 Search PubMed.
- L. Gao, J. Zhuang, L. Nie, J. Zhang, Y. Zhang, N. Gu, T. Wang, J. Feng, D. Yang, S. Perrett and X. Yan, Nat. Nanotechnol., 2007, 2, 577–583 Search PubMed.
- H. Wei and E. Wang, Anal. Chem., 2008, 80, 2250–2254 Search PubMed.
- H. Wei and E. Wang, Chem. Soc. Rev., 2013, 42, 6060–6093 Search PubMed.
- N. Singh, G. J. Jenkins, R. Asadi and S. H. Doak, Nano Rev., 2010, 1, 5358 Search PubMed.
- J. A. Imlay, S. M. Chin and S. Linn, Science, 1988, 240, 640–642 Search PubMed.
- B. Yang, Y. Chen and J. Shi, Chem. Rev., 2019, 119, 4881–4985 Search PubMed.
- Y. Song, K. Qu, C. Zhao, J. Ren and X. Qu, Adv. Mater., 2010, 22, 2206–2210 Search PubMed.
- Y. Qiu, Z. Wang, A. C. Owens, I. Kulaots, Y. Chen, A. B. Kane and R. H. Hurt, Nanoscale, 2014, 6, 11744–11755 Search PubMed.
- J. Park, B. Kim, J. Han, J. Oh, S. Park, S. Ryu, S. Jung, J.-Y. Shin, B. S. Lee and B. H. Hong, ACS Nano, 2015, 9, 4987–4999 Search PubMed.
- W. G. La, S. Park, H. H. Yoon, G. J. Jeong, T. J. Lee, S. H. Bhang, J. Y. Han, K. Char and B. S. Kim, Small, 2013, 9, 4051–4060 Search PubMed.
- L. Feng, L. Wu and X. Qu, Adv. Mater., 2013, 25, 168–186 Search PubMed.
- Z. Zhang, X. Zhang, B. Liu and J. Liu, J. Am. Chem. Soc., 2017, 139, 5412–5419 Search PubMed.
- X. Qi, K. Y. Pu, X. Zhou, H. Li, B. Liu, F. Boey, W. Huang and H. Zhang, Small, 2010, 6, 663–669 Search PubMed.
- Y. Guo, X. Sun, Y. Liu, W. Wang, H. Qiu and J. Gao, Carbon, 2012, 50, 2513–2523 Search PubMed.
- W. Zhang, G. Yang, X. Wang, L. Jiang, F. Jiang, G. Li, Z. Zhang and X. Jiang, Adv. Mater., 2017, 29, 1703795 Search PubMed.
- J. Kim, H. R. Cho, H. Jeon, D. Kim, C. Song, N. Lee, S. H. Choi and T. Hyeon, J. Am. Chem. Soc., 2017, 139, 10992–10995 Search PubMed.
- J. J. Hu, N.-K. Wong, S. Ye, X. Chen, M.-Y. Lu, A. Q. Zhao, Y. Guo, A. C.-H. Ma, A. Y.-H. Leung and J. Shen, J. Am. Chem. Soc., 2015, 137, 6837–6843 Search PubMed.
Footnotes |
| † Electronic supplementary information (ESI) available. See DOI: 10.1039/d0bm00906g |
| ‡ These authors contributed equally. |
| This journal is © The Royal Society of Chemistry 2020 |

