Orientation–polarization dependence of pressure-induced Raman anomalies in anisotropic 2D ReS2†
Ting
Wen
,
Maodi
Zhang
,
Jing
Li
,
Chenyin
Jiao
,
Shenghai
Pei
,
Zenghui
Wang
* and
Juan
Xia
 *
*
Institute of Fundamental and Frontier Sciences, University of Electronic Science and Technology of China, Chengdu 610054, China. E-mail: zenghui.wang@uestc.edu.cn; juanxia@uestc.edu.cn
First published on 7th February 2023
Abstract
We report an in situ high-pressure (0–30.24 GPa) optical study of the 2D ReS2 crystal under four specific configurations of sample orientation and laser polarization. Unlike the horizontal measurement configuration that has been widely used, under the vertical sample configuration we observe the anomalous disappearance behavior of Raman modes. Through analyzing the peak evolution under different configurations with tensor calculations, we identify the effect of pressure on different components in the full 3 × 3 Raman tensor of the anisotropic ReS2 crystal. These results provide new evidence on the remarkable tunability of pressure engineering on the crystal structure, and our methods offer an additional degree of freedom for studying pressure engineering on 2D anisotropic materials.
New conceptsIn this manuscript, we report an in situ high-pressure (0–30.24 GPa) optical study of the 2D ReS2 crystal under four specific configurations of sample orientation and laser polarization. For the first time, we observe the anomalous disappearance behavior of Raman modes under the vertical sample configuration, unlike the horizontal measurement configuration that has been widely used so far. Through analyzing the peak evolution under different configurations with tensor calculations, we successfully identify the effect of pressure on individual components in the full 3 × 3 Raman tensor of the anisotropic ReS2 crystal, which is unachievable via typical polarized measurements that can only resolve the reduced 2 × 2 tensor. These results provide new evidence on the remarkable tunability of pressure engineering on the crystal structure, and our methods offer an additional degree of freedom for studying pressure engineering on 2D anisotropic materials. We believe that this work will be of broad and great interest, and will have an important impact in the areas of material anisotropy, 2D crystals, pressure engineering, phase transitions and Raman spectroscopy. |
Introduction
The two-dimensional (2D) semiconductor rhenium disulfide (ReS2) exhibits excellent properties, including an atomically thin material thickness, a tunable bandgap, high flexibility, and structural anisotropy.1,2 In particular, the ReS2 crystal possesses reduced crystal symmetry (known as triclinic symmetry) and thus exhibits high in-plane anisotropy.3,4 This intrinsic anisotropy offers unique opportunities for exploring new physics, novel device designs and potential applications.5,6The strong anisotropy in the ReS2 crystal has prompted extensive polarized Raman studies and theoretical analysis focusing on the in-plane orientation.7,8 For example, in-plane optical and thermoelectric anisotropy have been widely investigated in ReS2 crystals.8–11 By contrast, researchers have rarely explored anisotropy in ReS2 crystals with the out-of-plane orientation, which could potentially give rise to attractive phenomena and delicate physics.12,13
Meanwhile, pressure engineering is highly effective for tuning the symmetry and anisotropy in 2D crystals, and has led to the observation of intriguing physics such as phase transitions,12 2D–3D structure transitions,14 metallization,15 and superconductivity.16 In particular, pressure-induced anisotropy enhancement in ReS2 crystals has recently been demonstrated.17 However, studies on the pressure engineering of ReS2 using the out-of-plane orientation have remained elusive, and such studies could potentially reveal previously unobserved phenomena, leading to a deeper understanding of the underlying physics.
In our study, we report a high-pressure (0–30.24 GPa) study of the structural, electronic and optical properties of the 2D ReS2 crystal, with both in-plane and out-of-plane orientations and different laser polarizations. We observe a clear dependence of the Raman modes on the orientation–polarization configurations, revealing the importance of orientation on the phase transition features, and the unique effects of the phase transition on the individual Raman modes. Our findings unveil the effect of pressure on all the components in the full 3 × 3 tensor. Such a technique provides a new degree of freedom for studying the pressure engineering of 2D anisotropic materials.
Results and discussion
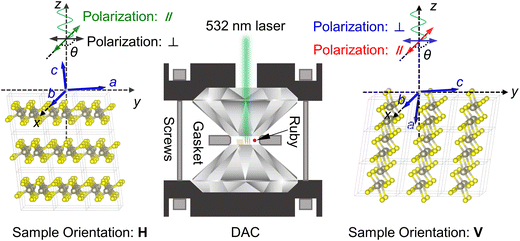
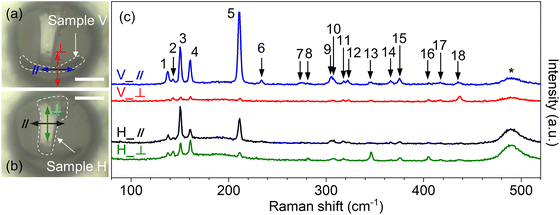
The ReS2 flakes are mechanically exfoliated from ReS2 crystals, and then transferred into the sample chamber of a diamond anvil cell (DAC). The ReS2 flakes are mounted with their atomic planes being horizontal (H) and vertical (V) to the diamond anvil, and the 532 nm laser incidence is vertically from above with its polarization controlled by rotating a half wave plate (Fig. 1). Using angle-resolved polarized Raman spectroscopy,7,18 we precisely determine the crystal orientation and align the ReS2 crystal b axis to the laboratory coordinate x axis (Fig. S1, ESI†). Here we define (x, y, z) as the laboratory coordinates, and (a, b, c) as the crystal axes (x‖b in our experiments). θ is the angle between the direction of laser polarization and the b axis of the ReS2 crystal. The optical images of two such samples (mounted in the V and H configurations) are shown, respectively, in Fig. 2a and b. The Raman spectra are measured with four representative polarization configurations: sample H with the laser polarization parallel (H_‖) and perpendicular (H_⊥) to the ReS2 crystal b axis; and sample V with the laser polarization parallel (V_‖) and perpendicular (V_⊥) to the b axis.Fig. 2c shows the Raman spectra measured under ambient pressure for the four configurations, in which we observe 18 Raman modes. The low-symmetry parallelogram feature of Re4 clusters in the ReS2 crystal gives rise to 36 phonon modes, with the irreducible representations written as Γ = 18(Ag + Au).19,20 The 18 Au modes consist of 15 infrared-active modes and 3 acoustic Au modes, which are all Raman-inactive.21 All 18 Ag modes are Raman-active and detectable.18,21 The vibrational frequency of the 18 Ag modes is within the range of 100–450 cm−1, where the 6 peaks below 250 cm−1 with a higher intensity are assigned to the lattice vibrations related to Re atoms,7,18 and the other modes (above 250 cm−1) originate from the vibration of sulfur atoms. From our previous study,13 we denote those modes with larger weights of in-plane (out-of-plane) vibration to be the Eg-like (Ag-like) mode.22,23 The assignment of the 18 Raman modes is summarized in Table S1 (ESI†).13
All 18 Ag Raman modes show a clear dependence on the crystal orientation and laser polarization, and are different from the orientation–polarization-insensitive PL features (Fig. S2 and S3, ESI†). The intensity differences of the Raman modes amongst the H_‖, H_⊥, V_‖ and V_⊥ configurations are determined using the classical Raman selection rule: the intensity I of a Raman-active phonon mode is determined using I ∝ |es·R·ei|2, where R is the Raman tensor, and ei and es are the polarization configurations, and thus depends on the sample orientation and laser polarization. The four configurations used in our experiment should include some of the extreme values of the Raman peak intensity, and collectively offer additional information about the Raman tensor components, and thus the vibrational nature of the modes and symmetry of the crystal.
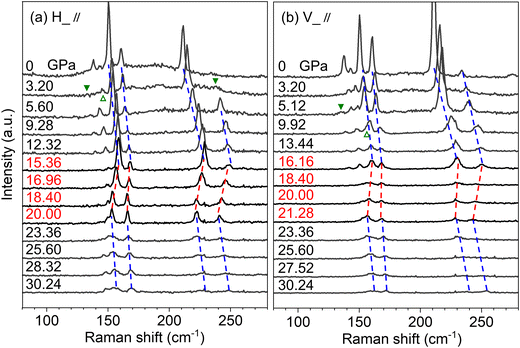
We then studied the evolution of the Raman modes at different pressures with these four configurations. Fig. 3 shows the evolution of the Re-atom vibrations with increasing pressure (0–30.24 GPa) for the H_‖ and V_‖ configurations. In the lower pressure range, four Raman peaks at 151, 161, 211 and 236 cm−1 gradually blueshift (top blue dashed lines) and broaden as the pressure is increased, which is also observed in other TMDC materials.12,24 Upon increasing the pressure, the four peaks are then redshifted (red dashed lines), before returning to the normal blueshift (bottom blue dashed lines).
The anomalous softening behaviors of these four Raman modes originate from the octahedral distortion and lattice expansion through the layer sliding effect under high pressure,25 which are also observed in higher frequency modes corresponding to sulfur-atom vibrations (Fig. S4 and S5, ESI†). Compared with WTe2,12 and TiS3,24 which exhibit phase-transition-related redshift behavior under pressure, the Raman redshift in ReS2 is different in that it shows no discontinuities, no significant intensity weakening, and no peak disappearance in the red-shift pressure range, i.e., no first-order phase transition is observed in the Re-atom vibrations within this red-shift pressure range.
In the blue shift region, however, we do observe pressure-induced Raman peak appearance and disappearance, as indicated by the filled and open triangles in Fig. 3. Interestingly, the associated pressure values clearly depend on the sample orientation. For example, under the H_‖ configuration the appearance of peak α (Fig. 4) takes place at 3.20 GPa, while under V_‖ it becomes 5.12 GPa. The disappearance of peak 2 (Fig. 4) also shows such a difference (3.20 GPa under H_‖ vs. 9.92 GPa under V_‖).
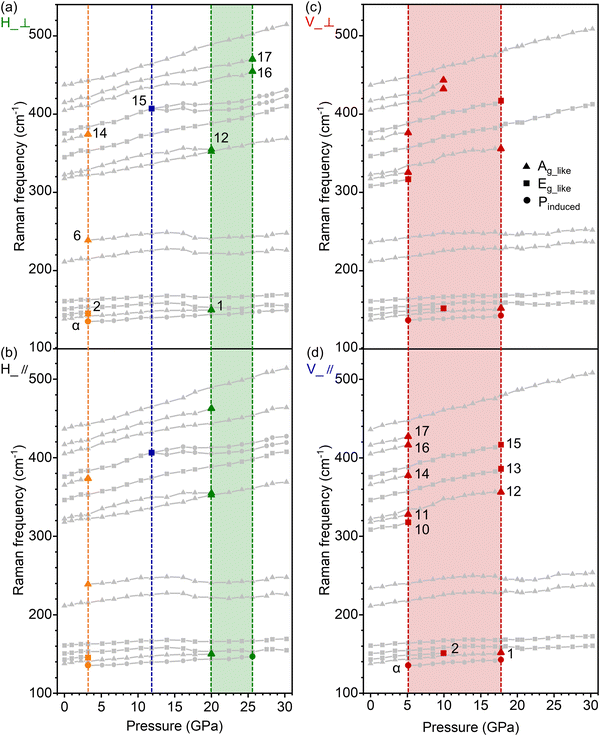
Such a difference in the observed pressure-induced behavior depends on not only sample orientation but also the laser polarization. To obtain a comprehensive and delicate understanding of such an observed difference due to configuration, we plot in Fig. 4 the extracted Raman frequency for all 18 modes over the entire pressure range for all 4 configurations (see Fig. S4 and S5 for the full spectra, ESI†). We first examine the pressure-dependent behavior under the H configurations (Fig. 4a and b).
At 3.20 GPa, peaks 2 (Eg-like) and 14 (Ag-like) disappear, a new mode (α, at 135 cm−1) appears, and the intensity of peak 6 (Ag-like) becomes apparent, indicating a phase transition. This first phase transition corresponds to a structural transition from 1T′ to distorted-1T′ symmetry,26 which also involves an indirect-to-direct band transition as observed in the PL spectra (Fig. S3, ESI†) and confirmed via high-pressure XRD measurements.25–28 As the pressure is increased, the second phase transition is indicated by the splitting of peak 15 (Eg-like) at 11.84 GPa under the H configurations, which probably originates from distortion of the Re4 clusters and rotation of the S atoms around the Re chain.25,29
Upon further increasing the pressure, a more complicated third phase is observed between 20.00 GPa and 25.60 GPa, which starts to show clear polarization dependence: in addition to peak 1 (Ag-like) and 12 (Ag-like) disappearing at ∼20.00 GPa, peak 17 (Ag-like) disappears at 20.00 GPa for H_‖ and 25.60 GPa for H_⊥, and peak 16 (Ag-like) only disappears for H_⊥ (at 25.60 GPa). The third phase transition process is suggested to be a pressure-induced transition of atomic arrangement from disordered stacking to ordered stacking,25,29 which shows the asynchronous disappearance of Raman modes under the H_‖ and H_⊥ configurations, originating from the different elastic moduli of the ReS2 crystal along and perpendicular to the Re chain. This asynchronous behavior reflects the anisotropic change of interlayer force constants of the S atoms and thus the out-of-plane vibrations (Ag-like modes) of the S atoms.17,30–32
Unlike the H configuration, the data under the V configuration show anomalous disappearance behavior in which a large number of peaks disappear together: taking V_‖ for example, peaks 10, 11, 14, 16, and 17 vanish at ∼5.12 GPa, while peaks α, 1, 12, 13, and 15 vanish at ∼17.76 GPa; similar features are also observed under the V_⊥ configuration (details shown in Table S2, ESI†). By comparing the evolution of Raman modes under pressure between the H and V configurations, we show that the measurement configuration plays an important role in observing the Raman features associated with the phase transitions.
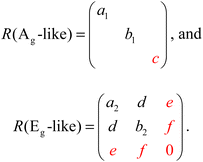
To better understand the origin of the difference in the mode disappearance behavior between the H and V configurations, we calculate the intensity I of these Raman modes using the classic Raman selection rule: I ∝ |es·R·ei|2. We note that the birefringence effect does not apply to these four particular configurations (H_‖, H_⊥, V_‖, V_⊥).13 The full 3 × 3 tensors (R) of the Ag-like and Eg-like modes in ReS2 are given by13:
| IAg-like(H_‖) = a12, IEg-like(H_‖) = a22 + d2 | (1) |
| IAg-like(H_⊥) = b12, IEg-like(H_⊥) = b22 + d2 | (2) |
| IAg-like(V_‖) = a12, IEg-like(V_‖) = a22 + e2 | (3) |
| IAg-like(V_⊥) = c2, IEg-like(V_⊥) = e2 | (4) |
In this case, the effect of pressure on all the tensor components of the anisotropic ReS2 crystal can be revealed: (I) For the H configuration, the continuity and stability of the vast majority of the Eg-like and Ag-like modes indicate that pressure weakly affects the value of the tensor components a1, a2, b1, b2, and d. (II) For the V configuration in the lower pressure range (0–5.12 GPa), the anomalous disappearance of a large amount of Ag peaks suggests that the pressure has a remarkable effect on the value of coefficient c in this pressure range, which dominates the out-of-plane Raman vibrations. (III) For the V configuration in the higher pressure range (above 17.76 GPa), the vanishing of both the Ag-like and Eg-like modes indicates that the pressure starts to impact a1, a2, c, and e, which are involved in both the out-of-plane and in-plane Raman vibrations detected under the V configuration.
These pressure-induced asynchronous phenomena and the specific effect on the Raman tensor elements are in good agreement with the in-plane and out-of-plane nature of the Ag and Eg modes.25,27,29 Instead of analyzing the pressure–frequency slopes of the Ag and Eg vibrations as in most high-pressure studies, we examine the vanishing of the Raman peaks under different configurations and investigate the pressure effects on individual tensor components. This gives strong experimental and theoretical evidence that lower pressures mainly modulate the out-of-plane vibrations, and higher pressures affect both the out-of-plane and in-plane vibrations. Specifically, such previously unobserved phenomena (the massive disappearance of Raman modes in the V configurations) offer a direct link to the pressure effects on individual tensor components.
Conclusions
In summary, we demonstrate in situ pressure engineering of the 2D ReS2 crystal under four orientation–polarization configurations (H_‖, H_⊥, V_‖ and V_⊥). Softening behaviors of the Re-atom vibrational modes are discovered in the pressure range of 15–21 GPa, and are identified as pressure-induced octahedral distortion and lattice expansion via the layer sliding effect. Unlike the H configuration that has been studied widely, under the V configuration the anomalous disappearance behavior observed in this work enables us to identify the effect of pressure on the different components in the full 3 × 3 Raman tensor of the anisotropic ReS2 crystal. Such high-pressure measurements under different Raman configurations, together with associated full tensor analysis, can offer new insights for understanding pressure effects in anisotropic crystals.Methods
Sample preparation
ReS2 flakes are mechanically exfoliated from ReS2 single crystals onto viscoelastic poly(dimethylsiloxane) (PDMS) stamps for Raman measurements. For high-pressure measurements, ReS2 flakes are mechanically exfoliated from ReS2 single crystals and transferred onto the anvil surface of the DAC using a tungsten needle. In the DAC, samples are mounted with specific orientations (H and V) to facilitate the orientation–configuration measurements. All the ReS2 crystals measured at ambient pressure and high pressure are bulk samples.Raman and PL measurements
Laser excitation at 532 nm is used for all Raman and PL measurements. The laser beam is focused onto the sample using a 50× objective lens with a numerical aperture of 0.42. The laser power is set below 3 mW to avoid sample heating.Preparation for high-pressure measurements
ReS2 flakes are transferred into the sample chamber of a symmetric DAC, which is formed from the hole of a drilled T301 gasket (hole diameter: 150 μm) that has been pre-indented to a thickness of 50 μm and the anvil of one piece of diamond (culet diameter: 400 μm). A small piece of ruby (pressure-calibration material) and a tiny drop of silicone oil (pressure-transmitting medium) are loaded into the sample volume before it is sealed (with the other piece of diamond).Author contributions
Z. Wang and J. Xia conceived and supervised this work; T. Wen, M. Zhang and J. Li performed the experimental measurements; T. Wen performed the calculations and wrote the manuscript draft; T. Wen, Z. Wang and J. Xia analyzed the data; C. Jiao and S. Pei helped with experiments and data analysis. All authors discussed the results.Conflicts of interest
There are no conflicts to declare.Acknowledgements
The authors gratefully acknowledge support from the Ministry of Science and Technology of the People's Republic of China (grants 2019YFE0120300), the National Natural Science Foundation of China (grants 62150052, U21A20459, 62104029, 62004026, 62004032, 12104086), the Sichuan Science and Technology Program (grants 2021YJ0517, 2021JDTD0028), the Fundamental Research Funds for the Central Universities (ZYGX2020ZB014 and ZYGX2020J029), and the China Postdoctoral Science Foundation (grant 2021M690554).References
- Z. Wang, H. Jia, X. Zheng, R. Yang, Z. Wang, G. J. Ye, X. H. Chen, J. Shan and P. X.-L. Feng, Nanoscale, 2017, 7, 877–884 RSC.
- A. Islam, van den Akker and P. X.-L. Feng, Opt. Mater. Express, 2019, 9, 526–535 CrossRef CAS.
- J. Wang, Y. J. Zhou, D. Xiang, S. J. Ng, K. Watanabe, T. Taniguchi and G. Eda, Adv. Mater., 2020, 32, 2001890 CrossRef CAS PubMed.
- C. Kim, M. Sung, S. Y. Kim, B. C. Lee, Y. Kim, D. Kim, Y. Kim, Y. Seo, C. Theodorou, G. T. Kim and M. K. Joo, ACS Appl. Mater. Interfaces, 2021, 13, 19016–19022 CrossRef CAS PubMed.
- H. Yang, H. Jussila, A. Autere, H. P. Komsa, G. Ye, X. Chen, T. Hasan and Z. Sun, ACS Photonics, 2017, 4, 3023–3030 CrossRef CAS.
- Q. Wang, W. Lv, J. Cai, W. Lv, T. Lei, B Cui, J. Luo, L. Bian, X. Sun, D. Wu, B. Zhang and Z. Zeng, Appl. Phys. Lett., 2021, 119, 163102 CrossRef CAS.
- D. A. Chenet, O. B. Aslan, P. Y. Huang, C. Fan, A. M. van der Zande, T. F. Heinz and J. C. Hone, Nano Lett., 2015, 15, 5667–5672 CrossRef CAS PubMed.
- C. H. Ho, Y. S. Huang, K. K. Tiong and P. C. Liao, J. Phys.: Condens. Matter, 1999, 11, 5367 CrossRef CAS.
- C. H. Ho and Z. Z. Liu, Nano Energy, 2019, 56, 641–650 CrossRef CAS.
- H. Jang, C. R. Ryder, J. D. Wood, M. C. Hersam and D. G. Cahill, Adv. Mater., 2017, 29, 1700650 CrossRef PubMed.
- T. Wen, J. Li, Q. Deng, C. Jiao, M. Zhang, S. Wu, L. Lin, W. Huang, J. Xia and Z. Wang, Small, 2022, 18, 2108028 CrossRef CAS PubMed.
- J. Xia, D. F. Li, J. D. Zhou, P. Yu, J. H. Lin, J. L. Kuo, H. Li, Z. Liu, J. Yan and Z. X. Shen, Small, 2017, 13, 1701887 CrossRef PubMed.
- T. Wen, J. Li, M. Zhang, C. Jiao, S. Pei, Z. Wang and J. Xia, ACS Photonics, 2022, 9(11), 3557–3562 CrossRef CAS.
- K. Xu, Z. Yu, W. Xia, M. Xu, X. Mai, L. Wang, Y. Guo, X. Miao and M. Xu, J. Phys. Chem. C, 2020, 124, 15600–15606 CrossRef CAS.
- Z. H. Chi, X. M. Zhao, H. Zhang, A. F. Goncharov, S. S. Lobanov, T. Kagayama, M. Sakata and X. J. Chen, Phys. Rev. Lett., 2014, 113, 036802 CrossRef CAS PubMed.
- M. S. Torikachvili, S. L. Bud’ko, N. Ni and P. C. Canfield, Phys. Rev. Lett., 2008, 101, 057006 CrossRef PubMed.
- M. Zhang, C. Jiao, T. Wen, J. Li, S. Pei, Z. Wang and J. Xia, Acta Phys. Sin., 2022, 71, 140702 CrossRef.
- S. Zhang, N. Mao, N. Zhang, J. Wu, L. Tong and J. Zhang, ACS Nano, 2017, 11, 10366–10372 CrossRef CAS PubMed.
- N. R. Pradhan, A. McCreary, D. Rhodes, Z. Lu, S. Feng, E. Manousakis, D. Smirnov, R. Namburu, M. Dubey, A. R. Hight Walker, H. Terrones, M. Terrones, V. Dobrosavljevic and L. Balicas, Nano Lett., 2015, 15, 8377–8384 CrossRef CAS PubMed.
- D. Wolverson, S. Crampin, A. S. Kazemi, A. Ilie and S. J. Bending, ACS Nano, 2014, 8, 11154–11164 CrossRef CAS PubMed.
- Y. Feng, W. Zhou, Y. Wang, J. Zhou, E. Liu, Y. Fu, Z. Ni, X. Wu, H. Yuan, F. Miao, B. Wang, X. Wan and D. Xing, Phys. Rev. B: Condens. Matter Mater. Phys., 2015, 92, 054110 CrossRef.
- X. Wang, K. Shinokita, H. E. Lim, N. B. Mohamed, Y. Miyauchi, N. T. Cuong, S. Okada and K. Matsuda, Adv. Funct. Mater., 2019, 29, 1806169 CrossRef.
- S. Tongay, H. Sahin, C. Ko, A. Luce, W. Fan, K. Liu, J. Zhou, Y. S. Huang, C. H. Ho, J. Yan, D. F. Ogletree, S. Aloni, J. Ji, S. Li, J. Li, F. M. Peeters and J. Wu, Nat. Commun., 2014, 5, 3252 CrossRef PubMed.
- K. Wu, E. Torun, H. Sahin, B. Chen, X. Fan, A. Pant, D. P. Wright, T. Aoki, F. M. Peeters, E. Soignard and S. Tongay, Nat. Commun., 2016, 7, 12952 CrossRef CAS PubMed.
- P. Saha, B. Ghosh, A. Mazumder, K. Glazyrin and G. D. Mukherjee, J. Appl. Phys., 2020, 128, 085904 CrossRef CAS.
- J. Ibáñez-Insa, T. Woźniak, R. Oliva, C. Popescu, S. Hernández and J. López-Vidrier, Minerals, 2021, 11, 207 CrossRef.
- P. Wang, Y. G. Wang, J. Y. Qu, Q. Zhu, W. G. Yang, J. L. Zhu, L. P. Wang, W. W. Zhang, D. W. He and Y. S. Zhao, Phys. Rev. B, 2018, 97, 235202 CrossRef CAS.
- N. Sheremetyeva, D. Tristant, A. Yoshimura, J. Gray, L. Liang and V. Meunier, Phys. Rev. B, 2019, 100, 214101 CrossRef CAS.
- Y. L. Yan, C. L. Jin, J. Wang, T. R. Qin, F. F. Li, K. Wang, Y. H. Han and C. X. Gao, J. Phys. Chem. Lett., 2017, 8, 3648–3655 CrossRef CAS PubMed.
- K. H. Liu, L. M. Zhang, T. Cao, C. H. Jin, D. A. Qiu, Q. Zhou, A. Zettl, P. D. Yang, S. G. Louie and F. Wang, Nat. Commun., 2014, 5, 4966 CrossRef CAS PubMed.
- Q. Y. Zhao, Y. H. Guo, Y. X. Zhou, X. Xu, Z. Y. Ren, J. T. Bai and X. L. Xu, J. Phys. Chem. C, 2017, 121, 23744–23751 CrossRef CAS.
- Y. Q. Feng, H. Y. Sun, J. H. Sun, Y. Shen and Y. You, Mater. Today Commun., 2019, 21, 100684 CrossRef CAS.
Footnote |
| † Electronic supplementary information (ESI) available. See DOI: https://doi.org/10.1039/d2nh00584k |
| This journal is © The Royal Society of Chemistry 2023 |

