Uncovering the potential of aqueous solutions of deep eutectic solvents on the extraction and purification of collagen type I from Atlantic codfish (Gadus morhua)†
Meena
Bisht
 *a,
Margarida
Martins
a,
Ana C. R. V.
Dias
b,
Sónia P. M.
Ventura
 *a and
João A. P.
Coutinho
 a
a
aCICECO – Aveiro Institute of Materials, Department of Chemistry, University of Aveiro, 3810-193 Aveiro, Portugal. E-mail: meenabisht56@gmail.com; spventura@ua.pt
bCESAM – Centre for Environmental and Marine Studies, Department of Environment and Planning, University of Aveiro, 3810-193 Aveiro, Portugal
First published on 25th October 2021
Abstract
Marine fish industries discard huge amounts of fish waste every year, which in turn impose problems of environmental pollution and loss of economic value. About 75% of the total weight of fish is discarded in the form of skins, bones, fins, heads, guts, and scales, which contain high levels of collagen type I. Generally, major sources for commercial collagens are the skin and bone of pigs and cows; however, these sources are chiefly associated with the risk of transference of zoonotic diseases or religious issues. Traditional protocols applied to the extraction of collagen are outdated, mainly with respect to present demands to develop more sustainable processes. This work explores the use of sustainable solvents, such as deep eutectic solvents (DES), to develop a more efficient, cost-effective and biocompatible process to extract collagen from waste from the fish industry waste. The extraction of collagen from the skin of Atlantic cod (Gadus morhua) using aqueous solutions of various eutectic solvents was studied, and after selection of the best solvent, an aqueous solution of urea (U) and lactic acid (LA) at a molar ratio of 1![[thin space (1/6-em)]](https://www.rsc.org/images/entities/char_2009.gif) :
:![[thin space (1/6-em)]](https://www.rsc.org/images/entities/char_2009.gif) 2 (U
2 (U![[thin space (1/6-em)]](https://www.rsc.org/images/entities/char_2009.gif) :
:![[thin space (1/6-em)]](https://www.rsc.org/images/entities/char_2009.gif) LA 1
LA 1![[thin space (1/6-em)]](https://www.rsc.org/images/entities/char_2009.gif) :
:![[thin space (1/6-em)]](https://www.rsc.org/images/entities/char_2009.gif) 2), the collagen extracted was properly characterized using SDS-PAGE, CD, FTIR, and XRD, and shown to be of type I. The results obtained here demonstrate an improvement in the yield and quality of the extracted collagen when eutectic mixtures were applied instead of acetic acid. After optimization of the process conditions, a maximum extraction yield of 6% was obtained for the aqueous solution of U
2), the collagen extracted was properly characterized using SDS-PAGE, CD, FTIR, and XRD, and shown to be of type I. The results obtained here demonstrate an improvement in the yield and quality of the extracted collagen when eutectic mixtures were applied instead of acetic acid. After optimization of the process conditions, a maximum extraction yield of 6% was obtained for the aqueous solution of U![[thin space (1/6-em)]](https://www.rsc.org/images/entities/char_2009.gif) :
:![[thin space (1/6-em)]](https://www.rsc.org/images/entities/char_2009.gif) LA 1
LA 1![[thin space (1/6-em)]](https://www.rsc.org/images/entities/char_2009.gif) :
:![[thin space (1/6-em)]](https://www.rsc.org/images/entities/char_2009.gif) 2 at 0.75 M. The present work demonstrates the potential use of codfish skin waste and an aqueous solution of a DES to develop a more environmentally-friendly process to obtain high-quality collagen type I. It is an effort to convince industries to valorize their own residues under the guidelines of a circular economy.
2 at 0.75 M. The present work demonstrates the potential use of codfish skin waste and an aqueous solution of a DES to develop a more environmentally-friendly process to obtain high-quality collagen type I. It is an effort to convince industries to valorize their own residues under the guidelines of a circular economy.
Introduction
A million metric tonnes of waste are discarded every year from fish processing activities, making fish processing waste management a major challenge worldwide.1 In this field, approximately 70% of wastes in the form of skin, bones, fins, heads and scales are produced, which could be used as natural sources of several bioactive compounds. Collagen is one of the most abundant compounds present in these fish wastes.2 It is a fibrous protein constituting a major structural element in the connective tissue of animal skin and bone.2,3 It consists of three polypeptide chains that fold into a unique triple helix structure, resulting in a repeating glycine-(2S)-proline-(2S,4R)-4-hydroxyproline (Gly-Xaa-Yaa) sequence, in which every third residue is Gly.4 To date, 29 types of collagen have been identified. The global collagen market is expected to grow at an annual growth rate of 5.9% to reach USD 6.63 billion in the near future by 2025.5 Collagen has a wide range of applications in the food, pharmaceutical, healthcare, tissue engineering, cosmetics and biotechnological industries, as depicted in detail in Fig. S1.†![[thin space (1/6-em)]](https://www.rsc.org/images/entities/char_2009.gif) 6–8
6–8
Europe has dominated the collagen market with a share of 35.1% in 2019, which is attributed to multiple nutritional, skin, and health benefits of collagen and growing per capita healthcare spending in the region. In the specific case of collagen type I, the type most abundantly found in fish-derived materials, the principal applications are those related to the biomedical sector.5–7 Generally, major sources of commercial collagens are the skin and bone of pigs and cows (see Fig. S1†). However, these sources are chiefly associated with the risk of transference of zoonotic diseases or religious issues.8,9 Thus, there is a strong need to search for alternative sources of collagen, for which collagen from fish can be considered the best alternative.8,10 Codfish is thus a good example to consider. It is consumed daily in large quantities and in several countries, among which Portugal stands out. As a result, huge amounts of skin, scales, and bone residues are generated, in which the presence of collagen type I is significant. In recent years, collagen from Baltic cod (Gadus morhua), silvertip shark (Carcharhinus albimarginatus), deep-sea redfish (Sebastes mentella), striped catfish (Pangasianodon hypophthalmus), carp (Catla catla and Cirrhinus mrigala) and of Nile tilapia (Oreochromis niloticus) has been extracted and characterized.11–13 In the literature, the most common processes represent the use of acidic treatments or enzymatic hydrolysis. In spite of their capacity to recover collagen, there are some drawbacks, such as the complexity of some processes and the harsh operational conditions used13–16 that need further attention. As an example, the extraction of collagen performed by acids occurs traditionally at high temperatures, which does not help preserve its structural integrity, consequently inhibiting the capacity of the process to control the degradation rate.17 In recent years, deep eutectic solvents (DES) and eutectic mixtures have been reported for the dissolution and extraction of many bioactive compounds.18–25 DES are composed of at least a hydrogen bond acceptor (HBA) and a hydrogen bond donor (HBD) species, which upon mixing establish strong hydrogen bond interactions leading to the formation of eutectic mixtures, often becoming liquid at conditions close to room temperature.21 The use of eutectic mixtures, by the addition of water to DES for extraction purposes is a well-established procedure.22,23 It helps reduce the solvents’ viscosity, thus facilitating the mass transfer process. Moreover, the aqueous solutions exhibited higher dissolving rates and lower cost compared to neat DES.24 Indeed, after the work done by Triolo and co-workers26 and already adopted and accepted by other authors, water may be a component of the DES, being able to act as an HBD or an HBA. It is probably true that the hydrogen bonding network between the starting materials present in the neat DES is destroyed up to specific amounts of water, but a new hydrogen bonding network would be formed in which water participates with a positive impact on developing extraction processes. Therefore, the use of aqueous solutions of DES extracting collagen type I represents here a poorly explored but highly promising strategy25 to reduce the adverse environmental effects of the overall process, but mainly to improve the yield of extraction and purity level of the collagen. Nevertheless, and although the work of Bai et al.25 reports the use of DES to process a similar raw material – codfish skins – their objective is different, since they were focused on the extraction and purification of collagen peptides (a product of the thermal degradation of collagen). Furthermore, we also intend to use the DES as a way to have better control over the temperature of extraction (low temperatures will be preferred), to avoid the thermal degradation of collagen.17
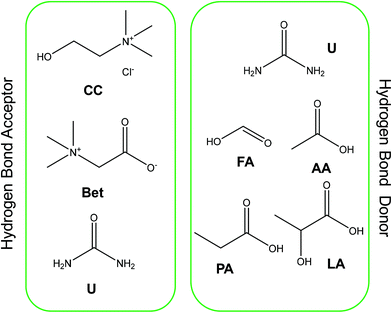
Collagen type I was extracted from codfish skin waste using 0.5 M of acetic acid as the control solvent, with these results compared with those obtained with aqueous solutions of DES. DES containing betaine (Bet), urea (U), and cholinium chloride (CC) as hydrogen bond acceptors (HBA) and formic acid (FA), acetic acid (AA), propanoic acid (PA), and lactic acid (LA) as hydrogen bond donors (HBD) were applied (Fig. 1). The solid–liquid ratio, pH, and concentration of DES were the conditions investigated and further optimized. The molar ratio of DES used was 1![[thin space (1/6-em)]](https://www.rsc.org/images/entities/char_2009.gif) :
:![[thin space (1/6-em)]](https://www.rsc.org/images/entities/char_2009.gif) 2, except for the cases of U
2, except for the cases of U![[thin space (1/6-em)]](https://www.rsc.org/images/entities/char_2009.gif) :
:![[thin space (1/6-em)]](https://www.rsc.org/images/entities/char_2009.gif) FA (1
FA (1![[thin space (1/6-em)]](https://www.rsc.org/images/entities/char_2009.gif) :
:![[thin space (1/6-em)]](https://www.rsc.org/images/entities/char_2009.gif) 4) and U
4) and U![[thin space (1/6-em)]](https://www.rsc.org/images/entities/char_2009.gif) :
:![[thin space (1/6-em)]](https://www.rsc.org/images/entities/char_2009.gif) AA (1
AA (1![[thin space (1/6-em)]](https://www.rsc.org/images/entities/char_2009.gif) :
:![[thin space (1/6-em)]](https://www.rsc.org/images/entities/char_2009.gif) 5). The extracted collagen was characterized using Fourier Transform Infrared Spectroscopy (FTIR), Sodium Dodecyl Sulfate-Polyacrylamide Gel Electrophoresis (SDS-PAGE), X-Ray Diffraction (XRD), Circular Dichroism (CD), and Differential Scanning Calorimetric (DSC) studies and the process was developed by considering the best DES analysed regarding its life cycle assessment (LCA). The total impacts evaluated relating to the environmental categories of global warming, ozone formation, human health, terrestrial acidification, mineral and fossil resources scarcity were the issues determined.
5). The extracted collagen was characterized using Fourier Transform Infrared Spectroscopy (FTIR), Sodium Dodecyl Sulfate-Polyacrylamide Gel Electrophoresis (SDS-PAGE), X-Ray Diffraction (XRD), Circular Dichroism (CD), and Differential Scanning Calorimetric (DSC) studies and the process was developed by considering the best DES analysed regarding its life cycle assessment (LCA). The total impacts evaluated relating to the environmental categories of global warming, ozone formation, human health, terrestrial acidification, mineral and fossil resources scarcity were the issues determined.
Materials and methods
Materials
Commercial rat tail collagen was purchased from Sigma-Aldrich. Formic acid (98%) and urea (>99%) were purchased from Panreac, acetic acid (99%) was supplied by Fisher Scientific, propionic acid (>99%) was acquired from Merck Chemicals, L(+)-lactic acid (88–92%) from Riedel de Haën, p-toluenesulfonic acid monohydrate (>98.5%) from Sigma-Aldrich, and cholinium chloride (99%) and betaine (98%) were purchased from Acros Organics. The water content of all starting materials used in DES preparation was measured using a Metrohm 831 Karl Fisher coulometer. Sodium chloride (99.5%) was purchased from Panreac. Isopropanol (HPLC Grade) was obtained from Fisher Chemical. Sodium acetate (100%) was purchased from VWR – Prolabo (JMS). The skins of Baltic cod (Gadus morhua) were kindly supplied by Pascoal & Filhos S.A. (Aveiro, Portugal) and stored frozen at a temperature of −20 °C until use.Experimental methods
DES preparation
DES were prepared using a method adapted from Abbot and co-workers.20 Firstly, the amount of water present in the starting materials was measured using a Metrohm 831 Karl Fisher coulometer (Table S1 from ESI†). Then, two-component mixtures (HBD and HBA) were accurately weighed into a round-bottom flask. The mixtures were stirred in an oil bath at 60 ± 2 °C at 500 rpm until a homogenous and transparent liquid was obtained. The pH of all aqueous solutions was measured at room temperature using a Mettler Toledo S47 SevenMulti™ dual meter pH and conductivity equipment with an uncertainty of ±0.01.Extraction of collagen from codfish skin
All procedures were carried out at 4 °C. Collagen was extracted according to the previously reported method with slight modifications.27,28 A detailed schematic representation of the extraction and recovery process for collagen from codfish skin waste using aqueous solutions of acetic acid (control solvent) and DES is shown in Fig. S2 in ESI.† Briefly, the frozen codfish skins collected from Pascoal & Filhos S.A. were thawed, and the attached meat, scales and fins were manually removed. The superfluous material from the fish skins was removed by cleaning and rinsing with cold water. Then, the skins were cut into small pieces. Non-collagenous proteins were removed by soaking the skins with 0.1 M sodium hydroxide (NaOH) solution with a solid to solvent ratio of 1![[thin space (1/6-em)]](https://www.rsc.org/images/entities/char_2009.gif) :
:![[thin space (1/6-em)]](https://www.rsc.org/images/entities/char_2009.gif) 10 (w/v) for 24 h, where the NaOH solution was changed after every 5–6 h. After that, the samples were washed with cold distilled water until a neutral pH was obtained. The deproteinized skins were defatted using a 10% (v/v) butyl alcohol solution with a solid to solvent ratio of 1
10 (w/v) for 24 h, where the NaOH solution was changed after every 5–6 h. After that, the samples were washed with cold distilled water until a neutral pH was obtained. The deproteinized skins were defatted using a 10% (v/v) butyl alcohol solution with a solid to solvent ratio of 1![[thin space (1/6-em)]](https://www.rsc.org/images/entities/char_2009.gif) :
:![[thin space (1/6-em)]](https://www.rsc.org/images/entities/char_2009.gif) 10 (w/v) for 48 h and the solvent was changed after every 6–7 h. Again, the samples were washed with cold distilled water. Then, the extractions were performed at 4 °C for 48 h using an optimized solid–liquid ratio of 1
10 (w/v) for 48 h and the solvent was changed after every 6–7 h. Again, the samples were washed with cold distilled water. Then, the extractions were performed at 4 °C for 48 h using an optimized solid–liquid ratio of 1![[thin space (1/6-em)]](https://www.rsc.org/images/entities/char_2009.gif) :
:![[thin space (1/6-em)]](https://www.rsc.org/images/entities/char_2009.gif) 10 (w/v) in 0.5 M of acetic acid or aqueous solutions of DES and using an orbital shaker. The resultant viscous solution was centrifuged to remove insoluble substances. The supernatants were salted-out by adding NaCl to a final concentration of 0.9 M, followed by precipitation of the collagen by the addition of NaCl (final concentration of 2.6 M) at neutral pH (0.05 M Tris-HCl, pH 7.5). The resultant precipitate was obtained by centrifugation at 15
10 (w/v) in 0.5 M of acetic acid or aqueous solutions of DES and using an orbital shaker. The resultant viscous solution was centrifuged to remove insoluble substances. The supernatants were salted-out by adding NaCl to a final concentration of 0.9 M, followed by precipitation of the collagen by the addition of NaCl (final concentration of 2.6 M) at neutral pH (0.05 M Tris-HCl, pH 7.5). The resultant precipitate was obtained by centrifugation at 15![[thin space (1/6-em)]](https://www.rsc.org/images/entities/char_2009.gif) 000g for 1 h and dialyzed against deionized water at 4 °C for 72 h. Finally, the collagen was dried by lyophilization, and its yield was calculated using eqn (1):29
000g for 1 h and dialyzed against deionized water at 4 °C for 72 h. Finally, the collagen was dried by lyophilization, and its yield was calculated using eqn (1):29 | (1) |
Fourier-transform infrared spectroscopy (FTIR)
The presence of collagen type I in the samples was determined by an FTIR spectrometer (Brucker Tensor 27) equipped with a single horizontal Golden Gate ATR cell (attenuated total reflectance), and a diamond crystal. FTIR spectra were collected in the range of 4000–250 cm−1 by accumulating 256 scans, and with a resolution of 4 cm−1. After measuring all FTIR spectra corresponding to a selected strain and background subtraction, the average spectra were calculated.Sodium dodecyl sulfate-polyacrylamide gel electrophoresis (SDS-PAGE)
An electrophoresis analysis was performed on polyacrylamide gels (stacking: 4% and resolving: 20%) with a running buffer (pH 8.3) consisting of 250 mM of Tris-HCl, 1.92 M of glycine, and 1% SDS. The collagen samples were stained with the usual staining procedure [Coomassie Brilliant Blue G-250 0.1% (w/v), methanol 50% (v/v), acetic acid 7% (v/v), and water 42.9% (v/v)] in an orbital shaker, at moderate speed (±50 rpm), for 4 h and at room temperature. The gels were stained in a solution containing acetic acid 7% (v/v), methanol 20% (v/v), and water 73% (v/v) in an orbital shaker at ±60 rpm overnight, also at room temperature. SDS-PAGE Molecular Weight Standards (VWR) were used as protein standards.Circular dichroism (CD)
CD spectra of the extracts were recorded at 180 to 280 nm using a 0.1 cm path length cuvette. Lyophilised collagen samples were dissolved at 0.5 mg mL−1 in 1% AA and incubated at 4 °C for 6 h. The baseline of the sample CD spectrum was corrected by subtracting the CD spectrum of the solvent alone. Each CD spectrum represents an average of three scans. The bandwidth and response time were, respectively, 1.0 nm and 1 s. For thermal melting (Tm) measurement, a cell holder with quartz cells containing collagen solutions was heated from 2 to 30 °C at a heating rate of 0.1 °C min−1 at 222 nm.Differential scanning calorimetry (DSC)
The thermal stability of the collagen was assessed on a nano-DSC (TA Instruments, New Castle, DE, USA). The collagen sample was degassed for 5 min at 25 °C prior to the scans. All thermograms were recorded from 0 to 35 °C at a constant heating rate of 0.25 °C min−1 and 600 s of equilibration time. During heating, cells were pressurized to 3 atmospheres. The denaturation temperature of the collagen samples was analyzed using DSC Nanoanalyze software.X-Ray diffraction (XRD)
X-Ray Diffraction (XRD) patterns were recorded at room temperature on an Empyrean, Malvern Panalytical powder diffractometer system using CuKα radiation (45 kV, 40 mA, CuKα radiation of λ = 1.54018 Å with 2θ range from 5° to 50° at a scan speed of 0.0263° per seconds1).Environmental assessment
Life cycle assessment (LCA) was applied to determine the environmental impacts of the experimental methods, including the steps of codfish skin preparation, solubilization, extraction and purification of collagen. Three alternatives for collagen extraction were analysed: with AA (conventional solvent), and with the DESs selected as the best solvents, U![[thin space (1/6-em)]](https://www.rsc.org/images/entities/char_2009.gif) :
:![[thin space (1/6-em)]](https://www.rsc.org/images/entities/char_2009.gif) LA (1
LA (1![[thin space (1/6-em)]](https://www.rsc.org/images/entities/char_2009.gif) :
:![[thin space (1/6-em)]](https://www.rsc.org/images/entities/char_2009.gif) 2) and U
2) and U![[thin space (1/6-em)]](https://www.rsc.org/images/entities/char_2009.gif) :
:![[thin space (1/6-em)]](https://www.rsc.org/images/entities/char_2009.gif) PA (1
PA (1![[thin space (1/6-em)]](https://www.rsc.org/images/entities/char_2009.gif) :
:![[thin space (1/6-em)]](https://www.rsc.org/images/entities/char_2009.gif) 2). The data on the inputs of each system are presented in Table S2† and the impacts of producing those inputs were taken from the ecoinvent database version 3.7.1.30 ReCiPe 2016 was the impact assessment method selected.31
2). The data on the inputs of each system are presented in Table S2† and the impacts of producing those inputs were taken from the ecoinvent database version 3.7.1.30 ReCiPe 2016 was the impact assessment method selected.31
Results and discussion
Selection of the most appropriate aqueous solution of DES to extract collagen
Extraction of collagen using 0.5 M of DES or acetic acid (control solvent) was done according to the method of Nagai et al.27Fig. 2 shows the yield of extraction of collagen obtained with 0.5 M of acetic acid and various aqueous solutions of DES as solvents. The results show the lowest yield of extraction for CC![[thin space (1/6-em)]](https://www.rsc.org/images/entities/char_2009.gif) :
:![[thin space (1/6-em)]](https://www.rsc.org/images/entities/char_2009.gif) U (1
U (1![[thin space (1/6-em)]](https://www.rsc.org/images/entities/char_2009.gif) :
:![[thin space (1/6-em)]](https://www.rsc.org/images/entities/char_2009.gif) 2), which may be explained by the high pH value (pH 7) of this DES, which is far from the acidic media required for collagen extraction. Therefore, we have prepared DESs using three different types of HBA (CC, Bet, and U) and acid HBD (FA, AA, PA, and LA) at various molar ratios, whose pH values are given in Table S3 from ESI.† Among the studied DESs (Fig. 2), CC-based DESs were found to be the least effective at extracting collagen.
2), which may be explained by the high pH value (pH 7) of this DES, which is far from the acidic media required for collagen extraction. Therefore, we have prepared DESs using three different types of HBA (CC, Bet, and U) and acid HBD (FA, AA, PA, and LA) at various molar ratios, whose pH values are given in Table S3 from ESI.† Among the studied DESs (Fig. 2), CC-based DESs were found to be the least effective at extracting collagen.
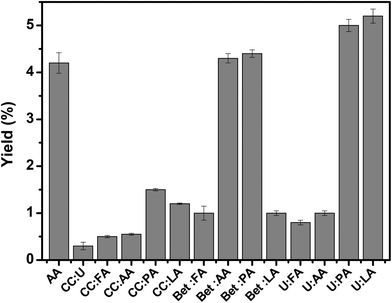 | ||
| Fig. 2 Yield of extraction of collagen type I (%) and pH obtained by applying several aqueous solutions of DES in comparison with acetic acid (AA) at 0.5 M. All the extractions were done at 4 °C. | ||
Nevertheless, a remarkable improvement in the yield of extraction was recorded when collagen type I was recovered using U-based DES, particularly in the case of Bet![[thin space (1/6-em)]](https://www.rsc.org/images/entities/char_2009.gif) :
:![[thin space (1/6-em)]](https://www.rsc.org/images/entities/char_2009.gif) AA (1
AA (1![[thin space (1/6-em)]](https://www.rsc.org/images/entities/char_2009.gif) :
:![[thin space (1/6-em)]](https://www.rsc.org/images/entities/char_2009.gif) 2), Bet
2), Bet![[thin space (1/6-em)]](https://www.rsc.org/images/entities/char_2009.gif) :
:![[thin space (1/6-em)]](https://www.rsc.org/images/entities/char_2009.gif) PA (1
PA (1![[thin space (1/6-em)]](https://www.rsc.org/images/entities/char_2009.gif) :
:![[thin space (1/6-em)]](https://www.rsc.org/images/entities/char_2009.gif) 2), U
2), U![[thin space (1/6-em)]](https://www.rsc.org/images/entities/char_2009.gif) :
:![[thin space (1/6-em)]](https://www.rsc.org/images/entities/char_2009.gif) PA (1
PA (1![[thin space (1/6-em)]](https://www.rsc.org/images/entities/char_2009.gif) :
:![[thin space (1/6-em)]](https://www.rsc.org/images/entities/char_2009.gif) 2), and U
2), and U![[thin space (1/6-em)]](https://www.rsc.org/images/entities/char_2009.gif) :
:![[thin space (1/6-em)]](https://www.rsc.org/images/entities/char_2009.gif) LA (1
LA (1![[thin space (1/6-em)]](https://www.rsc.org/images/entities/char_2009.gif) :
:![[thin space (1/6-em)]](https://www.rsc.org/images/entities/char_2009.gif) 2). The yields of extraction of collagen with Bet
2). The yields of extraction of collagen with Bet![[thin space (1/6-em)]](https://www.rsc.org/images/entities/char_2009.gif) :
:![[thin space (1/6-em)]](https://www.rsc.org/images/entities/char_2009.gif) AA (1
AA (1![[thin space (1/6-em)]](https://www.rsc.org/images/entities/char_2009.gif) :
:![[thin space (1/6-em)]](https://www.rsc.org/images/entities/char_2009.gif) 2), Bet
2), Bet![[thin space (1/6-em)]](https://www.rsc.org/images/entities/char_2009.gif) :
:![[thin space (1/6-em)]](https://www.rsc.org/images/entities/char_2009.gif) PA (1
PA (1![[thin space (1/6-em)]](https://www.rsc.org/images/entities/char_2009.gif) :
:![[thin space (1/6-em)]](https://www.rsc.org/images/entities/char_2009.gif) 2), U
2), U![[thin space (1/6-em)]](https://www.rsc.org/images/entities/char_2009.gif) :
:![[thin space (1/6-em)]](https://www.rsc.org/images/entities/char_2009.gif) PA (1
PA (1![[thin space (1/6-em)]](https://www.rsc.org/images/entities/char_2009.gif) :
:![[thin space (1/6-em)]](https://www.rsc.org/images/entities/char_2009.gif) 2), and U
2), and U![[thin space (1/6-em)]](https://www.rsc.org/images/entities/char_2009.gif) :
:![[thin space (1/6-em)]](https://www.rsc.org/images/entities/char_2009.gif) LA (1
LA (1![[thin space (1/6-em)]](https://www.rsc.org/images/entities/char_2009.gif) :
:![[thin space (1/6-em)]](https://www.rsc.org/images/entities/char_2009.gif) 2) were, respectively, 4.3%, 4.4%, 5.0%, and 5.2% on the basis of lyophilized dry weight. Furthermore, the extraction efficiency of the individual starting materials was compared with the data obtained for the eutectic mixtures, U
2) were, respectively, 4.3%, 4.4%, 5.0%, and 5.2% on the basis of lyophilized dry weight. Furthermore, the extraction efficiency of the individual starting materials was compared with the data obtained for the eutectic mixtures, U![[thin space (1/6-em)]](https://www.rsc.org/images/entities/char_2009.gif) :
:![[thin space (1/6-em)]](https://www.rsc.org/images/entities/char_2009.gif) LA (Fig. S3†). From the results, we conclude that the individual aqueous solutions, namely LA and U, are not that effective at extracting collagen type I compared to the eutectic mixtures selected as the best solvents.
LA (Fig. S3†). From the results, we conclude that the individual aqueous solutions, namely LA and U, are not that effective at extracting collagen type I compared to the eutectic mixtures selected as the best solvents.
Fourier transform infrared spectroscopy (FTIR)
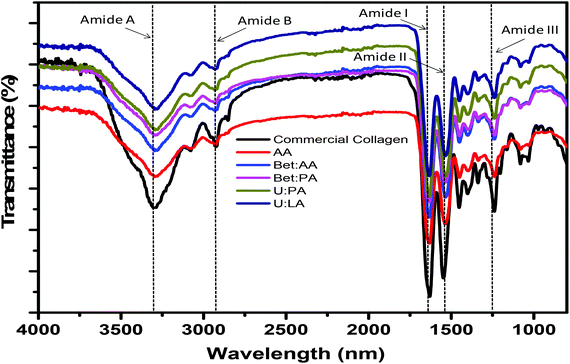
The structural integrity of collagen was characterized by FTIR. The FTIR spectra of the collagen type I from rat tail (commercial collagen), and codfish collagen extracted using AA and the aqueous solutions of DES are shown in Fig. 3. Although the FTIR spectra of commercial collagen show high similarity with the FTIR of collagen extracted using DES, the same behaviour is not verified when the FTIR of both treated and untreated collagen samples are compared (Fig. S4†). The collagen extracted using DES shows the main absorption bands for amide A at 3288 cm−1, amide B at 2926 cm−1, amide I at 1633 cm−1, amide II at 1535 cm−1, and amide III at 1240 cm−1, which are quite similar to the data previously reported for commercial collagen type I.29–33 The amide A band is associated with N–H stretching vibration. A free N–H stretching vibration occurs in the range of 3400–3440 cm−1, and when the NH group of a peptide is involved in a hydrogen bond, the position is shifted to a lower frequency, usually close to 3300 cm−1.34–37 Amide B represents the asymmetrical stretch of CH2, while amide I arises from C![[double bond, length as m-dash]](https://www.rsc.org/images/entities/char_e001.gif) O stretching, the amide II band is related to N–H bending vibrations, and the amide III band represents C–H stretching.31–36 The amide I band is associated with the secondary structure of the protein, and the amide III band confirmed the existence of a helical structure. The absorption ratio between the amide III and 1450 cm−1 bands was close to 1 for the control solvent, and for Bet
O stretching, the amide II band is related to N–H bending vibrations, and the amide III band represents C–H stretching.31–36 The amide I band is associated with the secondary structure of the protein, and the amide III band confirmed the existence of a helical structure. The absorption ratio between the amide III and 1450 cm−1 bands was close to 1 for the control solvent, and for Bet![[thin space (1/6-em)]](https://www.rsc.org/images/entities/char_2009.gif) :
:![[thin space (1/6-em)]](https://www.rsc.org/images/entities/char_2009.gif) PA (1
PA (1![[thin space (1/6-em)]](https://www.rsc.org/images/entities/char_2009.gif) :
:![[thin space (1/6-em)]](https://www.rsc.org/images/entities/char_2009.gif) 2), U
2), U![[thin space (1/6-em)]](https://www.rsc.org/images/entities/char_2009.gif) :
:![[thin space (1/6-em)]](https://www.rsc.org/images/entities/char_2009.gif) LA (1
LA (1![[thin space (1/6-em)]](https://www.rsc.org/images/entities/char_2009.gif) :
:![[thin space (1/6-em)]](https://www.rsc.org/images/entities/char_2009.gif) 2) (Table S4 in ESI†), indicating the existence of a triple helix in the collagen extracted from codfish skin,28,29 since these findings are similar for codfish and other marine species.29,38–40 The similarities between commercial collagen and collagen extracted from codfish skin confirmed maintenance of the secondary and triple helical structures of collagen type I with aqueous solutions of DES.
2) (Table S4 in ESI†), indicating the existence of a triple helix in the collagen extracted from codfish skin,28,29 since these findings are similar for codfish and other marine species.29,38–40 The similarities between commercial collagen and collagen extracted from codfish skin confirmed maintenance of the secondary and triple helical structures of collagen type I with aqueous solutions of DES.
Sodium dodecyl sulfate polyacrylamide gel electrophoresis (SDS-PAGE)
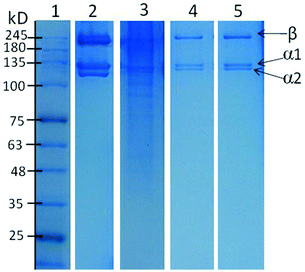
After proving the structural integrity of collagen type I extracted, its purity was checked by SDS-PAGE. Fig. 4 shows SDS-PAGE patterns of commercial collagen and collagen extracted using aqueous solutions of DES. As reported in the literature, most fish collagens consist of two different α-chains (α1 and α2) and a β-chain, characteristic of collagen type I.41,42 In Fig. 4, a clear resemblance of the component pattern and molecular weight can be observed for commercial as well as for collagen type I extracted using aqueous solutions of DES.In this analysis, two α-chains and one β-chain can be observed, which confirm the collagen extracted as being of type I. Some weak bands below 100 kDa were also observed when acetic acid was used as solvent, whereas no such bands were observed when the aqueous solutions of Bet![[thin space (1/6-em)]](https://www.rsc.org/images/entities/char_2009.gif) :
:![[thin space (1/6-em)]](https://www.rsc.org/images/entities/char_2009.gif) PA (1
PA (1![[thin space (1/6-em)]](https://www.rsc.org/images/entities/char_2009.gif) :
:![[thin space (1/6-em)]](https://www.rsc.org/images/entities/char_2009.gif) 2) and U
2) and U![[thin space (1/6-em)]](https://www.rsc.org/images/entities/char_2009.gif) :
:![[thin space (1/6-em)]](https://www.rsc.org/images/entities/char_2009.gif) LA (1
LA (1![[thin space (1/6-em)]](https://www.rsc.org/images/entities/char_2009.gif) :
:![[thin space (1/6-em)]](https://www.rsc.org/images/entities/char_2009.gif) 2) were applied. These lower bands represent products of degradation of collagen type I promoted during the extraction process.43 These results show the advantages of using aqueous solutions of DES as solvents instead of the conventional aqueous solution of acetic acid given the high extraction yields and purity achieved while maintaining the structural stability of collagen type I. Taking into account the whole set of results (extraction yields, chemical stability, and purity), the aqueous solution of U
2) were applied. These lower bands represent products of degradation of collagen type I promoted during the extraction process.43 These results show the advantages of using aqueous solutions of DES as solvents instead of the conventional aqueous solution of acetic acid given the high extraction yields and purity achieved while maintaining the structural stability of collagen type I. Taking into account the whole set of results (extraction yields, chemical stability, and purity), the aqueous solution of U![[thin space (1/6-em)]](https://www.rsc.org/images/entities/char_2009.gif) :
:![[thin space (1/6-em)]](https://www.rsc.org/images/entities/char_2009.gif) LA at 1
LA at 1![[thin space (1/6-em)]](https://www.rsc.org/images/entities/char_2009.gif) :
:![[thin space (1/6-em)]](https://www.rsc.org/images/entities/char_2009.gif) 2 was selected as the best solvent to extract collagen type I from codfish skin waste.
2 was selected as the best solvent to extract collagen type I from codfish skin waste.
Circular dichroism (CD) of collagen type I extracted using U![[thin space (1/6-em)]](https://www.rsc.org/images/entities/h3_char_2009.gif) :
:![[thin space (1/6-em)]](https://www.rsc.org/images/entities/h3_char_2009.gif) LA (1
LA (1![[thin space (1/6-em)]](https://www.rsc.org/images/entities/h3_char_2009.gif) :
:![[thin space (1/6-em)]](https://www.rsc.org/images/entities/h3_char_2009.gif) 2)
2)
CD spectroscopy is typically used to assess the secondary structure of a protein. Therefore, the potential changes in the secondary structure of collagen type I extracted using U![[thin space (1/6-em)]](https://www.rsc.org/images/entities/char_2009.gif) :
:![[thin space (1/6-em)]](https://www.rsc.org/images/entities/char_2009.gif) LA (1
LA (1![[thin space (1/6-em)]](https://www.rsc.org/images/entities/char_2009.gif) :
:![[thin space (1/6-em)]](https://www.rsc.org/images/entities/char_2009.gif) 2) were further investigated by CD analysis. In the far UV region, the CD spectrum of collagen type I shows a positive maximum at 220–222 nm, representative of a triple helix, and a pronounced negative minimum at 196–200 nm defining the random coil structure.23,38 From Fig. 5, both the positive and negative bands appeared for commercial collagen type I. A similar result was found for collagen type I extracted by U
2) were further investigated by CD analysis. In the far UV region, the CD spectrum of collagen type I shows a positive maximum at 220–222 nm, representative of a triple helix, and a pronounced negative minimum at 196–200 nm defining the random coil structure.23,38 From Fig. 5, both the positive and negative bands appeared for commercial collagen type I. A similar result was found for collagen type I extracted by U![[thin space (1/6-em)]](https://www.rsc.org/images/entities/char_2009.gif) :
:![[thin space (1/6-em)]](https://www.rsc.org/images/entities/char_2009.gif) LA (1
LA (1![[thin space (1/6-em)]](https://www.rsc.org/images/entities/char_2009.gif) :
:![[thin space (1/6-em)]](https://www.rsc.org/images/entities/char_2009.gif) 2), where a positive band, characteristic of the triple helix, was observed at 222 nm. However, no positive band was found for collagen type I extracted by acetic acid, indicating that its triple helix was not preserved, due to the dissociation of intermolecular interactions29 occurring when the control solvent was applied. Contrary to what happened to collagen extracted by acetic acid, the CD results confirmed the maintenance of the triple helix of collagen type I extracted by U
2), where a positive band, characteristic of the triple helix, was observed at 222 nm. However, no positive band was found for collagen type I extracted by acetic acid, indicating that its triple helix was not preserved, due to the dissociation of intermolecular interactions29 occurring when the control solvent was applied. Contrary to what happened to collagen extracted by acetic acid, the CD results confirmed the maintenance of the triple helix of collagen type I extracted by U![[thin space (1/6-em)]](https://www.rsc.org/images/entities/char_2009.gif) :
:![[thin space (1/6-em)]](https://www.rsc.org/images/entities/char_2009.gif) LA (1
LA (1![[thin space (1/6-em)]](https://www.rsc.org/images/entities/char_2009.gif) :
:![[thin space (1/6-em)]](https://www.rsc.org/images/entities/char_2009.gif) 2), a result previously corroborated by FTIR. All the results allow us to conclude that the collagen type I extracted using U
2), a result previously corroborated by FTIR. All the results allow us to conclude that the collagen type I extracted using U![[thin space (1/6-em)]](https://www.rsc.org/images/entities/char_2009.gif) :
:![[thin space (1/6-em)]](https://www.rsc.org/images/entities/char_2009.gif) LA (1
LA (1![[thin space (1/6-em)]](https://www.rsc.org/images/entities/char_2009.gif) :
:![[thin space (1/6-em)]](https://www.rsc.org/images/entities/char_2009.gif) 2) is not denatured.
2) is not denatured.
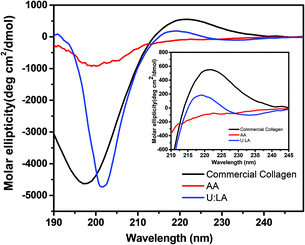 | ||
Fig. 5 Far-UV CD spectra of commercial collagen and collagen type I extracted from codfish skin using aqueous solutions of acetic acid and U![[thin space (1/6-em)]](https://www.rsc.org/images/entities/char_2009.gif) : :![[thin space (1/6-em)]](https://www.rsc.org/images/entities/char_2009.gif) LA (1 LA (1![[thin space (1/6-em)]](https://www.rsc.org/images/entities/char_2009.gif) : :![[thin space (1/6-em)]](https://www.rsc.org/images/entities/char_2009.gif) 2), obtained at 4 °C. 2), obtained at 4 °C. | ||
Thermal stability of collagen extracted using U![[thin space (1/6-em)]](https://www.rsc.org/images/entities/h3_char_2009.gif) :
:![[thin space (1/6-em)]](https://www.rsc.org/images/entities/h3_char_2009.gif) LA (1
LA (1![[thin space (1/6-em)]](https://www.rsc.org/images/entities/h3_char_2009.gif) :
:![[thin space (1/6-em)]](https://www.rsc.org/images/entities/h3_char_2009.gif) 2)
2)
The effect of temperature on the triple helix structure of collagen type I was also tested in the temperature range of 2 to 30 °C, at 220 nm (Fig. 6). The ellipticity of the positive peak decreased with an increase in temperature, proving that the triple helix structure of collagen is completely disturbed up to 10–11 °C. The collagen type I from codfish skins thermally denatures at 10.2 °C, a result in good agreement with findings previous reported in the literature for collagen from other fish species.44–46 It was also found that, compared with mammalian sources, marine collagen has a lower thermal stability due to differences in the content of proline and hydroxyproline in their structures.45,46
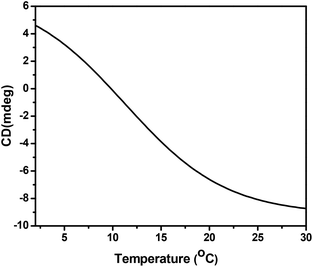 | ||
Fig. 6 Thermal denaturation curve of collagen type I from codfish skins extracted using an aqueous solution of U![[thin space (1/6-em)]](https://www.rsc.org/images/entities/char_2009.gif) : :![[thin space (1/6-em)]](https://www.rsc.org/images/entities/char_2009.gif) LA (1 LA (1![[thin space (1/6-em)]](https://www.rsc.org/images/entities/char_2009.gif) : :![[thin space (1/6-em)]](https://www.rsc.org/images/entities/char_2009.gif) 2) at 222 nm; heating rate of 0.1 °C min−1. 2) at 222 nm; heating rate of 0.1 °C min−1. | ||
Moreover, the thermal stability of collagen type I extracted from codfish skin wastes using U![[thin space (1/6-em)]](https://www.rsc.org/images/entities/char_2009.gif) :
:![[thin space (1/6-em)]](https://www.rsc.org/images/entities/char_2009.gif) LA (1
LA (1![[thin space (1/6-em)]](https://www.rsc.org/images/entities/char_2009.gif) :
:![[thin space (1/6-em)]](https://www.rsc.org/images/entities/char_2009.gif) 2) was reconfirmed by differential scanning calorimetry (DSC) (Fig. S5 from ESI†), where the melting temperature was found to be 10.5 °C.
2) was reconfirmed by differential scanning calorimetry (DSC) (Fig. S5 from ESI†), where the melting temperature was found to be 10.5 °C.
XRD of collagen type I extracted using U![[thin space (1/6-em)]](https://www.rsc.org/images/entities/h3_char_2009.gif) :
:![[thin space (1/6-em)]](https://www.rsc.org/images/entities/h3_char_2009.gif) LA (1
LA (1![[thin space (1/6-em)]](https://www.rsc.org/images/entities/h3_char_2009.gif) :
:![[thin space (1/6-em)]](https://www.rsc.org/images/entities/h3_char_2009.gif) 2)
2)
Fig. 7 shows the X-ray spectrum of the lyophilized collagen type I extracted using U![[thin space (1/6-em)]](https://www.rsc.org/images/entities/char_2009.gif) :
:![[thin space (1/6-em)]](https://www.rsc.org/images/entities/char_2009.gif) LA (1
LA (1![[thin space (1/6-em)]](https://www.rsc.org/images/entities/char_2009.gif) :
:![[thin space (1/6-em)]](https://www.rsc.org/images/entities/char_2009.gif) 2). Two diffraction peaks at diffraction angles (2θ) around 7.6° (representing the triple helix conformation) and 20° were identified, both characteristic of collagen.30,47 Moreover, the same conclusion is made considering the similarity between the XRD patterns obtained for the commercial collagen and collagen type I extracted using an aqueous solution of U
2). Two diffraction peaks at diffraction angles (2θ) around 7.6° (representing the triple helix conformation) and 20° were identified, both characteristic of collagen.30,47 Moreover, the same conclusion is made considering the similarity between the XRD patterns obtained for the commercial collagen and collagen type I extracted using an aqueous solution of U![[thin space (1/6-em)]](https://www.rsc.org/images/entities/char_2009.gif) :
:![[thin space (1/6-em)]](https://www.rsc.org/images/entities/char_2009.gif) LA (1
LA (1![[thin space (1/6-em)]](https://www.rsc.org/images/entities/char_2009.gif) :
:![[thin space (1/6-em)]](https://www.rsc.org/images/entities/char_2009.gif) 2).
2).
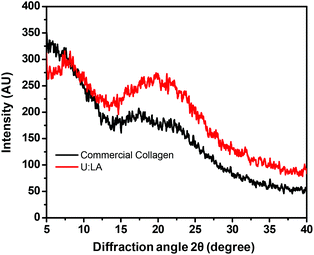 | ||
Fig. 7 XRD spectra of commercial collagen type I, and collagen extracted from codfish skin using AA and U![[thin space (1/6-em)]](https://www.rsc.org/images/entities/char_2009.gif) : :![[thin space (1/6-em)]](https://www.rsc.org/images/entities/char_2009.gif) LA (1 LA (1![[thin space (1/6-em)]](https://www.rsc.org/images/entities/char_2009.gif) : :![[thin space (1/6-em)]](https://www.rsc.org/images/entities/char_2009.gif) 2) at room temperature. 2) at room temperature. | ||
Effect of the concentration of U![[thin space (1/6-em)]](https://www.rsc.org/images/entities/h3_char_2009.gif) :
:![[thin space (1/6-em)]](https://www.rsc.org/images/entities/h3_char_2009.gif) LA (1
LA (1![[thin space (1/6-em)]](https://www.rsc.org/images/entities/h3_char_2009.gif) :
:![[thin space (1/6-em)]](https://www.rsc.org/images/entities/h3_char_2009.gif) 2) on the extraction of collagen type I
2) on the extraction of collagen type I
After selecting the aqueous solution of U![[thin space (1/6-em)]](https://www.rsc.org/images/entities/char_2009.gif) :
:![[thin space (1/6-em)]](https://www.rsc.org/images/entities/char_2009.gif) LA (1
LA (1![[thin space (1/6-em)]](https://www.rsc.org/images/entities/char_2009.gif) :
:![[thin space (1/6-em)]](https://www.rsc.org/images/entities/char_2009.gif) 2) as the most efficient at extracting collagen type I from codfish skins without compromising its chemical structure and thermal properties, its concentration in water was optimized. An initial screening with U
2) as the most efficient at extracting collagen type I from codfish skins without compromising its chemical structure and thermal properties, its concentration in water was optimized. An initial screening with U![[thin space (1/6-em)]](https://www.rsc.org/images/entities/char_2009.gif) :
:![[thin space (1/6-em)]](https://www.rsc.org/images/entities/char_2009.gif) LA (1
LA (1![[thin space (1/6-em)]](https://www.rsc.org/images/entities/char_2009.gif) :
:![[thin space (1/6-em)]](https://www.rsc.org/images/entities/char_2009.gif) 2) at different concentrations from 0.15 to 1 M was performed, with the results depicted in Fig. 8. An increase in the concentration of U
2) at different concentrations from 0.15 to 1 M was performed, with the results depicted in Fig. 8. An increase in the concentration of U![[thin space (1/6-em)]](https://www.rsc.org/images/entities/char_2009.gif) :
:![[thin space (1/6-em)]](https://www.rsc.org/images/entities/char_2009.gif) LA (1
LA (1![[thin space (1/6-em)]](https://www.rsc.org/images/entities/char_2009.gif) :
:![[thin space (1/6-em)]](https://www.rsc.org/images/entities/char_2009.gif) 2) leads to an increase in the collagen type I extraction yield from 3.4 to 6.0%.
2) leads to an increase in the collagen type I extraction yield from 3.4 to 6.0%.
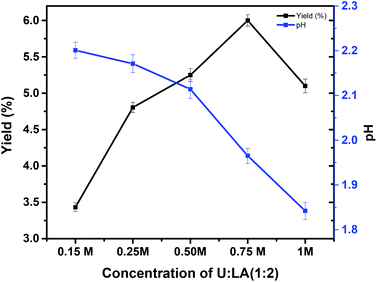 | ||
Fig. 8 pH and yield (%) of collagen type I obtained at various concentrations of U![[thin space (1/6-em)]](https://www.rsc.org/images/entities/char_2009.gif) : :![[thin space (1/6-em)]](https://www.rsc.org/images/entities/char_2009.gif) LA (1 LA (1![[thin space (1/6-em)]](https://www.rsc.org/images/entities/char_2009.gif) : :![[thin space (1/6-em)]](https://www.rsc.org/images/entities/char_2009.gif) 2) in water, for extractions done at 4 °C. 2) in water, for extractions done at 4 °C. | ||
However, a decrease in the yield of extraction above 0.75 M was observed, which may be a result of the more acidic pH created when the DES concentration is increased (pH values in Fig. 9 – blue line). The extracted collagen samples were again characterized by FTIR (Fig. 9A) and SDS-PAGE (Fig. 9B). For all concentrations, and at room temperature, the collagen samples exhibited amide A, amide B, amide I, amide II, and amide III, as expected.
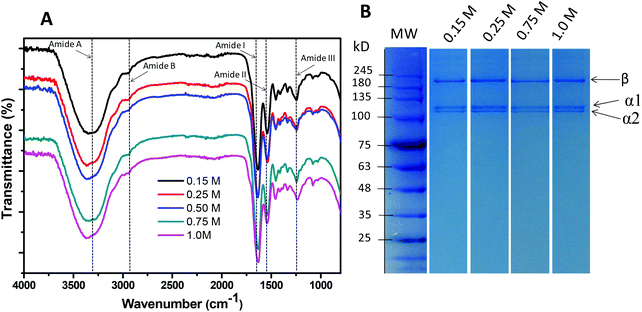 | ||
Fig. 9 Characterization of collagen extracted from the skin of codfish using U![[thin space (1/6-em)]](https://www.rsc.org/images/entities/char_2009.gif) : :![[thin space (1/6-em)]](https://www.rsc.org/images/entities/char_2009.gif) LA (1 LA (1![[thin space (1/6-em)]](https://www.rsc.org/images/entities/char_2009.gif) : :![[thin space (1/6-em)]](https://www.rsc.org/images/entities/char_2009.gif) 2) at different concentrations: (A) FTIR spectra; (B) SDS-PAGE. 2) at different concentrations: (A) FTIR spectra; (B) SDS-PAGE. | ||
To confirm the purity of the extracted collagen, an SDS-PAGE was performed, where two clear bands attributed to α-chains and one β-chain were found (Fig. 9B), thus demonstrating the typical result obtained for collagen type I. All the results allow us to conclude that aqueous solutions of DES display much better performance in extracting pure collagen type I from codfish skins than the conventional approach using aqueous solutions of organic acids.
Environmental assessment
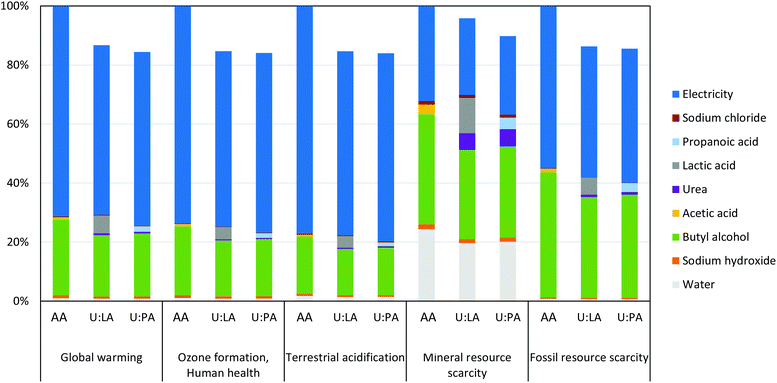
The three systems evaluated with LCA have distinct collagen yields and, therefore, the LCA results are expressed per 1 g of collagen obtained to allow a comparison of the environmental performance of those systems. The total impacts related with the environmental categories of global warming (equivalent to the carbon footprint), ozone formation, human health, terrestrial acidification, mineral resource scarcity and fossil resource scarcity are shown in Table S5.† These results should be understood as worst-case scenarios, as electricity consumption is likely to be overestimated because it was calculated based on the nominal power of the equipment instead of being measured. The relative contributions of each input to the total impacts of each system are identified in Fig. 10. The highest impacts are obtained when acetic acid is used in collagen extraction. Extraction with U![[thin space (1/6-em)]](https://www.rsc.org/images/entities/char_2009.gif) :
:![[thin space (1/6-em)]](https://www.rsc.org/images/entities/char_2009.gif) LA (1
LA (1![[thin space (1/6-em)]](https://www.rsc.org/images/entities/char_2009.gif) :
:![[thin space (1/6-em)]](https://www.rsc.org/images/entities/char_2009.gif) 2) and U
2) and U![[thin space (1/6-em)]](https://www.rsc.org/images/entities/char_2009.gif) :
:![[thin space (1/6-em)]](https://www.rsc.org/images/entities/char_2009.gif) PA (1
PA (1![[thin space (1/6-em)]](https://www.rsc.org/images/entities/char_2009.gif) :
:![[thin space (1/6-em)]](https://www.rsc.org/images/entities/char_2009.gif) 2) reduces the environmental impacts by 13–16% in all categories other than mineral resource scarcity in which the impacts decrease by only 4 and 10%, respectively, compared with AA (conventional solvent). The higher impacts of the conventional system result mainly from the lower collagen yield obtained. The system based on U
2) reduces the environmental impacts by 13–16% in all categories other than mineral resource scarcity in which the impacts decrease by only 4 and 10%, respectively, compared with AA (conventional solvent). The higher impacts of the conventional system result mainly from the lower collagen yield obtained. The system based on U![[thin space (1/6-em)]](https://www.rsc.org/images/entities/char_2009.gif) :
:![[thin space (1/6-em)]](https://www.rsc.org/images/entities/char_2009.gif) LA (1
LA (1![[thin space (1/6-em)]](https://www.rsc.org/images/entities/char_2009.gif) :
:![[thin space (1/6-em)]](https://www.rsc.org/images/entities/char_2009.gif) 2) has a slightly higher collagen yield, which leads to lower impacts in the steps of codfish skin preparation and collagen extraction (Fig. S6†) compared with the system using U
2) has a slightly higher collagen yield, which leads to lower impacts in the steps of codfish skin preparation and collagen extraction (Fig. S6†) compared with the system using U![[thin space (1/6-em)]](https://www.rsc.org/images/entities/char_2009.gif) :
:![[thin space (1/6-em)]](https://www.rsc.org/images/entities/char_2009.gif) PA (1
PA (1![[thin space (1/6-em)]](https://www.rsc.org/images/entities/char_2009.gif) :
:![[thin space (1/6-em)]](https://www.rsc.org/images/entities/char_2009.gif) 2). Consequently, the system based on U
2). Consequently, the system based on U![[thin space (1/6-em)]](https://www.rsc.org/images/entities/char_2009.gif) :
:![[thin space (1/6-em)]](https://www.rsc.org/images/entities/char_2009.gif) LA (1
LA (1![[thin space (1/6-em)]](https://www.rsc.org/images/entities/char_2009.gif) :
:![[thin space (1/6-em)]](https://www.rsc.org/images/entities/char_2009.gif) 2) has impacts similar to those of the system based on U
2) has impacts similar to those of the system based on U![[thin space (1/6-em)]](https://www.rsc.org/images/entities/char_2009.gif) :
:![[thin space (1/6-em)]](https://www.rsc.org/images/entities/char_2009.gif) PA (1
PA (1![[thin space (1/6-em)]](https://www.rsc.org/images/entities/char_2009.gif) :
:![[thin space (1/6-em)]](https://www.rsc.org/images/entities/char_2009.gif) 2), although about 7% higher in the mineral resource scarcity category. It is no surprise that the step of collagen extraction and purification has the largest share of impacts followed by codfish skin preparation and, finally, solubilisation of collagen, for all impact categories and systems (Fig. S6†). Most of the total impacts of the three systems derive from electricity consumption (51–77%) followed by butyl alcohol consumption (19–42%), with the exception being mineral resource scarcity. In this category, 32–37% of the impacts come from butyl alcohol consumption, 27–32% from electricity consumption, and 16–19% from deionized water consumption. The mix of electricity production technology in Portugal was considered in the calculations, which includes almost 55% of renewable sources. The impacts can be reduced by changing the electricity mix. For example, if 100% photovoltaic electricity was consumed, the carbon footprint would be reduced by 64–69%.
2), although about 7% higher in the mineral resource scarcity category. It is no surprise that the step of collagen extraction and purification has the largest share of impacts followed by codfish skin preparation and, finally, solubilisation of collagen, for all impact categories and systems (Fig. S6†). Most of the total impacts of the three systems derive from electricity consumption (51–77%) followed by butyl alcohol consumption (19–42%), with the exception being mineral resource scarcity. In this category, 32–37% of the impacts come from butyl alcohol consumption, 27–32% from electricity consumption, and 16–19% from deionized water consumption. The mix of electricity production technology in Portugal was considered in the calculations, which includes almost 55% of renewable sources. The impacts can be reduced by changing the electricity mix. For example, if 100% photovoltaic electricity was consumed, the carbon footprint would be reduced by 64–69%.
Conclusions
The sustainability of a process relies on its advantages in considering three main issues: (i) raw material(s), (ii) solvent(s) and technologies and (iii) final products. In this work, codfish skins, which are abundant waste from fish industries, were used as a source of collagen type I. An efficient, simple, and more environmentally friendly method to recover collagen using aqueous solutions of DES was successfully developed. Briefly, and after exploring the potential of different aqueous solutions of DES, the aqueous solution of U![[thin space (1/6-em)]](https://www.rsc.org/images/entities/char_2009.gif) :
:![[thin space (1/6-em)]](https://www.rsc.org/images/entities/char_2009.gif) LA (1
LA (1![[thin space (1/6-em)]](https://www.rsc.org/images/entities/char_2009.gif) :
:![[thin space (1/6-em)]](https://www.rsc.org/images/entities/char_2009.gif) 2) was selected as the most efficient. The extraction yield, the purity, chemical structure, and thermal stability of collagen obtained with U
2) was selected as the most efficient. The extraction yield, the purity, chemical structure, and thermal stability of collagen obtained with U![[thin space (1/6-em)]](https://www.rsc.org/images/entities/char_2009.gif) :
:![[thin space (1/6-em)]](https://www.rsc.org/images/entities/char_2009.gif) LA (1
LA (1![[thin space (1/6-em)]](https://www.rsc.org/images/entities/char_2009.gif) :
:![[thin space (1/6-em)]](https://www.rsc.org/images/entities/char_2009.gif) 2) from codfish skins were far superior to those obtained in the conventional process using an aqueous solution of AA. This work is expected to contribute to the development of sustainable downstream processes positioned at the interface between green technology and blue economy, following the guidelines of the sustainable utilization of the oceans under the scope of a circular economy approach.
2) from codfish skins were far superior to those obtained in the conventional process using an aqueous solution of AA. This work is expected to contribute to the development of sustainable downstream processes positioned at the interface between green technology and blue economy, following the guidelines of the sustainable utilization of the oceans under the scope of a circular economy approach.
Conflicts of interest
There are no conflicts of interest to declare.Acknowledgements
This work was developed within the scope of the projects CICECO-Aveiro Institute of Materials, UIDB/50011/2020 & UIDP/50011/2020, and CESAM, UIDB/50017/2020 & UIDP/50017/2020, financed by national funds through the Portuguese Foundation for Science and Technology/MCTES. The authors also thank for the BPD funded project under PAC: Multipurpose strategies for the recovery of a wide range of agro-forestry and fisheries by-products: a step in the creation of an integrated biorefinery POCI-01-145-FEDER-016403 - SAICTPAC/0040/2015. M. Martins thanks FCT for the doctoral grant (SFRH/BD/122220/2016). A. Dias thanks FCT for her contract CEECIND/02174/2017.References
- F. M. Kerton, Y. Liu, K. W. Omari and K. Hawboldt, Green Chem., 2013, 15, 860 RSC.
- X. Cheng, Z. Shao, C. Li, L. Yu, M. A. Raja and C. Liu, PLoS One, 2017, 12(1), e0169731 CrossRef PubMed.
- D. J. Prockop and K. I. Kivirikko, Annu. Rev. Biochem., 1995, 64, 403–434 CrossRef CAS PubMed.
- J. A. Hodges and R. T. Raines, J. Am. Chem. Soc., 2003, 125, 9262–9263 CrossRef CAS PubMed.
- R. Radhakrishnan, P. Ghosh, T. A. Selvakumar, M. Shanmugavel and A. Gnanamani, Adv. Tissue Eng. Regen. Med., 2020, 6, 26–35 Search PubMed.
- J. K. Wang, K. P. Yeo, Y. Y. Chun, T. T. Y. Tan, N. S. Tan, V. Angeli and C. Choong, Acta Biomater., 2017, 63, 246 CrossRef CAS PubMed.
- L. Alves, A. L. P. Marques, E. Martins, T. H. Silva and R. L. Reis, Cosmetics, 2017, 4, 39 CrossRef.
- C. H. Lee, A. Singla and Y. Lee, Int. J. Pharm., 2001, 221, 1–22 CrossRef CAS PubMed.
- K. Silvipriya, K. K. Kumar, B. D. Kumar, A. John and P. Lakshmanan, Curr. Trends Biotechnol. Pharm., 2016, 10, 374–383 CAS.
- M. C. G. Guillén, B. Giménez, M. E. L. Caballero and M. P. Montero, Food Hydrocolloids, 2011, 25, 1813–1827 CrossRef.
- M. Sadowska, I. Koodziejska and C. Niecikowska, Food Chem., 2003, 81, 257–262 CrossRef CAS.
- J. Elango, B. Bin, B. Yongshi, Z. Yu, Z. Qingbo and W. Wenhui, Mar. Drugs, 2014, 12, 3852–3873 CrossRef PubMed.
- L. Wang, X. An, Z. Xın, L. Zhao and Q. Hu, J. Food Sci., 2007, 72, 450–455 CrossRef PubMed.
- M. M. Schmidt, R. C. P. Dornelles, R. O. Mello, E. H. Kubota, M. A. Mazutti, A. P. Kempka and I. M. Demiate, Int. Food Res. J., 2016, 23, 913–922 CAS.
- R. P. Bareil, R. Gauvin and F. Berthod, Materials, 2010, 3, 1863–1887 CrossRef.
- M. Raman and K. Gopakumar, EC Nutrition, 2018, 13, 752–767 Search PubMed.
- E. Leikina, M. V. Mertts, N. Kuznetsova and S. Leikin, Proc. Natl. Acad. Sci. U. S. A., 2002, 99, 1314–1318 CrossRef CAS PubMed.
- A. P. Abbott, D. Boothby, G. Capper, D. L. Davies and R. K. Rasheed, J. Am. Chem. Soc., 2004, 126, 9142–9147 CrossRef CAS PubMed.
- F. P. Pereira and J. Namiesnik, ChemSusChem, 2014, 7, 1784–1800 CrossRef PubMed.
- A. P. Abbott, G. Capper, D. L. Davies, R. K. Rasheed and V. Tambyrajah, Chem. Commun., 2003, 99, 70–71 RSC.
- H. Passos, M. G. Freire and J. A. P. Coutinho, Green Chem., 2014, 16, 4786–4815 RSC.
- V. Vieira, M. A. Prieto, L. Barros, J. A. P. Coutinho, I. C. F. R. Ferreira and O. Ferreira, Ind. Crops Prod., 2018, 115, 261–271 CrossRef CAS.
- M. Ruesgas-Ramón, M. C. Figueroa-Espinoza and E. Durand, J. Agric. Food Chem., 2017, 65, 3591–3601 CrossRef PubMed.
- B. Soares, D. J. P. Tavares, J. L. Amaral, A. J. D. Silvestre, C. S. R. Freire and J. A. P. Coutinho, ACS Sustainable Chem. Eng., 2017, 5, 4056–4065 CrossRef CAS.
- C. Bai, Q. Wei and X. Ren, ACS Sustainable Chem. Eng., 2017, 5, 7220–7227 CrossRef CAS.
- A. Triolo, F. L. Celso, M. Brehm, V. D. Lisio and O. Russina, J. Mol. Liq., 2021, 331, 115750 CrossRef CAS.
- T. Nagai and N. Suzuki, Food Chem., 2000, 68, 277–281 CrossRef CAS.
- L. Alves, A. L. P. Marques, E. Martins, T. H. Silva and R. L. Reis, Cosmetics, 2017, 4, 39 CrossRef.
- A. M. Carvalho, A. P. Marques, T. H. Silva and R. L. Reis, Mar. Drugs, 2018, 16, 495 CrossRef CAS PubMed.
- G. Wernet, C. Bauer, B. Steubing, J. Reinhard, E. Moreno-Ruiz and B. Weidema, Int. J. Life Cycle Assess., 2016, 21, 1218–1230 CrossRef.
- M. A. J. Huijbregts, Z. J. N. Steinmann, P. M. F. Elshout, G. Stam, F. Verones, M. Vieira, M. Zijp, A. Hollander and R. van Zelm, Int. J. Life Cycle Assess., 2017, 22, 138–147 CrossRef.
- B. B. Doyle, E. G. Bendit and E. R. Blout, Biopolymers, 1975, 14, 937–957 CrossRef CAS PubMed.
- E. Skierka and M. Sadowska, Food Chem., 2007, 105, 1302–1306 CrossRef CAS.
- A. Veeruraj, M. Arumugam, T. Ajithkumar and T. Balasubramanian, J. Mater. Sci. Mater. Med., 2012, 23, 1729–1738 CrossRef CAS PubMed.
- R. Duan, J. Zhang, X. Du, X. Yao and K. Konno, Food Chem., 2009, 112, 702–706 CrossRef CAS.
- T. Nagai, E. Yamashita, K. Taniguchi, N. Kanamori and N. Suzuki, Food Chem., 2001, 72, 425–429 CrossRef CAS.
- L. Wang, X. An, Z. Xin, L. Zhao and Q. Hua, Food Chem., 2008, 108, 616–623 CrossRef CAS PubMed.
- F. Pati, B. Adhikari and S. Dhara, Bioresour. Technol., 2010, 101, 3737–3742 CrossRef CAS PubMed.
- A. A. Barros, I. M. Aroso, T. H. Silva, J. O. F. Mano, A. R. C. Duarte and R. L. Reis, ACS Sustainable Chem. Eng., 2015, 3, 254–260 CrossRef CAS.
- J. K. Lee, S. I. Kang, Y. J. Kim, M. J. Kim, M. S. Heu, B. D. Choi and J.-S. Kim, Food Sci. Biotechnol., 2016, 25, 131–136 CrossRef CAS PubMed.
- H. Liu, D. Li and S. Guo, Food Chem., 2007, 101, 621–625 CrossRef CAS.
- J. Bailey and N. D. Light, Elsevier Applied Science, New York, 1989 Search PubMed.
- G. Sotelo, M. B. Comesaña, P. R. Ariza and R. I. P. Martín, J. Aquat. Food Prod. Technol., 2015, 25, 388–399 CrossRef.
- R. Tylingo, S. Mania, A. Panek, R. Piątek and R. Pawłowicz, J. Biotechnol. Biomater., 2016, 6, 234 Search PubMed.
- A. Karim and R. Bhat, Food Hydrocolloids, 2009, 23, 563–576 CrossRef CAS.
- M. G. Guillén, B. Giménez, M. López-Caballero and M. Montero, Food Hydrocolloids, 2011, 25, 1813–1827 CrossRef.
- F. Zhang, A. Wang, Z. Li, S. He and L. Shao, Food Nutr. Sci., 2011, 2, 818–823 CAS.
Footnote |
| † Electronic supplementary information (ESI) available: Detailed data for the phase diagrams are presented. See DOI: 10.1039/d1gc01432c |
| This journal is © The Royal Society of Chemistry 2021 |

