 Open Access Article
Dual modification of LiNi0.6Co0.2Mn0.2O2 with MgHPO4 as a high-performance cathode material for Li-ion batteries†
Wujie
Ge
a,
Yuanxiang
Fu
a,
Xianguo
Ma
a,
Xiang
Li
 *b and
Gongchang
Peng
*c
aSchool of Chemical Engineering, Guizhou Institute of Technology, Guiyang, 550003, P. R. China
bSchool of Chemical Engineer and Pharmacy, Henan University of Science and Technology, Luoyang, 471023, P. R. China. E-mail: lixiang@haust.edu.cn
cChengdu Institute of Organic Chemistry, Chinese Academy of Sciences, Chengdu 610041, P. R. China. E-mail: pgc0102@cioc.ac.cn
First published on 8th December 2021
Abstract
MgHPO4 has been introduced as a reactant that interacts with LiNi0.6Co0.2Mn0.2O2 (NCM622) to achieve the dual modification of Mg2+ gradient doping and Li3PO4 surface coating. The structure, morphology, elemental distribution, and electrochemical properties of the materials are elaborately explored using X-ray diffraction (XRD), transmission electron microscopy (TEM), scanning electron microscopy (SEM), energy-dispersive X-ray spectroscopy (EDX), X-ray photoelectron spectroscopy (XPS), and electrochemical measurements. On the one hand, Mg2+ gradient doping stabilizes the crystal structure of the Li+/Ni2+ cation and minimizes its disorder. On the other hand, the coating of the fast lithium-ion conductor Li3PO4 not only increases the rate of lithium-ion diffusion at the electrode–electrolyte interface but also protects the cathodic material and mitigates electrolyte corrosion. The dual-modified NCM622 cathode exhibits remarkable cycling performance, retaining 89.57% of its capacity after 200 cycles at 1C from 2.8 to 4.3 V and 79.03% after 100 cycles at 3C from 2.8 to 4.5 V. Additionally, the dual-modified cathode exhibits better electrode kinetics and a reversible capacity of 119.4 mA h g−1 at 10C. This straightforward dual modification technique improves the lithium-ion diffusion kinetics at the interface while also stabilizing the internal crystal structure of Ni-rich cathode materials.
1. Introduction
With the development of electric cars and hybrid electric vehicles, rechargeable lithium-ion batteries (LIBs) have occupied a sizable market share as a primary power source. It is widely accepted that the cathode material has a significant impact on the performance of LIBs. The Ni-rich ternary cathode material has attracted an increasing number of researchers in recent years as a means of enhancing the energy density of LIBs to satisfy the demands of the increased driving distance. In comparison with the first marketed LiCoO2 cathode material, the Ni-rich ternary cathode material has superior charge/discharge performance, lesser toxicity, cheaper cost, and no requirement for a high voltage electrolyte.1,2 In the case of the nickel-rich ternary cathode material, the high nickel content may assure a greater rechargeable capacity, the recommended manganese concentration may ensure the structural stability, and the low cobalt content may reduce the cost.3,4Among the Ni-rich ternary cathode material, LiNi0.6Co0.2Mn0.2O2 (NCM622) has been thought to be a prospective one due to its high specific capacity, environmental friendliness, cost economy, and relatively moderate sensitivity to air and moisture. Unfortunately, due to the similar ionic radii of Ni2+ (0.069 nm) and Li+ (0.074 nm), Ni2+ easily occupies lithium sites to form spinel and rock salt structures, a process known as cation mixing, which results in structural collapse, a higher energy barrier for lithium-ion migration, and capacity fading during cycling. Additionally, during the charging and discharging processes, the cathode material is constantly exposed to the electrolyte and subjected to electrolyte corrosion, referred to as side reactions, which degrades the stability of the electrode/electrolyte interfaces and degrades the cycling performance of the material.5–7 These disadvantages must be overcome before the NCM622 cathode materials can be widely employed.
Doping with elements has been established as a viable technique for reducing cation mixing and delaying the irreversible deterioration of the structural framework of the NCM622 materials.8–13 The ionic radii of Ni2+, Li+, and Mg2+ being comparable, a trace quantity of the inert element Mg can diffuse into the NCM622 crystal and occupy both Li and transition metal sites. By incorporating Mg2+ into the host crystal, it is possible to limit cation mixing and hence increase the structural stability during cycling.14 For example, Zhang et al. discovered that Mg doping can increase the crystal lattice space, reduce the extent of cation mixing, and speed the transport of Li+, resulting in optimum electrochemical performance for the Mg-doped sample.15
Targeting the electrode/electrolyte interfacial problem, many efforts have been made in recent years. Surface modification is widely acknowledged as an effective means of stabilizing interfaces by acting like a protective layer between the electrolyte and the electrode, hence improving the cycling performance.16–22 For instance, Mo et al. investigated the influence of a TiO2 nanolayer coating in NCM622, and the results indicate that the NCM622 with TiO2 incorporation can deliver 96% capacity retention after 200 cycles, which is 18% high in comparison to that of the uncoated one. However, due to the ionic insulating properties, the TiO2-coated electrode displays a lower first discharge capacity and a first coulombic efficiency.16 As a result, the optimal surface modification layer must exhibit both a strong resistance to the electrolyte and an excellent lithium-ion conductivity. Li3PO4 has been effectively employed for modification of Ni-rich ternary cathode materials with a lithium-ion conductivity of 10−8 S cm−1.23–26 For example, Li3PO4-coated NCM622 exhibited noticeable improvement in cycling retention at a high cut-off voltage of 4.7 V,24 and Jo et al. revealed that the Li3PO4 coating layers perform a variety of tasks, including water absorption in the electrolyte, reducing the HF level, facilitating Li+ transport, and protecting the active material from electrolyte side reactions.23
The above review implies that the doping element Mg can decrease cation mixing and enhance the structural stability of the host material, and the Li3PO4 surface coating layers can alleviate the electrode/electrolyte interfacial problem. Inspired by this, in this work, we introduced Mg and Li3PO4 at the same time, aiming at maximizing their beneficial effects and improving the active material from the inside to the surface, using a simple one-step solid-phase synthesis method.
2. Experimental
2.1 Material synthesis
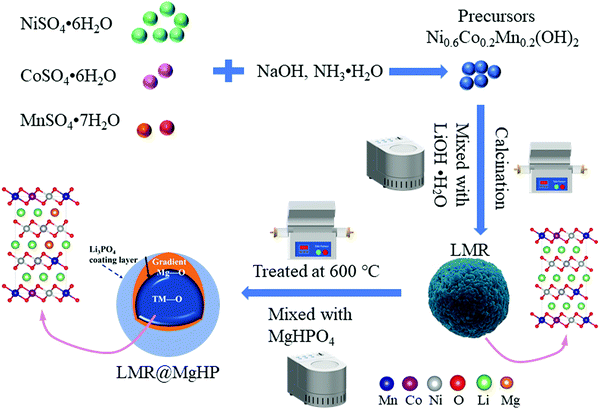
A hydroxide coprecipitation method was employed to synthesize the spherical precursor powder Ni0.6Co0.2Mn0.2(OH)2 using NaOH and NH3·H2O as a precipitant and a chelating agent, respectively. Initially, 2 mol L−1 aqueous solutions of NiSO4·6H2O, CoSO4·6H2O, and MnSO4·7H2O were made by dissolving stoichiometric amounts of each in deionized water. The aforesaid aqueous solutions, 4 mol L−1 sodium hydroxide, and the necessary amount of the NH3·H2O solution were all concurrently pumped into a tank reactor under a nitrogen atmosphere while being stirred constantly. Throughout the procedure, the temperature was maintained at 55 °C and the pH was maintained at approximately 11. Then, the precursor powder Ni0.6Co0.2Mn0.2(OH)2 was collected after filtration, washed, and then dried. The pristine LiNi0.6Co0.2Mn0.2O2 was obtained by sintering the well-mixed hydroxide precursor powder and LiOH·H2O powder (at a molar ratio of 1![[thin space (1/6-em)]](https://www.rsc.org/images/entities/char_2009.gif) :
:![[thin space (1/6-em)]](https://www.rsc.org/images/entities/char_2009.gif) 1.05) at 500 °C for 3 h and then at 850 °C for 12 h under an oxygen flow.
1.05) at 500 °C for 3 h and then at 850 °C for 12 h under an oxygen flow.
The modified samples were obtained by thoroughly mixing the LiNi0.6Co0.2Mn0.2O2 powder with an appropriate amount of MgHPO4 in mass ratios of 100![[thin space (1/6-em)]](https://www.rsc.org/images/entities/char_2009.gif) :
:![[thin space (1/6-em)]](https://www.rsc.org/images/entities/char_2009.gif) 1, 100
1, 100![[thin space (1/6-em)]](https://www.rsc.org/images/entities/char_2009.gif) :
:![[thin space (1/6-em)]](https://www.rsc.org/images/entities/char_2009.gif) 2, and 100
2, and 100![[thin space (1/6-em)]](https://www.rsc.org/images/entities/char_2009.gif) :
:![[thin space (1/6-em)]](https://www.rsc.org/images/entities/char_2009.gif) 5 and calcined at 600 °C for 5 h in air, and were labeled as LMR@MgHP-1, LMR@MgHP-2 and LMR@MgHP-5, respectively. For comparison, the as-prepared LiNi0.6Co0.2Mn0.2O2 powder was also treated at 600 °C for 5 h in the air (recorded as LMR). The schematic process of preparation is shown in Fig. 1.
5 and calcined at 600 °C for 5 h in air, and were labeled as LMR@MgHP-1, LMR@MgHP-2 and LMR@MgHP-5, respectively. For comparison, the as-prepared LiNi0.6Co0.2Mn0.2O2 powder was also treated at 600 °C for 5 h in the air (recorded as LMR). The schematic process of preparation is shown in Fig. 1.
2.2 Characterization of the material
To characterize the phase of all samples and to establish the lattice parameters of the structure, powder X-ray diffraction (XRD, Bruker D8 AVANCE) with Cu-Kα radiation (40 KV, 40 mA) was utilized. The XRD data were obtained at a scanning rate of 0.02° s−1 over a two-dimensional range of 10°–100° and employing a count rate of 2 s. Scanning electron microscopy (SEM, INCA Pen-taFETx3) and transmission electron microscopy (TEM, JEOL JEM-2010F) were used to determine the morphology and size of the particles. The variations in atomic concentration as a function of the depth were detected using focused ion beam scanning electron microscopy (FIB-SEM, ZEISS Crossbeam 540). The surface chemical composition and element distribution of the specimens were ascertained using X-ray photoelectron spectroscopy (XPS, Thermo Scientific K-Alpha).2.3 Electrochemical measurements
To make a typical positive electrode, a homogenous slurry was made by mixing carbon black, the active material, and a polyvinylidene fluoride binder in a weight ratio of 90![[thin space (1/6-em)]](https://www.rsc.org/images/entities/char_2009.gif) :
:![[thin space (1/6-em)]](https://www.rsc.org/images/entities/char_2009.gif) 6
6![[thin space (1/6-em)]](https://www.rsc.org/images/entities/char_2009.gif) :
:![[thin space (1/6-em)]](https://www.rsc.org/images/entities/char_2009.gif) 4, using the solvating agent N-methyl-2-pyrrolidone. After casting the slurry onto an Al foil current collector and drying it for 3 hours at 105 °C in a vacuum oven, the dried foil was roll pressed. Finally, circular electrodes having a diameter of 12 mm were cut out from the coated Al foil and dried overnight at 105 °C in a vacuum oven to get rid of oxygen and water, resulting in an active material loading density of approximately 2.1 mg cm−2. To determine the electrochemical performance of the samples, CR2032 coin-type half-cells were constructed in an argon-filled glove box using 1 M LiPF6 in ethylene carbonate/dimethyl carbonate (EC/DMC) (1
4, using the solvating agent N-methyl-2-pyrrolidone. After casting the slurry onto an Al foil current collector and drying it for 3 hours at 105 °C in a vacuum oven, the dried foil was roll pressed. Finally, circular electrodes having a diameter of 12 mm were cut out from the coated Al foil and dried overnight at 105 °C in a vacuum oven to get rid of oxygen and water, resulting in an active material loading density of approximately 2.1 mg cm−2. To determine the electrochemical performance of the samples, CR2032 coin-type half-cells were constructed in an argon-filled glove box using 1 M LiPF6 in ethylene carbonate/dimethyl carbonate (EC/DMC) (1![[thin space (1/6-em)]](https://www.rsc.org/images/entities/char_2009.gif) :
:![[thin space (1/6-em)]](https://www.rsc.org/images/entities/char_2009.gif) 1 vol%). Using a constant-current procedure at 25 °C, the LANHE CT2001A instrument was utilized for characterizing the as-assembled half-cells over potential ranges of 2.8–4.3 V and 2.8–4.5 V. On the PGSTAT302N Electrochemical System, electrochemical impedance spectroscopy (EIS) and cyclic voltammogram (CV) tests were performed. The CV tests were conducted in a voltage window of 2.5–4.5 V vs. Li+/Li at a scan rate of 0.1 mV s−1, while the EIS programs were completed in the frequency range of 10 mHz–100 kHz.
1 vol%). Using a constant-current procedure at 25 °C, the LANHE CT2001A instrument was utilized for characterizing the as-assembled half-cells over potential ranges of 2.8–4.3 V and 2.8–4.5 V. On the PGSTAT302N Electrochemical System, electrochemical impedance spectroscopy (EIS) and cyclic voltammogram (CV) tests were performed. The CV tests were conducted in a voltage window of 2.5–4.5 V vs. Li+/Li at a scan rate of 0.1 mV s−1, while the EIS programs were completed in the frequency range of 10 mHz–100 kHz.
3. Results and discussion
The XRD patterns of the LMR and MgHPO4 modified specimens are presented in Fig. 2 and Fig. S1 (ESI†). All of the patterns have a strong correlation to the conventional layered hexagonal α–NaFeO2 structure with the R![[3 with combining macron]](https://www.rsc.org/images/entities/char_0033_0304.gif) m space group (PDF# 85-1969). The creation of a well-ordered layer structure is suggested by the distinct splitting of the (108)/(110) and (006)/(102) peaks of all the samples. However, it should be noted that, for the LMR@MgHP-5 pattern, some mild diffraction peaks at roughly 2θ = 20–30° corresponding to the (110) and (101) planes in Li3PO4 (PDF# 25-1030) may be detected, which are generated during the calcination reaction between MgHPO4 and the surficial residual lithium. Meanwhile, no additional diffraction peaks can be observed for LMR@MgHP-1 and LMR@MgHP-2, which is likely due to the amount of Li3PO4 being too small to be detected.
m space group (PDF# 85-1969). The creation of a well-ordered layer structure is suggested by the distinct splitting of the (108)/(110) and (006)/(102) peaks of all the samples. However, it should be noted that, for the LMR@MgHP-5 pattern, some mild diffraction peaks at roughly 2θ = 20–30° corresponding to the (110) and (101) planes in Li3PO4 (PDF# 25-1030) may be detected, which are generated during the calcination reaction between MgHPO4 and the surficial residual lithium. Meanwhile, no additional diffraction peaks can be observed for LMR@MgHP-1 and LMR@MgHP-2, which is likely due to the amount of Li3PO4 being too small to be detected.
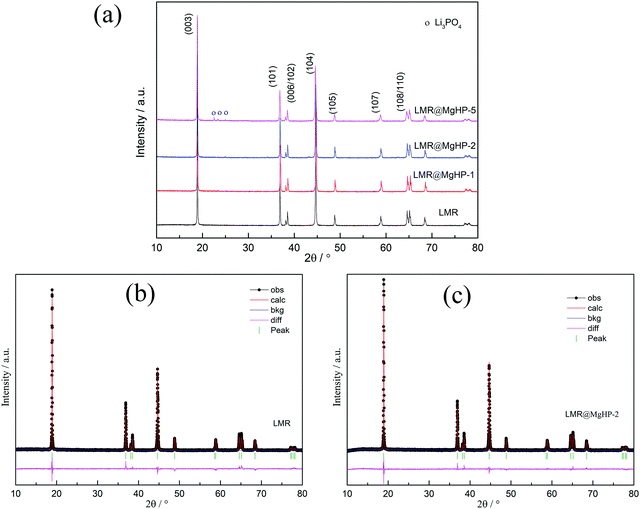 | ||
| Fig. 2 (a) XRD patterns of all the samples. Rietveld refinements of the XRD patterns of (b) LMR and (c) LMR@MgHP-2. | ||
The data were refined using the Rietveld method to further study the crystal structures of the samples. To identify the location of Mg ions in the lattice of the LMR@MgHP samples, four different possible structural models, i.e., without Mg occupation, Mg occupying at the Li site, Mg occupying at the TM site, and Mg simultaneously occupying at both Li and TM sites, were considered during the Rietveld refinements of the XRD patterns. The results are listed in Tables S1–S3 (ESI†). It is observed that the R-factors reach the lowest value only if the Mg cations occupy the octahedral sites of the Li layer, which indicates that the Li-site doping of Mg is the most reliable model to describe the structure. This result is in line with the results of first-principles calculations for Mg-doped Ni-rich cathode materials.27 The XRD refinement results based on the Li-site model are summarized in Table 1. The computed pattern primarily fell in the R![[3 with combining macron]](https://www.rsc.org/images/entities/char_0033_0304.gif) m structural type of α-NaFeO2, which has lithium on three ‘a’ sites, transition metal atoms on three ‘b’ sites, and oxygen on six ‘c’ sites. The weight profiled R factor, Rwp, the confidence factor, and the goodness of fit (GOF) are also summarized. It is worth noting that the reasonably small Rwp demonstrates the high accuracy of the proposed structural model. Furthermore, the calculated curves are a good fit for the experimental patterns, which shows that the refinement results are both reliable and acceptable. From the calculated results, it can be observed that the overall structure of the LMR material is influenced by the reaction with MgHPO4.
m structural type of α-NaFeO2, which has lithium on three ‘a’ sites, transition metal atoms on three ‘b’ sites, and oxygen on six ‘c’ sites. The weight profiled R factor, Rwp, the confidence factor, and the goodness of fit (GOF) are also summarized. It is worth noting that the reasonably small Rwp demonstrates the high accuracy of the proposed structural model. Furthermore, the calculated curves are a good fit for the experimental patterns, which shows that the refinement results are both reliable and acceptable. From the calculated results, it can be observed that the overall structure of the LMR material is influenced by the reaction with MgHPO4.
| Sample | Lattice parameters | I (003)/I(104) | Cation mixing (%) | χ 2 | GOF | R wp (%) | |
|---|---|---|---|---|---|---|---|
| a (Å) | c (Å) | ||||||
| LMR | 2.86184 | 14.19684 | 1.19 | 4.04 | 1.52 | 1.23 | 8.37 |
| LMR@MgHP-1 | 2.86785 | 14.21004 | 1.21 | 3.04 | 1.36 | 1.16 | 7.87 |
| LMR@MgHP-2 | 2.86842 | 14.21526 | 1.37 | 1.85 | 1.62 | 1.27 | 8.59 |
| LMR@MgHP-5 | 2.86888 | 14.21541 | 1.26 | 1.42 | 1.7 | 1.3 | 8.79 |
To examine the degree of cation mixing for the specimens, the integrated intensity ratio of I(003)/I(104) is regarded as a sensitive parameter that reveals the most significant changes of the degree of cation mixing.28 As the ionic radius of Ni2+ is similar to that of Li+, the degree of cation mixing can also be calculated based on the assumption that Ni2+ migrates to Li sites.29 From the results, we can conclude that LMR@MgHP-2 displays a superior and more stable structure than LMR. For example, the intensity value of I(003)/I(104) for the LMR@MgHP-2 sample is 1.37 which is higher than that for LMR (1.19), and the value of cation mixing for the LMR@MgHP-2 sample (1.85) is lower than that for LMR (4.04). Besides, the lattice parameter c is slightly increased, resulting in a greater c/a ratio. We have reason to think that Mg has a greater probability to dope into the bulk LiNi0.6Co0.2Mn0.2O2 material based on the alterations within the lattice constants before and after MgHPO4 modification.12 The enhanced lattice parameters and decreased degree of cation mixing are produced by substituting the Mg2+ cation in an attempt to stabilize the framework. Additionally, Liu investigated the effect of TiO2 coating and Ti doping on the structural characteristics of the material based on LiNi0.8Co0.2O2 and discovered that the coating alone was incapable of modifying the crystal characteristics.30
Fig. 3 illustrates the morphologies of the LMR and LMR@MgHP-2 samples. Both LMR and LMR@MgHP-2 exhibit spherical particles having a diameter of approximately 10 μm aggregated with densely packed primary particles having a diameter of around 500 nm, indicating that the modification procedure does not significantly alter the shape of the pristine material. In terms of the primary particles, the bare LMR exhibits a smooth and clear surface, while the LMR@MgHP-2 sample bears many spots and is slightly rough. As shown in Fig. 3c and f, the surface of the LMR particle does not have any additional layer and the lattice fringes with a crystal plane spacing of 0.246 nm are in accordance with the (101) plane of LiNi0.6Co0.2Mn0.2O2. In contrast, LMR@MgHP-2 exhibits a homogeneous surface coating layer with a thickness below 10 nm. Some ambiguous lattice fringes of 0.399 nm which are due to the (110) plane of Li3PO4 are detected in the coating layer. This indicates that the coating layer is partially crystallized Li3PO4, which is consistent with the XRD results. Furthermore, EDX elemental mapping of LMR@MgHP-2 (Fig. 3g) verifies that the Ni, Co, Mn, Mg, and P elements are homogeneously distributed on the cathode particle and the atomic contents of all the elements are close to the stoichiometric value (Table. S1, ESI†). Additionally, as shown in the linear FIB-SEM scanning result (Fig. S2, ESI†), the variations in the atomic concentration of the Mg element as a function of the depth indicate that some Mg element can still be detected at 0.8 μm depth. Thus, combined with the TEM result (Fig. 3f), this implies that the Mg element should be doped into the bulk material.
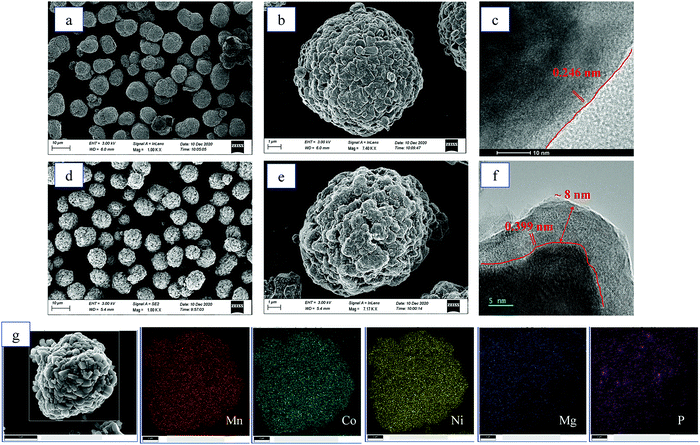 | ||
| Fig. 3 SEM images of (a and b) LMR and (d and e) LMR@MgHP-2. HRTEM images of (c) LMR and (f) LMR@MgHP-2. (g) EDX elemental mapping of LMR@MgHP-2. | ||
In an attempt to probe into the Mg and P distributions and the metal ion chemical valence state, X-ray photoelectron spectroscopy (XPS) was carried out, as depicted in Fig. 4 and Fig. S3 (ESI†). Fig. 4a displays the XPS depth profiles of Mg for the LMR@MgHP-2 sample. Accordingly, with the increased etching depth, the Mg 1s can still be measured even at 140 nm. The Mg concentration as a function of the etching depth based on Fig. 4a is shown in Fig. 4b. The relative content of Mg reduces steadily from the surface (33.7%) up to 150 nm depth (2.7%), thereby manifesting the distribution gradient of the Mg element. Combining the TEM results (Fig. 3f), the coating layer is only 8 nm, thus demonstrating that Mg2+ has been successfully doped into LMR. The XPS spectra at a binding energy of 132.97 eV in P 2p could be summarized as the characteristic of tetrahedral (PO4)-groups from the Li3PO4 coating layer (Fig. S3, ESI†). The Ni 2p peaks of LMR and LMR@MgHP-2 on the surface are compared in Fig. 4c. Ni 2p3/2 can be identified as a pair of peaks at binding energies of 854.1 eV and 855.4 eV, respectively known as Ni2+ and Ni3+. Accordingly, the LMR@MgHP-2 sample possesses slightly higher Ni3+/Ni2+ than LMR. A higher ratio of Ni3+/Ni2+ means less Ni2+ on the surface and consequently reduced Li/Ni cation mixing and decreased activation energy for Li+ extraction/insertion.31,32 In terms of the Co 2p3/2 and Mn 2p3/2 peaks, there is no apparent difference observed, illustrating that the chemical environments of Co3+ and Mn2+ in the structure have not changed. In addition, in the sample LMR@MgHP-2, the XPS peak intensity of metals is lower than that in LMR, which indirectly reflects the existence of a coating layer on the surface of the sample.
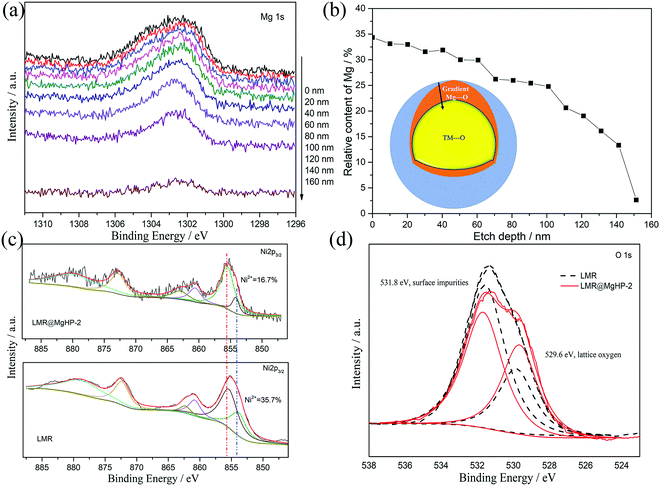 | ||
| Fig. 4 XPS depth profiles of Mg 1s for LMR@MgHP-2. (b) Relative content percentages of Mg at different etching levels based on (a). (c) Ni 2p and (d) O 1s spectra for the LMR and LMR@MgHP-2 samples. | ||
Fig. 4d compares the O 1s XPS of the LMR and LMR@MgHP-2 samples. Both samples are segregated into two peaks at bonding energies of 529.6 eV and 531.8 eV, respectively, corresponding to the lattice oxygen in the crystalline network and the surface oxygen-containing impurities (residual lithium compounds LiOH and Li2CO3).33,34 Notably, the intensity of the surface oxygen peak of LMR@MgHP-2 is smaller than that of LMR, demonstrating a lower concentration of residual lithium-based molecules on the surface of LMR@MgHP-2. This can be attributed to the consumption of residual lithium during the generation of the Li3PO4 coating. The metal–oxygen peak in the LMR@MgHP-2 specimen undergoes a slight increase in terms of its intensity in comparison with that of LMR, which can be explained by the introduction of Mg–O. Thus the XPS results indicate that during the reaction with MgHPO4 the surface residual lithium compounds could be consumed and converted to Li3PO4 as a coating layer and the element Mg could gradiently dope into the crystalline network.
The LMR and modified cathode samples were tested for their electrochemical performance between 2.8 and 4.3 V at 25 °C. The initial charge/discharge profiles of all the samples at 0.1C are shown in Fig. S4 (ESI†). The identical charge and discharge curves are displayed by all the cathodes and there is no additional plateau present in the modified specimens, thereby indicating the non-involvement of Mg in the electrode reaction. LMR, LMR@MgHP-1, LMR@MgHP-2, and LMR@MgHP-5 samples respectively manifest the initial discharge capacities of 176.9 mA h g−1, 179.3 mA h g−1, 188.5 mA h g−1, and 169.8 mA h g−1 at 0.1C, having initial coulombic efficiencies of 82.1%, 87.0%, 88.3%, and 88.8%. A slightly higher initial coulombic efficiency is observed for all the modified specimens in comparison with the pristine one. This phenomenon can be attributed to the presence of the gradient doped Mg2+ and lithium-ion conductive Li3PO4 coating layer which potentially aids in the lithium ion transport at the electrode/electrolyte interface, thereby stabilizing the bulk structure.
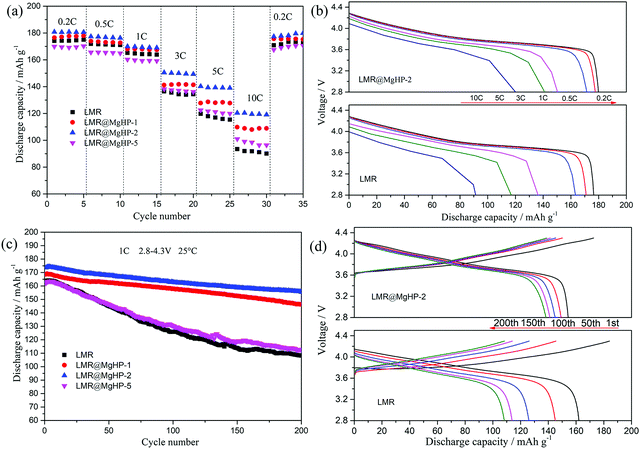
The rate performance of all the cathode specimens is depicted in Fig. 5a. As can be shown, as the current density increases from 0.2C to 10C, the discharge capacities of the modified samples LMR@MgHP-1 and LMR@MgHP-2 are larger than those of LMR. For example, the specific capacities for the LMR@MgHP-2 cathode are 140.3 mA h g−1 and 119.4 mA h g−1 at 5C and 10C, while those are 119.8 mA h g−1 and 92.5 mA h g−1 for LMR, respectively. Interestingly, the discharge capacity of LMR@MgHP-5 is lower than that of the pristine LMR at a low current rate, which could be ascribed to an excessive introduction of the inactive material MgHPO4 causing a reduction of the active material; however, with an increase in the current density, LMR@MgHP-5 displays a slightly higher capacity than LMR. This occurrence also shows that the twofold modification of MgHPO4 can help in improving the rate capability of cathode materials. The charge/discharge curves of LMR and LMR@MgHP-2 at various C-rates are shown in Fig. 5b. The working voltage deterioration and the capacity decay of LMR are much more severe than those of LMR@MgHP-2. These findings suggest that the dual alteration of electrodes with MgHPO4 could improve the structural stability and rate capability.
Dual modification of LMR by MgHPO4 could also significantly improve the cyclability of the cathode (Fig. 5c and d). After 200 cycles at 1C, the reversible capacity retention rates of LMR, LMR@MgHP-1, LMR@MgHP-2, and LMR@MgHP-5 are 66.3%, 86.77%, 89.57%, and 69.4%, respectively. The initial discharge capacity and the capacity retention of the LMR@MgHP-2 sample appear to be higher than those of the others, and far superior to any Mg-doped LiNi0.6Co0.2Mn0.2O2 cathode previously reported.12,15,23,24 The charge–discharge curves of different cycles for LMR and LMR@MgHP-2 are shown in Fig. 5d. As a result, the discharge capacity and the average voltage of the pure LMR rapidly decrease (Fig. S5, ESI†). The LMR@MgHP-2 sample, on the other hand, shows negligible alterations. These findings show that Mg2+ gradient doping and Li3PO4 coating generated by the MgHPO4 reaction can significantly increase the cycling performance and reduce voltage fading for the LMR electrode.
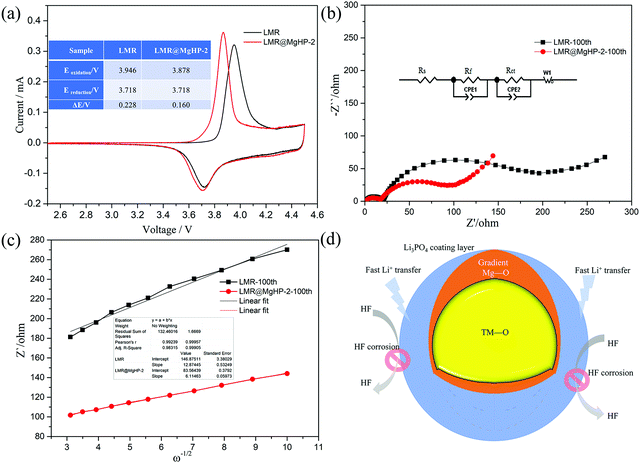
The cyclic voltammetry (CV) of LMR and LMR@MgHP-2 materials was carried out during the first cycle between 2.5 and 4.5 V using a scan rate of 0.1 mV s−1 to further study the effects of the MgHPO4 dual alteration on electrochemical irreversibility. The CV curves of the two samples had only a pair of prominent redox peaks, as shown in Fig. 6a, which correspond to the oxidation–reduction reaction of Ni2+/Ni4+. During the charging process, the oxidation of Ni2+ to Ni4+ is followed by the release of Li+, resulting in an oxidation peak at around 3.9 V. According to the process of conversion of Ni4+ to Ni2+ and Li+ insertion back into the layered material, the decreased peak comes at around 3.7 V. The electrochemical polarization and cycle reversibility of the electrode materials are generally attributed to the voltage interval between the oxidation and reduction peaks (ΔE).35 For the first cycle, ΔE of LMR@MgHP-2 is 0.160 V, which is slightly lower than that of LMR (0.228 V), showing that LMR@MgHP-2 has less electrochemical polarization, better reversibility, and hence greater electrochemical performance.
Electrochemical impedance spectra (EIS) experiments after 100 cycles at 1C with a charged state of 4.3 V were used to study the internal reaction kinetics of the electrode/electrolyte interface. The Nyquist plots in Fig. 6b reveal two semicircles at a high/medium frequency and an oblique line at a low frequency, corresponding to the impedance of a solid–electrolyte interphase film (Rsei), the charge-transfer resistance (Rct), and the Warburg diffusion impedance for lithium ions (Zw). Rs is related to the solution resistance. The example plots are fitted using the analogous circuit, and the fitted results are presented in Table 2. The Rsei value of LMR@MgHP-2 (18.04 Ω) is slightly lower than that of LMR (21.39 Ω), indicating that LMR@MgHP-2 has a relatively stable solid–electrolyte interphase film in the presence of the Li3PO4 coating layer. After 100 cycles, the Rct value for the LMR@MgHP-2 sample is 90.63 Ω. The Rct value for LMR, on the other hand, is 179.06 Ω, which is significantly greater than the value of the modified sample LMR@MgHP-2. In general, the decreased Rsei and Rct values for LMR@MgHP-2 indicate enhanced bulk and surface stability following MgHPO4 dual alteration (Fig. 6d). Furthermore, the diffusion coefficient of lithium ions (DLi+) is calculated according to the equations.36 As shown in Fig. 6c and Table 2, the LMR@MgHP-2 sample exhibits a lower DLi+ than LMR. Thus, according to the EIS tests, the LMR@MgHP-2 sample could lead to lower Rsei and Rct values, and a higher DLi+, which agrees quite well with the rate performance and CV analysis.
| Sample | R s/Ω | R sei/Ω | R ct/Ω | σ/Ω cm2 s0.5 | D Li+/cm2 s−1 |
|---|---|---|---|---|---|
| LMR | 2.15 | 21.39 | 179.06 | 12.87 | 8.36 × 10⁻¹¹ |
| LMR@MgHP-2 | 2.02 | 18.04 | 90.63 | 6.11 | 1.76 × 10⁻¹⁰ |
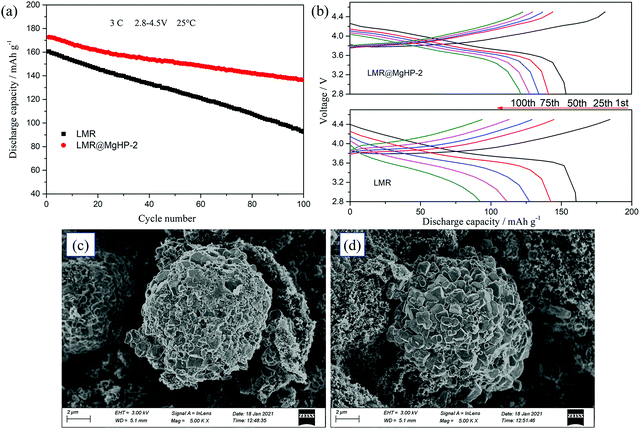
A comparison of the cycling performance of the LMR and LMR@MgHP-2 cathodes at 3C in a high cut-off voltage range of 2.8–4.5 V is further represented in Fig. 7a and b. As a result, as the number of cycles increases, the discharge capacity and initial discharge voltage of the LMR sample suddenly fall. After 100 cycles, the LMR sample delivers a sharp capacity change from 160.5 to 92.5 mA h g−1, with a capacity retention of 57.63%. While the LMR@MgHP-2 sample displays a slow decrease from 172.7 to 136.5 mA h g−1, with a capacity retention of 79.03%. Even though the cut-off voltage is high, it appears that the modified specimen has substantially better cycling performance in comparison to the pristine cathode. Under a high cut-off voltage, there is a high probability that electrolyte decomposition might take place, and the electrolyte is more likely to react with the delithiated metal ions, which is recorded as a side reaction between the electrode/electrolyte interface and is the main cause of the structural damage and capacity decay.37–39 According to the results, the cycling performance of the LMR@MgHP-2 sample is still excellent, demonstrating that the MgHPO4 alteration is beneficial in increasing electrochemical performance. These improvements can be attributed to the Mg atom gradient doping, which can reduce cation mixing and stabilize the host crystal structure, as well as the Li3PO4 coating layer, which can increase lithium-ion diffusion while also providing good corrosion protection on the cathode surface even at high cut-off voltage (as shown in Fig. 6d).40 Furthermore, after 100 cycles, the SEM pictures of the LMR and LMR@MgHP-2 cathodes (Fig. 7c and d) show that the primary particle interface of the LMR particle becomes fuzzy, indicating that the LMR particle suffers more damage and exhibits more deposition than LMR@MgHP-2. This finding further supports the idea that using MgHPO4 to modify the cathode material in two ways improves the structural stability and reduces side reactions with the electrolyte during cycling.
4. Conclusions
A simple direct reaction with MgHPO4 at 600 °C was used to accomplish a facile dual-modification strategy with surface Li3PO4 coating and bulk Mg2+ gradient doping. Reduced Li+/Ni2+ cation mixing, an overall stable structure, enhanced lithium-ion diffusion kinetics, lower electrochemical polarization, and thus improved electrochemical performance are all the features of the dual-modified LMR. The following two factors are primarily responsible for these improvements: on the one hand, Mg doping decreases cation mixing and increases the crystal structure stability; on the other hand, Li3PO4 is coated on the material surface as a rapid lithium-ion conductor, which promotes lithium-ion diffusion and safeguards the active cathode material from electrolyte corrosion. As a result, the developed LMR@MgHP-2 cathode has a higher discharge capacity of 119.4 mA h g−1, an optimized capacity retention of 89.57% after 200 cycles from 2.8 to 4.3 V at 1C, and a capacity retention of 79.03% after 100 cycles even in the 2.8–4.5 V voltage range at 3C, all of which are comparable to previous literature data. As a result, using MgHPO4 as a catalyst improves the electrochemical performance of the dual-modified LMR, making it a potential cathodic material for Li-ion batteries.Conflicts of interest
There are no conflicts to declare.Acknowledgements
This work was supported by the National Natural Science Foundation of China (grant No. 21805053 and No. 51963004), the Science and Technology Planning Project of Guizhou Province (No. [2019]1132), the High Level Scientific Research Funding Project of Guizhou Institute of Technology (XJGC20190901) and the Collaborative Innovation Project of Industrial Cluster of Chengdu, Sichuan (2017-XT00-00001-GX), Key Scientific Research Projects of Colleges and Universities of Henan Provincial Department of Education (No. 21A150018).References
- J. H. Kim, K. J. Park, S. J. Kim, C. S. Yoon and Y. K. Sun, J. Mater. Chem. A, 2019, 7, 2694–2701 RSC
.
- Z. Si, B. Shi, J. Huang, Y. Yu, Y. Han, J. Zhang and W. Li, J. Mater. Chem. A, 2021, 9, 9354–9363 RSC
.
- J. B. Goodenough and K. S. Park, J. Am. Chem. Soc., 2013, 135, 1167–1176 CrossRef CAS PubMed
.
- X. Jing, L. Feng, D. Marca and T. Wei, J. Mater. Chem. A, 2017, 5, 874–901 RSC
.
- Q. Wang, C. H. Shen, S. Y. Shen, Y. F. Xu, C. G. Shi, L. Huang, J. T. Li and S. G. Sun, ACS Appl. Mater. Interfaces, 2017, 9, 24731–24742 CrossRef CAS PubMed
.
- J. Li, X. Yang, X. Guan, R. Guo, Y. Che, J. Lan, L. Xing, M. Xu, W. Fan and W. Li, Electrochim. Acta, 2020, 354, 136722 CrossRef CAS
.
- S. E. Renfrew and B. D. McCloskey, J. Electrochem. Soc., 2019, 166, A2762 CrossRef CAS
.
- L. Feng, Y. Liu, L. Wu, W. Qin and Z. Yang, Powder Technol., 2021, 388, 166–175 CrossRef CAS
.
- L. Xue, Y. Li, B. Xu, Y. Chen, G. Cao, J. Li, S. Deng, Y. Chen and J. Chen, J. Alloys Compd., 2018, 748, 561–568 CrossRef CAS
.
- B. Chu, S. Liu, L. You, D. Liu, T. Huang, Y. Li and A. Yu, ACS Sustainable Chem. Eng., 2020, 8, 3082–3090 CrossRef CAS
.
- C. Zhang, S. Liu, J. Su, C. Chen, M. Liu, X. Chen, J. Wu, T. Huang and A. Yu, Nanoscale, 2018, 8820–8831 RSC
.
- L. Wang, J. Liang, X. Zhang, S. Li, T. Wang, F. Ma, J. Han, Y. Huang and Q. Li, Nanoscale, 2021, 13, 4670–4677 RSC
.
- J. Jyoti, B. P. Singh and S. K. Tripathi, J. Energy Storage, 2021, 43, 103112 CrossRef
.
- Z. Huang, Z. Wang, X. Zheng, H. Guo, X. Li, Q. Jing and Z. Yang, RSC Adv., 2015, 5, 887773–887779 Search PubMed
.
- N. Zhang, L. Ai, L. Mao, Y. Feng, Y. Xie, S. Wang, Y. Liang, X. Cui and S. Li, Electrochim. Acta, 2019, 319, 822–831 CrossRef CAS
.
- Y. Mo, L. Guo, H. Jin, B. Du, B. Cao, Y. Chen, D. Li and Y. Chen, J. Power Sources, 2020, 448, 227439 CrossRef CAS
.
- M. Jia, Z. Bi, C. Shi, N. Zhao and X. Guo, ACS Appl. Mater. Interfaces, 2020, 12, 46231–46238 CrossRef CAS PubMed
.
- H. Wang, Y. Chu, Q. Pan, G. Yang, A. Lai, Z. Liu, F. Zheng, S. Hu, Y. Huang and Q. Li, Electrochim. Acta, 2021, 366, 137476 CrossRef CAS
.
- W. Cho, S. M. Kim, J. H. Song, T. Yim, S. G. Woo, K. W. Lee, J. S. Kim and Y. J. Kim, J. Power Sources, 2015, 282, 45–50 CrossRef CAS
.
- Y. Kuai, F. Wang, J. Yang, Z. Xu, H. Li, X. Xu, Y. Nu and J. Wang, ACS Appl. Mater. Interfaces, 2021, 13, 26971–26980 CrossRef CAS PubMed
.
- Y. Chen, Y. Zhang, B. Chen, Z. Wang and C. Lu, J. Power Sources, 2014, 256, 20–27 CrossRef CAS
.
- X. Li, W. Peng, R. Tian, D. Song, Z. Wang, H. Zhang, L. Zhu and L. Zhang, Electrochim. Acta, 2020, 363, 137185 CrossRef CAS
.
- C. H. Jo, D. H. Cho, H. J. Noh, H. Yashiro, Y. K. Sun and S. T. Myung, Nano Res., 2015, 8, 1464–1479 CrossRef CAS
.
- S. W. Lee, M. S. Kim, J. H. Jeong, D. H. Kim, K. Y. Chung, K. C. Roh and K. B. Kim, J. Power Sources, 2017, 360, 206–214 CrossRef CAS
.
- S. Yang, Q. Fan, Z. Shi, L. Liu, J. Liu, X. Ke, J. Liu, C. Hong, Y. Yang and Z. Guo, ACS Appl. Mater. Interfaces, 2019, 11, 36742–36750 CrossRef CAS PubMed
.
- H. G. Song, J. Y. Kim, K. T. Kim and Y. J. Park, J. Power Sources, 2011, 196, 6847–6855 CrossRef CAS
.
- K. Min, S.-W. Seo, Y. Y. Song, H. S. Lee and E. Cho, Phys. Chem. Chem. Phys., 2017, 19, 1762 RSC
.
- K. W. Nam, S. M. Bak, E. Hu, X. Yu, Y. Zhou, X. Wang, L. Wu, Y. Zhu, K. Y. Chung and X. Q. Yang, Adv. Funct. Mater., 2013, 23, 1047–1063 CrossRef CAS
.
- M. Chen, E. Zhao, D. Chen, M. Wu, S. Han, Q. Huang, L. Yang, X. Xiao and Z. Hu, Inorg. Chem., 2017, 56, 8355–8362 CrossRef CAS PubMed
.
- H. S. Liu, Z. R. Zhang, Z. L. Gong and Y. Yang, Solid State Ionics, 2004, 166, 317–325 CrossRef CAS
.
- Z. Guo, Z. Jian, S. Zhang, Y. Feng, W. Kou, H. Ji and G. Yang, J. Alloys Compd., 2021, 882, 160642 CrossRef CAS
.
- Q. Li, R. Dang, M. Chen, Y. Lee, Z. Hu and X. Xiao, ACS Appl. Mater. Interfaces, 2018, 10, 17850–17860 CrossRef CAS PubMed
.
- W. J. Ge, X. Li, H. Wang, W. Li, A. J. Wei, G. C. Peng and M. Z. Qu, J. Alloys Compd., 2016, 684, 594–603 CrossRef CAS
.
- Q. Fu, F. Du, X. Biah, Y. Wang, X. Yan, Y. Zhang, K. Zhu, G. Chen, C. Wang and Y. Wei, J. Mater. Chem. A, 2014, 2, 7555–7562 RSC
.
- G. Yang, K. Pan, F. Lai, Z. Wang, Y. Chu, S. Yang, J. Han, H. Wang, X. Zhang and Q. Li, Chem. Eng. J., 2021, 421, 129964 CrossRef CAS
.
- L. Li, Z. Chen, L. Song, M. Xu, H. Zhu, L. Gong and K. Zhang, J. Alloys Compd., 2015, 638, 77–82 CrossRef CAS
.
- C. Liang, R. C. Longo, F. Kong, C. Zhang, Y. Nie, Y. Zheng, J. S. Kim, S. Jeon, S. Choi and K. Cho, J. Power Sources, 2017, 340, 217–228 CrossRef CAS
.
- W. Liu, P. Oh, X. Liu, M. J. Lee, W. Cho, S. Chae, Y. Kim and J. Cho, Angew. Chem., Int. Ed., 2015, 51, 4440–4457 CrossRef PubMed
.
- D. H. Seo, J. Lee, A. Urban, R. Malik, S. Kang and G. Ceder, Nat. Chem., 2016, 8, 692–697 CrossRef CAS PubMed
.
- W. Xiao, Y. Nie, C. Miao, J. Wang, Y. Tan and M. Wen, J. Colloid Interface Sci., 2022, 607, 1071–1082 CrossRef CAS PubMed
.
Footnote |
| † Electronic supplementary information (ESI) available. See DOI: 10.1039/d1ya00031d |
| This journal is © The Royal Society of Chemistry 2022 |

