
Microfluidic nanobubbles: observations of a sudden contraction of microbubbles into nanobubbles†
Ali A.
Paknahad
abc,
Intesar O.
Zalloum
bce,
Raffi
Karshafian
bce,
Michael C.
Kolios
 *bce and
Scott S. H.
Tsai
*abcd
*bce and
Scott S. H.
Tsai
*abcd
aDepartment of Mechanical and Industrial Engineering, Toronto Metropolitan University, Toronto, Ontario M5B 2K3, Canada
bInstitute for Biomedical Engineering, Science and Technology (iBEST), A Partnership Between Toronto Metropolitan University and St. Michael's Hospital, Toronto, Ontario M5B 1T8, Canada
cKeenan Research Centre for Biomedical Science, Unity Health Toronto, Toronto, Ontario M5B 1W8, Canada
dGraduate Program in Biomedical Engineering, Toronto Metropolitan University, Toronto M5B 2K3, Canada. E-mail: scott.tsai@torontomu.ca
eDepartment of Physics, Toronto Metropolitan University, Toronto, Ontario M5B 2K3, Canada. E-mail: mkolios@torontomu.ca
First published on 26th June 2023
Abstract
Microfluidic devices are often utilized to generate uniform-size microbubbles. In most microfluidic bubble generation experiments, once the bubbles are formed the gas inside the bubbles begin to dissolve into the surrounding aqueous environment. The bubbles shrink until they attain an equilibrium size dictated by the concentration and type of amphiphilic molecules stabilizing the gas–liquid interface. Here, we exploit this shrinkage mechanism, and control the solution lipid concentration and microfluidic geometry, to make monodisperse bulk nanobubbles. Interestingly, we make the surprising observation of a critical microbubble diameter above and below which the scale of bubble shrinkage dramatically changes. Namely, microbubbles generated with an initial diameter larger than the critical diameter shrinks to a stable diameter that is consistent with previous literature. However, microbubbles that are initially smaller than the critical diameter experience a sudden contraction into nanobubbles whose size is at least an order-of-magnitude below expectations. We apply electron microscopy and resonance mass measurement methods to quantify the size and uniformity of the nanobubbles, and probe the dependence of the critical bubble diameter on the lipid concentration. We anticipate that further analysis of this unexpected microbubble sudden contraction regime can lead to more robust technologies for making monodisperse nanobubbles.
1. Introduction
Nanobubbles (NBs) are nanometer-size bubbles characterized into two categories: bulk and surface NBs.1 Bulk nanobubbles (BNBs) are gaseous domains surrounded by liquid with a diameter smaller than 1000 nm. Surface NBs are gaseous domains in the shape of a hemispherical cap that originate on solid surfaces. The height of the cap is typically 10–100 nm, and the radius is 50–500 nm.1,2 The focus of this paper is on the microfluidic generation of BNBs.There are emerging applications of BNBs in various fields, including wastewater treatment, aquaculture, medicine, surface cleaning, flotation, and other areas.1–6 Different mechanical and chemical production methods have been used to produce BNBs. In a recent review paper, we discussed each of the existing fabrication methods for making BNBs, their strengths and weaknesses, and how microfluidics may help to address the current challenges in making BNBs.1
Although many papers report the observation of long-lived BNBs, there are still many debates about the existence and long-term stability of BNBs. The pressure difference between the inside and outside of a bubble is typically dependent on the gas–liquid surface tension and the bubble's radius, as described by the Young–Laplace equation, ΔPLaplace = Pinside − Poutside = 2γ/r, where Pinside and Poutside are the pressures inside and outside of the bubble, respectively.7 Here, γ is the gas–liquid surface tension, and r is the bubble radius.7 Therefore, a bubble that has a radius in the nanometer range should have a large internal pressure. According to Henry's law, the excessive pressure difference between the inside and outside of the bubble should lead to a change in the capacity of the liquid surrounding the bubble to absorb the gas.8 This should result in one of two destabilizing scenarios: (1) the bubble size increases as additional gas molecules diffuse into the bubble if the liquid is already saturated with the gas, or (2) the bubble shrinks, if the surrounding liquid is not at saturation, until the bubbles completely dissolve from the solution, in a vicious shrinkage cycle.8
Why and how stable BNBs are observed experimentally is still being debated. However, one hypothesis for the apparent stability of surfactant stabilized BNBs is the following. After a microbubble (MB) forms, the gas inside the bubble diffuses into the surrounding liquid due to the outward driving force caused by Laplace pressure. As a result, the MB's diameter decreases, and if the level of shrinkage is sufficiently high, the MBs shrink to BNBs.9,10 Some papers report that during the shrinkage process the surfactants remain on the surface of the bubbles, owing to a combination of van der Waals and hydrophobic interactions between the surfactants that maintains the cohesiveness of the surfactant layer.11,12 The presence of the surfactant layer, or shell, lessens the gas–liquid surface tension, thereby reducing the Laplace pressure, and resulting in stable BNBs.13 Some papers speculate that the surfactants forming the BNB shell create an electrostatic pressure that balances the Laplace pressure, and prevents the bubble from perishing.13,14
Over the past decade, microfluidics has emerged as a viable tool to produce BNBs. Peyman et al. utilized a technique called microfluidic atomization to create BNBs.15 In the atomization technique, the combination of shear stress and pressure at the microfluidic orifice create an atomization-like phenomenon, forming a mixed population of MBs and BNBs.15 In another study, Abou-Saleh et al. optimized the atomization method,15,16 demonstrating a new micro-spray regime by increasing the height of the microchannel downstream of the orifice. In this regime, the sudden pressure drop downstream of the orifice leads to conditions that enable BNB generation.16 However, a main drawback of the atomization method is that the resulting bubble population includes both MBs and BNBs, making the technique challenging for applications that exclusively require BNBs.1,15,16
In this paper, we utilize a microfluidic MB shrinkage method our group recently developed,17 and extend the scope of the technology to produce BNBs. We previously showed that the degree of MB shrinkage in a microfluidic setting can be controlled by the solution's lipid concentration, and the MBs can shrink in diameter by as much as tenfold. With this knowledge, here we develop a new microfluidic geometry with a smaller flow-focusing orifice so that we can generate sub-20 μm diameter MBs that may shrink to become BNBs. Surprisingly, we discover that even MBs of larger sizes can suddenly reduce to become stable BNBs. We find that when the initial diameter of MBs is less than a critical threshold, the MBs unexpectedly shrink to approximately the same nanoscale final diameter, regardless of their initial diameter. In contrast, when the MB initial diameter is greater than the critical threshold, the MBs shrink by a factor of ten and do not transform into BNBs. To the best of our knowledge, this is the first experimental report of a critical MB diameter that delineates between MBs shrinking by the expected amount, and MBs shrinking dramatically to become stable and relatively monodisperse BNBs.
2. Materials and methods
2.1 Microfluidic device fabrication
We fabricate our microfluidic chip using the standard photolithography processes. We utilize a MicroWriter ML3 Pro (Durham Magneto Optics Ltd, England) as the photolithography machine. We design our microfluidic design with AutoCAD (AutoCAD 2018, Autodesk, Inc., Dan Rafael, CA) software, and convert the output file using CleWin software to a format readable by the MicroWriter ML3 Pro machine. We first spin coat 20 μm of SU-8 2010 photoresist onto the surface of a silicon wafer. Then, to prebake the photoresist, we put the silicon wafer on a hot plate for 3 min at 65 °C, and then for 5 min at 95 °C. We impose our microfluidic design into the prebaked silicon wafer using MicroWriter ML3 Pro. This machine uses a 385 nm semiconductor light source. After this step, we post bake the wafer at 65 °C for 3 minutes and at 95 °C for 5 minutes to stabilize the microfluidic device structure on the silicon wafer. Finally, we remove the uncured SU-8 using a photoresist developer solution. We pour and stir a mixture of polydimethylsiloxane resin (PDMS, Sylgard 184, Dow Corning, USA) and curing agent with a ratio of 10![[thin space (1/6-em)]](https://www.rsc.org/images/entities/char_2009.gif) :1 into a disposable plastic bowl.
:1 into a disposable plastic bowl.
Before pouring the polymer solution onto the structured silicon wafer, we degas the polymer mixture employing a desiccator to remove air bubbles. Next, we bake the mixture in an oven at 70 °C for 1 h. For each experiment, we cut and peel off a device from the PDMS slab. We use a 1 mm diameter biopsy punch (Integra Miltex, Inc., Rietheim-Weilheim, Germany) to create inlets and outlets. Finally, we utilize oxygen plasma bonding (Harrick Plasma, Ithaca, NY) to bond the PDMS device to a glass microscope slide (Corning microscope slides, 75 mm × 25 mm, Sigma-Aldrich, St. Louis, MI). We connect Teflon tubing (PEEK, Upchurch) to the inlets to supply gas and liquid, and to the channel outlet to collect the bubbles.
2.2 Lipid formulation
We synthesize a total of 100 mg of lipid solution comprising 6:1:2:1 mass ratio of 1,2-dibehenoyl-sn-glycero-3-phosphocholine (DBPC), 1,2-dipalmitoyl-sn-glycero-3-phosphate (DPPA), 1,2-dipalmitoyl-sn-glycero-3-phosphoethanolamine (DPPE), and 1,2-distearoyl-sn-glycero-3-phosphoethanolamine-N-[carboxy(polyethylene glycol)-2000] (DSPE-mPEG-2000) (Avanti Polar Lipids, Alabaster, AL).17,18 To make a lipid solution with the concentration of 0.50 mg mL−1, we heat 200 mL of phosphate-buffered saline (PBS; Thermo Fisher Scientific, Inc., Ontario, Canada) and 2 mL of glycerol (MilliporeSigma Canada Co., Ontario, Canada). Then, we mix the solution and add the solution to the lipids.
To ensure all lipids are entirely dissolved, we heat the lipid solution for 2 h at 80 °C, and sonicate for 20 min. Before each experiment, we add 200 μL of Pluronic F-68 (Thermo Fisher Scientific, Inc., Ontario, Canada) to every 4 mL of lipid solution. Then, we filter the lipid solution through a 2 μm filtration membrane (Acrodisc Syringe Filters, VWR, Ontario, Canada) to remove any unwanted particles.
2.3 Blended gas
In all experiments, we use a mixed gas composing 0.17 wt% octafluoropropane (C3F8) in nitrogen (N2) (Messer Canada, Inc., Mississauga, Canada). We use a microfluidic pressure pump (FLOW EZ, Fluigent, Paris, France) to accurately deliver the gas into the microfluidic device.2.4 BNB generation
We generate BNBs in a flow-focusing chip with an orifice width of 4 μm connected to an outlet microchannel with a width of 502 μm. The width of the dispersed and continuous phase channels is 90 μm, and we keep the microchannel height at 20 μm everywhere in the device. As shown in Fig. 1A, we utilize a microfluidic pressure-controlled pump to have real-time control of the pressure of the gas entering the microfluidic chip. We deliver the aqueous lipid solution through the liquid inlet of the microfluidic chip employing a constant flow rate syringe pump (Harvard Apparatus, PHD 2000, Holliston, MA). The lipid and blended gas phases are pushed toward the flow-focusing orifice. The lipid solution enters the orifice from lateral microchannels and squeezes the gas at the orifice (Fig. 1B). Consequently, MBs are created at the orifice and travel downstream into the outlet microchannel. The outlet microchannel is connected, through a Teflon tubing, to a plastic vial that is open to the atmosphere. | ||
| Fig. 1 (A) Schematic of the flow-focusing microfluidic design to generate BNBs. The width of the orifice is 4 μm, and the height of the microchannels is 20 μm. (B) Formation of monodisperse MBs at the orifice. (C) TEM image of a BNB after shrinkage with a diameter of 180 nm. The BNB's initial diameter before shrinkage was 10.0 μm. We use a 0.17 wt% C3F8 gas and a lipid solution with the concentration of 0.50 mg mL−1. | ||
2.5 MB and BNB analysis
We capture images of MBs at the microfluidic orifice using an inverted microscope (AX10, Carl Zeiss AG, Oberkochen, Germany) equipped with a high-speed camera (Phantom M110, Vision Research, Wayne, NJ). We use ImageJ (National Institutes of Health, Bethesda, MD) software calibrated using 5.9 μm diameter standard polystyrene particles (Thermo Fisher Scientific, Inc., Ontario, Canada) to measure the diameter of MBs.We utilize several characterization methods to analyze the BNBs. First, we experiment with the Tyndall effect to confirm the existence of BNBs in the collected sample.3,19,20 To conduct this test, we first generate bubbles, and collect the bubbles in a plastic vial open to the atmosphere. We keep the bubbles in the vial for 1 day to allow gas exchange between the bubbles and the liquid environment. In the test, we illuminate the solution containing BNBs with a red laser beam. BNBs in the sample scatter the light and brighten the solution inside the vial, confirming BNBs in the solution.
As Fig. 1C shows, we secondly utilize transmission electron microscopy (TEM, Hitachi HT7800, Japan) to capture images of the BNBs after shrinkage.21 The bubbles are kept inside a plastic vial for 1 hour before TEM imaging. To start the TEM imaging, first we plasma clean the TEM grid before each imaging session. We pipet 25 μL of BNB solution and three droplets of DI water, as a dilution reservoir, onto a parafilm sheet. We put the TEM grid on the BNBs droplets and leave it for 3 minutes. Then, we dilute the BNBs into the grid by placing the grid on DI water droplets and leaving it there for 1 minute. After dilution, we apply 20 μL of 2% uranyl acetate on the grid as a stain. We remove the excess stain and air-dry the grid before imaging.
Finally, to measure the diameter of BNBs, we use the Resonant Mass Measurement (RMM) technique (Archimedes, Malvern Instruments). An accurate BNB characterization method is essential to ensure the particles under investigation are indeed NBs, not solid nanoparticles. Among the most common characterization techniques, RMM is the only method which can differentiate bubbles from non-gaseous particles, such as contaminants and surfactants.6,22–24
We use 1 mL of BNBs solution to quantitatively characterize BNBs with RMM. We utilize a 10 nm resolution RMM nanosensor in all experiments with a measurement limitation of 100 nm to 2.0 μm. Before obtaining the data, we calibrate the sensor employing NIST traceable 500 nm polystyrene beads (MilliporeSigma Canada Ltd 2149, Oakville ON, Canada) dispersed in water solution. Before and after each experiment, we run three cycles of nanosensor cleaning through filtered Milli-Q water to ensure the microchannels inside the sensor are not blocked and are free of any unwanted particles. We dilute each sample filtered PBS with a factor of 10 to keep the coincidence percentage less than 5% and decrease the number of “coincidence bumps” in the obtained result. We let the instrument automatically adjust the detection limit in each experiment. We use the density of 0.008 mg cc−1 for positively buoyant particles. We calculate this number through the particle density measurement guideline recommended by Archimedes user manual.
3. Results and discussion
In a recently published paper, we found a linear relationship between the initial diameter, Di, of bubbles and their post-shrinkage final diameter, Df.17 We also found that when the continuous lipid phase concentration is decreased, bubbles experience increased levels of shrinkage.17 We suggest that this happens because when bubbles form in a solution of higher lipid concentration, more lipid molecules are initially adsorbed onto the gas–liquid interface in comparison with bubbles produced using a lower lipid concentration solution. Consequently, in solutions with higher lipid concentration, lipids at bubble interfaces jam earlier, and result in lower levels of shrinkage.17 For example, when we utilize a lipid concentration of 1.10 mg mL−1, and make MBs with Di ≈ 25.0 μm, the post-shrinkage final mean diameter Df ≈ 3.7 μm. This means Df is approximately 6.7 times smaller than Di. Therefore, in this paper, we expand the previous research17 by hypothesizing that decreasing the initial diameter Di of MBs and the concentration of the lipid solution would further increase the degree of shrinkage and lead to the formation of BNBs. We also hypothesize that the size of the resulting BNBs can be tuned by adjusting the initial diameter Di of MBs, and the lipid solution concentration.3.1 Unexpected MBs shrinkage to BNBs
In a set of representative experiments, we generate MBs with a mean initial diameter Di < 20.0 μm in a solution with a lipid concentration of 0.50 mg mL−1. Fig. 2a–d show bright-field images of MBs at the orifice with Di = 7.0, 12.0, 15.0, and 20.0 μm, respectively. Fig. 2e–h show corresponding TEM images of the resulting bubbles after they have been collected in a plastic vial. We observe that bubbles with Di = 15.0 and 20.0 μm have final diameters, Df ≈ 1.4 and 2.0 μm, respectively, confirming that the degree of shrinkage, Di/Df ≈ 10.0. This observation is consistent with the results published in our recent paper, where there is a linear relationship between MB Di and Df.17 | ||
| Fig. 2 (a–d) Bright field, and (e–h) TEM images of the bubbles before and after shrinkage, respectively. The lipid concentration in all of these experiments is 0.5 mg mL−1, and the gas is composed of 0.17 wt% C3F8 in pure N2. In (a–d) the MB initial diameter Di = 7.0, 12.0, 15.0 and 20.0 μm, respectively. (e–h) The corresponding final mean diameters Df = 189 nm, 195 nm, 1.4 μm, and 2.0 μm, measured using TEM. When we reduce Di from 20.0 to 7.0 μm, the final bubble diameter Df goes from 2 μm to 189 nm. There appears to be a threshold Di = 13.0–14.0 μm, that separates bubbles that shrink to MBs and those that shrink to BNBs. Bright field and TEM images are taken 1 hour after bubbles are generated. We vary the gas phase pressure from 14.0 to 18.3 psi and keep the aqueous flow rate fixed at 45 μL min−1. The width of the orifice in (a–d) are 4, 7, 10, and 10 μm. | ||
Surprisingly, TEM images from MBs with Di = 7.0 and 12.0 μm show that the final bubble diameter Df ≈ 189 and 195 nm, respectively, with Di/Df ≫ 10.0. This finding means that 7.0 and 12.0 μm diameter MBs deviate from the linear trend between bubble Di and Df that is found for MBs that have just slightly larger Di. Another unexpected finding is that both Di = 7.0 and 12.0 μm bubbles shrink to approximately the same diameter BNBs.
3.2 Confirmation of BNBs using the Tyndall effect
We utilize the Tyndall effect to confirm the presence of BNBs in samples we collect from our microfluidic experiments. Namely, we make MBs with an initial mean diameter Di = 7.0 μm, a lipid solution concentration of 0.50 mg mL−1, and a blended gas of 0.17 wt% C3F8 in N2. After 1 day, we investigate the presence of BNBs in the collected sample by running the Tyndall test. For this test, we irradiate a laser beam, from right to left, towards three vials (see Fig. 3). We observe that the control vial of filtered deionized (DI) water does not scatter the laser light (Fig. 3a). However, the vial containing BNBs scatters the laser light (Fig. 3b). We hypothesize that the observed Tyndall phenomenon is due to the presence of BNBs suspended in the solution that scatter the laser beam. | ||
| Fig. 3 Tyndall effect test. This image is taken 1 day after making BNBs. We shoot a red laser beam from the right side of the image to the left. (a) The vial containing DI water does not scatter the light as there are no particles inside the sample. (b) The sample containing the BNB solution scatters the laser light due to the presence of BNBs suspended in the vial. (c) This image shows a BNB sample after freezing for 24 h and thawing. The degree of scattered light in the thawed BNB solution is considerably reduced compared to the BNB vial without freezing–thawing. This is likely due to the rupture of BNBs during the freezing–thawing process.14 Both BNB suspensions in (b) and (c) are made by first generating MBs with Di = 7.0 μm, with 0.17 wt% C3F8 gas, and a lipid solution concentration of 0.50 mg mL−1. | ||
It is also important to confirm that the nanoparticles in the solution are actual gas-filled BNBs. To do this, we utilize the technique suggested by Alheshibri and Craig on distinguishing gas-filled BNBs from solid nanoparticles.25 In this method, we keep a vial of BNBs in a freezer at the temperature of −20 °C for 24 h. After 24 h, we leave the vial at room temperature to let the liquid inside the vial thaw. As Nirmalkar et al. have shown, most BNBs burst as a result of freezing and thawing; however, contaminants and surfactants remain.14 After thawing the vial, we repeat the Tyndall test. As Fig. 3c shows, the laser beam passes through the vial, suggesting that the BNBs have also burst in the sample. In the next step, we utilize the RMM characterization method to further analyze the BNBs.
3.3 MB critical initial diameter that enables shrinkage to BNBs
We further investigate the unexpected phenomenon of the sudden and dramatic shrinkage of MBs to BNBs that we observe in some experiments. Here, we generate MBs with different initial diameters Di. These experiments aim to see how the final diameter Df changes with different values of initial diameters Di. We also attempt to understand whether there is a relationship between Di and Df when bubbles are generated below the threshold diameter. Moreover, we investigate the effect of altering the lipid solution on the observed phenomenon.To better examine the behaviour of bubbles when shrinking, we make MBs with a mean initial diameter Di ≈ 4.0–24.0 μm, varying the lipid concentration from 0.30–0.75 mg mL−1. We use RMM to measure the resulting bubbles when the final diameter Df < 1.0 μm. When Df > 1.0 μm, bubble diameter is measured via brightfield microscopy. We also define a critical initial diameter, Di,c, that is the average of the two closest values of Di, where the larger value of Di results in the expected amount of shrinkage and the smaller value of Di results in the unexpected, drastic shrinking of BNBs.
Fig. 4 shows the relationship between the initial mean diameter Di of the MBs and their final mean diameter Df after shrinkage. We use a mixed gas composed of 0.17 wt% C3F8 and pure N2 in all experiments. We observe that Df ∝ Di at larger values of Di, as expected, in all experiments.17 However, at lower values of Di, all bubbles converge to a final diameter Df ≈ 150–250 nm, with a critical initial diameter Di,c that appears to depend on the solution lipid concentration. We define the “critical region” as the region in the plot that delineates between the two regimes.
 | ||
| Fig. 4 Plot of the post-shrinkage final mean diameter Dfversus the initial mean diameter Di of the MBs. Different colours represent data associated with different lipid concentrations, as shown in the legend. We use three lipid concentrations in our experiments: 0.30 mg mL−1 (blue squares), 0.50 mg mL−1 (red squares), and 0.75 mg mL−1 (black squares). We use a mixed gas of 0.17 wt% C3F8 and pure N2 in all experiments. When the Di > Di,c, the final diameter, Df ∝ Di, and the shrinkage degree Di/Df ≈ 10.6, 10.0, and 9.4, when the lipid concentration is 0.30 mg mL−1, 0.50 mg mL−1, and 0.75 mg mL−1, respectively. However, when Di < Di,c, the final and initial diameters, Df and Di, become non-monotonically related. In this regime, the final diameter Df = 150–250 nm for all BNBs, regardless of their initial diameter Di. The inset shows the critical initial diameter Di,cversus the solution lipid concentration. As we increase the lipid concentration from 0.30 to 0.75 mg mL−1, Di,c declines from approximately 15.0 to 12.0 μm. | ||
In Fig. 4, black, red, and blue symbols represent data points from experiments with lipid concentrations of 0.75, 0.50, and 0.30 mg mL−1, respectively. We observe the same trend in the data from all three lipid concentrations. However, as the inset shows, we also see a shift in the Di,c with lipid concentration. Namely, Di,c declines from approximately 15.0 to 12.0 μm when lipid concentration is increased from 0.30 to 0.75 mg mL−1.
We suppose the reason that a higher lipid concentration results in a lower Di,c is due to a phenomenon called “lipid jamming”.17,26–28 Here, as bubbles form at the orifice, lipid molecules adsorb on the gas–liquid interface via self-assembly. As gas inside the MBs dissolve into the surrounding aqueous phase, the MBs shrink. The shrinkage process stops when the lipid molecules on the gas–liquid interface mechanically compress together, forming a packed interface with a surface tension that approaches zero.17,29 MBs that are generated in a high lipid concentration solution begin with a higher density of lipid molecules absorbed onto the gas–liquid interface. Consequently, the interfacial lipids jam earlier, arresting MB shrinkage, and reducing the degree of bubble shrinkage.17
In our experiments with lipid concentration between 0.30 and 0.75 mg mL−1, bubbles that are formed with Di > Di,c have a shrinkage degree Di/Df ≈ 10.0. This is consistent with findings in our recent paper, in which we showed the impact of lipid concentration on MB shrinkage.17 We found that the shrinkage degree Di/Df ≈ 2.0–6.7 when the lipid concentration is from 10.0 to 1.1 mg mL−1.17
Table 1 shows the final diameter Df of bubbles generated with lipid concentrations of 0.30, 0.50, and 0.75 mg mL−1, when Di < Di,c. Notably, in this regime we do not observe any correlation between Di and Df. Moreover, it appears that the final diameter is consistently Df = 150–250 nm.
| Lipid concentration (mg mL−1) | Initial diameter, Di (μm) | Final diameter, Df (nm) |
|---|---|---|
| 0.30 | 14.5 ± 0.3 | 189 ± 30 |
| 0.30 | 12.0 ± 0.2 | 210 ± 31 |
| 0.30 | 9.0 ± 0.4 | 185 ± 33 |
| 0.30 | 6.0 ± 0.5 | 179 ± 25 |
| 0.50 | 13.0 ± 0.5 | 215 ± 21 |
| 0.50 | 12.0 ± 0.6 | 195 ± 24 |
| 0.50 | 10.0 ± 0.4 | 181 ± 28 |
| 0.50 | 7.0 ± 0.5 | 189 ± 29 |
| 0.75 | 11.6 ± 0.6 | 195 ± 30 |
| 0.75 | 11.0 ± 0.4 | 200 ± 32 |
| 0.75 | 7.5 ± 0.6 | 215 ± 30 |
Fig. 5a–d show distribution plots of the final diameter Df of BNBs, obtained using RMM. The BNBs are produced using a lipid concentration of 0.50 mg mL−1 and 0.17 wt% C3F8 blended gas. Here, the BNBs in a–d have initial diameters Di = 7.0, 10.0, 12.0, and 13.0 μm. Fig. 5e shows a TEM image of BNBs, with the red arrows showing BNBs with Df ≈ 180 nm. Df = 150–250 nm for all BNBs observed, and there is good agreement between RMM and TEM imaging results. We also monitor the stability of BNBs with Df ≈ 189 nm, starting at 1 hour post-generation for a period of 48 hours. Over this time, the average diameter of BNBs increases from 189 ± 18 nm to 220 ± 14 nm.
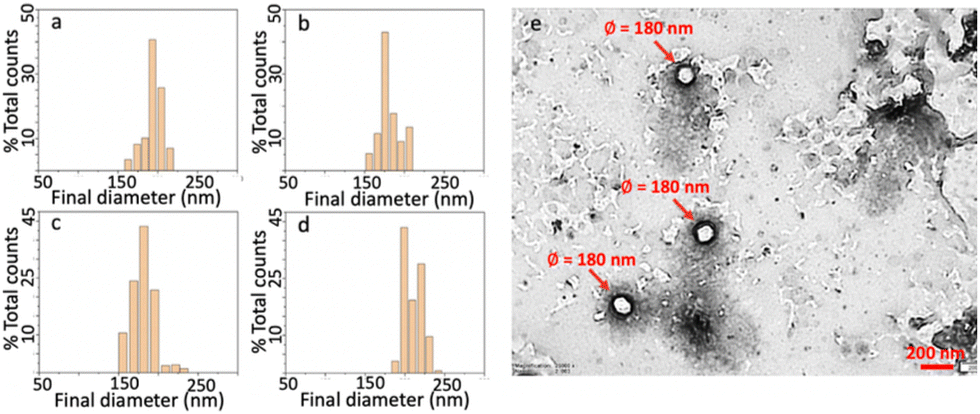 | ||
| Fig. 5 RMM and TEM characterization of BNBs. (a–d) Representative RMM measurements of NB diameter generated with 0.5 mg mL−1 lipid concentration and 0.17 wt% C3F8 gas. The initial diameter Di of bubbles in (a–d) are 7.0, 10.0, 12.0, and 13.0 μm, respectively. The results show that the all BNBs in our experiments have Df = 150–250 nm. (e) TEM image of NBs. Red arrows show NBs with Df ≈ 180 nm. | ||
We compare the shrinkage process between two single bubbles, both made with a lipid concentration of 0.50 mg mL−1. We generate the two MBs with initial diameters Di = 12.0 and 15.0 μm (Fig. 6). We use the same blended gas, 0.17 wt% C3F8 in pure N2, in both experiments. After generating the MBs, we collect them in a plastic vial that is open to the atmosphere. We transfer a drop of the bubble suspension from the microfluidic chip outlet to a flow cell (IBIDI μ-slide). The inlet and outlet of the flow cell is open to the atmosphere. We dilute the bubble population inside the flow cell with water (Milli-Q, Millipore) to enable visualization with bright-field microscope imaging.
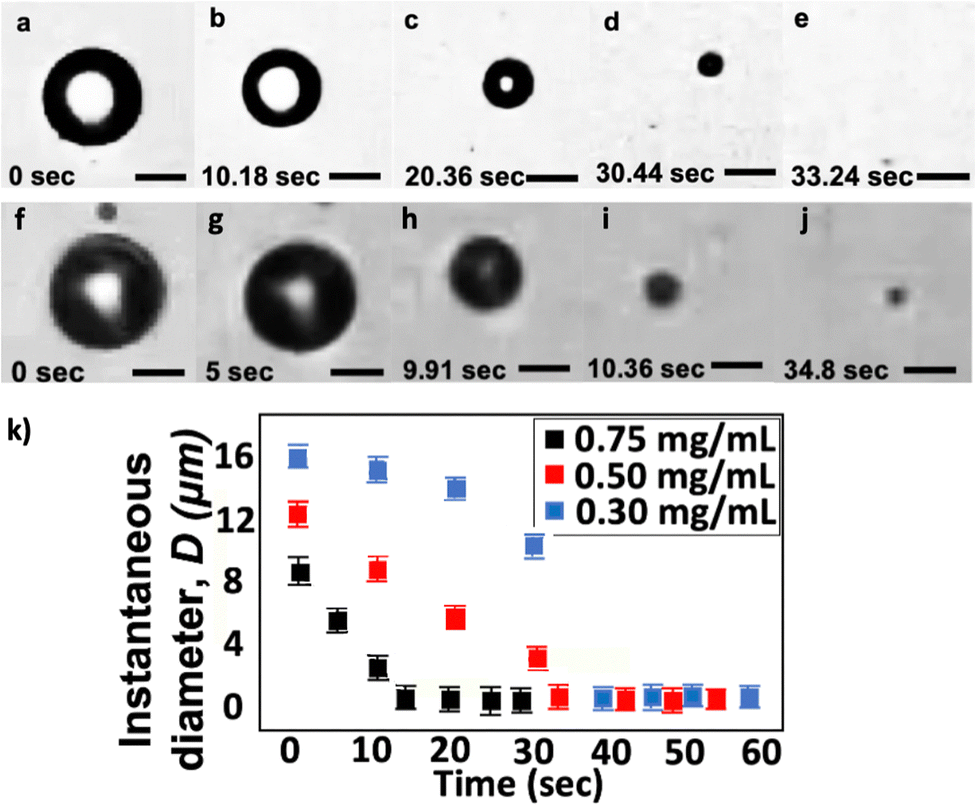 | ||
| Fig. 6 (a–e) Brightfield images of an MB shrinking into a BNB. (a) The bubble has an initial diameter, Di = 12.0 μm at t = 0 s. We define t = 0 s as the moment when bubbles enter the flow cell and begin recording their shrinkage time. (b–d) High-speed brightfield images of the MB shrinking at t = 10, 20, and 30 s, respectively. (e) At t = 33 s, the bubble disappears from the screen of the microscope. RMM size characterization after the experiment shows the corresponding final diameter Df = 195 nm, for the initial diameter Di = 12.0 μm. (f–j) Time-lapse images of an MB with Di = 15.0 μm shrinking to a smaller MB with Df = 1.6 μm. The shrinkage stops after 15 s, and the bubble maintains its final diameter Df = 1.6 μm. (k) This graph shows the instantaneous bubble diameter D, versus time t, with lipid concentrations of 0.75 mg mL−1, 0.50 mg mL−1, and 0.30 mg mL−1. Here, instantaneous microscale bubble diameters D and microscale final diameters Df are measured utilizing high-speed brightfield microscopy and ImageJ software. Nanoscale final diameters Df are measured via RMM. Bubbles in (a and f) are formed using a lipid solution concentration of 0.50 mg mL−1 and a gas of 0.17 wt% C3F8. Scale bars represent 5.0 μm. | ||
Fig. 6a–e show the shrinkage of an MB with Di = 12.0 μm at different times. The total time for the bubble to shrink to the nanoscale is approximately 33 s. We describe the total shrinkage time as the duration from bubbles entering the flow cell until they complete shrinkage and reach a stable diameter. In our experiments, t = 0 is when bubbles first enter the flow cell. Here, we measure the size of the collected bubble sample via the RMM method and find the final diameter Df = 195 nm. Fig. 6k shows that the instantaneous bubble diameter D, at early times, decreases approximately linearly with time t during the shrinkage process. The bubble shrinkage accelerates towards the end of the shrinkage process, as also predicted using the classical Epstein and Plesset theory.30 The difference observed here is that the bubble does not completely vanish but stabilizes to a BNB. Fig. 6f–j shows the shrinkage of an MB with Di = 15.0 μm. In this case, the post-shrinkage final diameter Df = 1.6 μm. The bubble reaches its final size after around 15 s.
3.4 Shrinkage of MBs to BNBs with similar final diameters
Interestingly, MBs bigger and smaller than the critical initial diameter, Di,c, follow two different shrinkage patterns. The former experiences a linear shrinkage trend, with Df dependant on the value of Di, while the latter shrinks into a diameter that is always between 150–250 nm, independent of Di.We attempt to address the question of why bubbles that have Di < Di,c appear to shrink to a characteristic diameter Df = 150–250 nm. We approach this investigation with the assumption that the gas–liquid interface experiences “jamming” due to the close packing of lipids. Namely, when gas dissolution occurs, bubbles start to shrink and the lipids form a monolayer with an increasing packing density until the interfacial tension approaches zero.29,31 The decrease in bubble volume also decreases the average area per insoluble surfactant molecule at the interface, which decreases surface tension until the packing of lipids prevents the nanobubble from further dissolution.29,31 This is also described in molecular dynamics simulations, by Zhang et al., and other researchers, showing that when lipids at the gas–liquid interface pack together, the interfacial tension can approach zero.29,32–34
When the lipids are packed together on the gas–liquid interface, the interfacial free energy of BNBs is dominated by the free energy of the surface curvature.29,31 The Helfrich model can be used to describe the free energy of curvature.35–37 According to this model, when surface tension is zero, bending free energy is  . In this equation, κ represents the bending rigidity or bending modulus, C1 and C2 are bubble surface curvature and the spontaneous lipid monolayer curvature, respectively. Different studies show that when short-chain molecules (e.g. alcohols) are present in the continuous lipid solution, the bending rigidity κ is as small as kBT, where kB and T are Boltzmann constant and temperature, respectively.29,31,38–41 On a bubble's shell, short chains sit between the long chains and space them apart so that their ends swing freely.42 Moreover, short-chains may also move across in the gas–liquid interface and disrupt the packing of lipid hydrocarbon chains on the bubble's shell. All these factors may contribute to a considerable reduction in the bending stiffness κ of the bubble's shell.39
Closely examining the lipid solution used in our study reveals that glycerol comprises a large amount of the lipid solution compared to the lipids present. Glycerol, also referred to as trihydroxy alcohol, is classified as a short-chain alcohol.43,44 Our lipid solution has a high glycerol-to-lipid mass ratio of 120.
Given the impacts of short chains on the bending rigidity κ of the shell, numerous studies have shown that when κ is comparable to kBT, thermal fluctuations determine the radius of the shell's curvature.29,31,38–41 In our study, the radius of the shell's curvature corresponds to the radius of a bubble. Assuming that the temperature fluctuations govern the bending energy of the shell, we can demonstrate the relationship between the two using the persistence length of the bubble's shell, ξk = ξ0exp(4πκ/2kBT).31 In this equation, ξ0 = 10 Å, which is approximately equal with the length of the lipid molecules.31 With κ = kBT and ξ0 = 10 Å, the model of Chen et al. would predict a final BNB diameter of approximately 132 nm,31 which has the same order-of-magnitude as the BNB diameters we observe in our experiments. We, therefore, find a reasonable agreement between the experimental results of our study and the theoretical predictions of Chen et al.31 Some differences between the predicted and experimental BNB diameters may be attributed to the type of lipids used to generate BNBs. Specifically, our lipid solution may not accurately fit the assumption that bending rigidity is entirely dominated by kBT (i.e. the actual bending rigidity may be slightly higher, which would increase the diameter of the final BNB).
4. Conclusions
In this study, we identify a critical initial diameter, Di,c of MBs made with microfluidic flow-focusing, where bubbles larger and smaller than Di,c exhibit distinct shrinking behaviours. When the initial diameter Di < Di,c, an unexpected phenomenon occurs in which all the MBs shrink to the same range of final diameters. In contrast, when Di > Di,c, MBs shrink by the amount predicted by previous literature.17 Specifically, when MB Di < Di,c, MBs appear to always shrink to a diameter Df = 150–250 nm, using the lipid concentrations in our experiments. We observe that the critical initial diameter, Di,c ranges between 13.0–15.0 μm, for lipid concentrations of 0.30–0.75 mg mL−1, respectively. To the best of our knowledge, this is the first experimental report of a critical MB diameter that delineates between MBs shrinking by an anticipated amount, and MBs shrinking dramatically to become stable BNBs.Conflicts of interest
The authors declare no conflict of interest.Acknowledgements
SSH Tsai acknowledges funding support from the Canadian Natural Sciences and Engineering Research Council (NSERC) Discovery grants program (RGPIN-2019-04618), and equipment funding from the Canada Foundation for Innovation (CFI, projects # 30994, 36687 & 36442), the Ontario Research Fund (ORF), and Toronto Metropolitan University. MCK is thankful for research funding support from the Natural Sciences and Engineering Research Council of Canada (RGPIN-2022-04143) and Toronto Metropolitan University. The Canada Foundation for Innovation, the Ontario Ministry of Research and Innovation, and Toronto Metropolitan University provided funding to purchase equipment. The authors also thank Dr. AA Exner for useful discussions on lipid formulations.References
- A. A. Paknahad, L. Kerr, D. A. Wong, M. C. Kolios and S. S. H. Tsai, Biomedical nanobubbles and opportunities for microfluidics, RSC Adv., 2021, 11(52), 32750–32774 RSC.
- C. Li and H. Zhang, A review of bulk nanobubbles and their roles in flotation of fine particles, Powder Technol., 2022, 395, 618–633 CrossRef CAS.
- E. P. Favvas, G. Z. Kyzas, E. K. Efthimiadou and A. C. Mitropoulos, Bulk nanobubbles, generation methods and potential applications, Curr. Opin. Colloid Interface Sci., 2021, 54, 101455 CrossRef CAS.
- M. Zhang, J. Yang, Z. Kang, X. Wu, L. Tang and Z. Qiang, et al., Removal of micron-scale microplastic particles from different waters with efficient tool of surface-functionalized microbubbles, J. Hazard. Mater., 2021, 404, 124095 CrossRef CAS PubMed.
- R. H. Perera, H. Wu, P. Peiris, C. Hernandez, A. Burke and H. Zhang, et al., Improving performance of nanoscale ultrasound contrast agents using N,N-diethylacrylamide stabilization. Nanomedicine: Nanotechnology, Biol. Med., 2016, 1–9 Search PubMed.
- A. A. Exner and M. C. Kolios, Bursting microbubbles: How nanobubble contrast agents can enable the future of medical ultrasound molecular imaging and image-guided therapy, Curr. Opin. Colloid Interface Sci., 2021, 54, 101463 CrossRef CAS PubMed.
- J. L. Parker, P. M. Claesson and P. Attard, Bubbles, cavities, and the long-ranged attraction between hydrophobic surfaces, J. Phys. Chem. C, 1994, 98(34), 8468–8480 CrossRef CAS.
- G. S. Manning, On the thermodynamic stability of bubbles, immiscible droplets, and cavities, Phys. Chem. Chem. Phys., 2020, 22(31), 17523–17531 RSC.
- L. Zhou, S. Wang, L. Zhang and J. Hu, Generation and stability of bulk nanobubbles: A review and perspective, Curr. Opin. Colloid Interface Sci., 2021, 53, 101439 CrossRef CAS.
- P. A. Satpute and J. C. Earthman, Hydroxyl ion stabilization of bulk nanobubbles resulting from microbubble shrinkage, J. Colloid Interface Sci., 2021, 584, 449–455 CrossRef CAS PubMed.
- D. H. Kim, M. J. Costello, P. B. Duncan and D. Needham, Mechanical properties and microstructure of polycrystalline phospholipid monolayer shells: Novel solid microparticles, Langmuir, 2003, 19(20), 8455–8466 CrossRef CAS.
- S. R. Sirsi and M. A. Borden, Microbubble compositions, properties and biomedical applications, Bubble Sci., Eng., Technol., 2009, 1(1–2), 3–17 CrossRef CAS PubMed.
- N. Nirmalkar, A. W. Pacek and M. Barigou, Interpreting the interfacial and colloidal stability of bulk nanobubbles, Soft Matter, 2018, 14(47), 9643–9656 RSC.
- N. Nirmalkar, A. W. Pacek and M. Barigou, On the existence and stability of bulk nanobubbles, Langmuir, 2018, 34(37), 10964–10973 CrossRef CAS PubMed.
- S. A. Peyman, J. R. McLaughlan, R. H. Abou-Saleh, G. Marston, B. R. G. Johnson and S. Freear, et al., On-chip preparation of nanoscale contrast agents towards high-resolution ultrasound imaging, Lab Chip, 2016, 16(4), 679–687 RSC.
- R. H. Abou-Saleh, F. J. Armistead, D. V. B. Batchelor, B. R. G. Johnson, S. A. Peyman and S. D. Evans, Horizon: Microfluidic platform for the production of therapeutic microbubbles and nanobubbles., Rev. Sci. Instrum., 2021, 92(7), 074105 CrossRef CAS PubMed.
- I. O. Zalloum, A. A. Paknahad, M. C. Kolios, R. Karshafian and S. S. H. Tsai, Controlled Shrinkage of Microfluidically Generated Microbubbles by Tuning Lipid Concentration, Langmuir, 2022, 38(43), 13021–13029 CrossRef CAS PubMed.
- A. De Leon, R. Perera, C. Hernandez, M. Cooley, O. Jung and S. Jeganathan, et al., Contrast enhanced ultrasound imaging by nature-inspired ultrastable echogenic nanobubbles, Nanoscale, 2019, 11(33), 15647–15658 RSC.
- Q. Wang, H. Zhao, N. Qi, Y. Qin, X. Zhang and Y. Li, Generation and stability of size-adjustable bulk nanobubbles based on periodic pressure change, Sci. Rep., 2019, 9(1), 1–9 CrossRef PubMed.
- J. Jin, R. Wang, J. Tang, L. Yang, Z. Feng and C. Xu, et al., Dynamic tracking of bulk nanobubbles from microbubbles shrinkage to collapse, Colloids Surf., A, 2020, 589, 124430 CrossRef CAS.
- C. Counil, E. Abenojar, R. Perera and A. A. Exner, Extrusion: A New Method for Rapid Formulation of High-Yield, Monodisperse Nanobubbles, Small, 2022, 18(24), 1–11 CrossRef PubMed.
- L. Zhou, S. Wang, L. Zhang and J. Hu, Generation and stability of bulk nanobubbles: A review and perspective, Curr. Opin. Colloid Interface Sci., 2021, 53, 101439 CrossRef CAS.
- E. C. Abenojar, I. Bederman, A. C. de Leon, J. Zhu, J. Hadley, M. C. Kolios and A. A. Exner, Theoretical and experimental gas volume quantification of micro-and nanobubble ultrasound contrast agents, Pharmaceutics, 2020, 12(3), 208 CrossRef CAS PubMed.
- A. A. Paknahad, L. Kerr, D. A. Wong, M. C. Kolios and S. S. H. Tsai, Biomedical nanobubbles and opportunities for microfluidics, RSC Adv., 2021, 11, 32750–32774 RSC.
- M. Alheshibri and V. S. J. Craig, Differentiating between Nanoparticles and Nanobubbles by Evaluation of the Compressibility and Density of Nanoparticles, J. Phys. Chem. C, 2018, 122(38), 21998–22007 CrossRef CAS.
- R. Shih and A. P. Lee, Post-Formation Shrinkage and Stabilization of Microfluidic Bubbles in Lipid Solution, Langmuir, 2016, 32(8), 1939–1946 CrossRef CAS PubMed.
- M. A. Borden and M. L. Longo, Dissolution behavior of lipid monolayer-coated, air-filled microbubbles: Effect of lipid hydrophobic chain length, Langmuir, 2002, 18(24), 9225–9233 CrossRef CAS.
- M. Abkarian, A. B. Subramaniam, S. H. Kim, R. J. Larsen, S. M. Yang and H. A. Stone, Dissolution arrest and stability of particle-covered bubbles, Phys. Rev. Lett., 2007, 99(18), 1–4 CrossRef PubMed.
- H. Zhang, S. Chen, Z. Guo and X. Zhang, The fate of bulk nanobubbles under gas dissolution, Phys. Chem. Chem. Phys., 2022, 24(16), 9685–9694 RSC.
- P. S. Epstein and M. S. Plesset, On the stability of gas bubbles in liquid-gas solutions, J. Chem. Phys., 1951, 19(2), 256 CrossRef CAS.
- C. Chen, H. Zhang and X. Zhang, Stable bulk nanobubbles can be regarded as gaseous analogues of microemulsions, ChemRxiv, 2022, preprint DOI:10.26434/chemrxiv-2022-hq85x.
- R. Cantor, Nonionic Diblock Copolymers as Surfactants between Immiscible Solvents, Macromolecules, 1981, 14(5), 1186–1193 CrossRef CAS.
- J. L. Cayias, R. S. Schechter and W. H. Wade, The utilization of petroleum sulfonates for producing low interfacial tensions between hydrocarbons and water, J. Colloid Interface Sci., 1977, 59(1), 31–38 CrossRef CAS.
- H. Eicke and J. Rehak, On the Formation of Water/Oil-Microemulsions, Helv. Chim. Acta, 1976, 59(306), 2883–2891 CrossRef CAS.
- W. Helfrich, Effect of Thermal Undulations on the Rigidity of Fluid Membranes and Interfaces, J. Phys., 1985, 46(7), 1263–1268 CrossRef CAS.
- W. Helfrich, Elastic Properties of Lipid Bilayers: Theory and Possible Experiments. Zeitschrift fur Naturforschung-Section C, J. Biosci., 1973, 28(11–12), 693–703 CAS.
- J. Oberdisse and T. Hellweg, Structure, interfacial film properties, and thermal fluctuations of microemulsions as seen by scattering experiments, Adv. Colloid Interface Sci., 2017, 247, 354–362 CrossRef CAS PubMed.
- I. Szleifer, D. Kramer, A. Ben-Shaul, D. Roux and W. M. Gelbart, Curvature elasticity of pure and mixed surfactant films, Phys. Rev. Lett., 1988, 60(19), 1966–1969 CrossRef CAS PubMed.
- B. P. Binks, J. Meunier, O. Abillon and D. Langevin, Measurement of Film Rigidity and Interfacial Tensions in Several Ionic Surfactant-Oil-Water Microemulsion Systems, Langmuir, 1989, 5(2), 415–421 CrossRef CAS.
- J. M. Di Meglio, M. Dvolaitzky and C. Taupin, Determination of the rigidity constant of the amphiphilic film in “birefringent microemulsions”: The role of the cosurfactant, J. Phys. Chem., 1985, 89(5), 871–874 CrossRef CAS.
- J. Meunier, Measurement of the rigidity coefficient of a surfactant layer and structure of the oil or water microemulsion interface, J. physique, Lett., 1985, 46(21), 1005–1014 CrossRef CAS.
- C. R. Safinya, D. Roux, G. S. Smith, S. K. Sinha, P. Dimon and N. A. Clark, et al., Steric interactions in a model multimembrane system: A synchrotron X-ray study, Phys. Rev. Lett., 1986, 57(21), 2718–2721 CrossRef CAS PubMed.
- H. Zhang, F. Feng, J. Li, X. Zhan, H. Wei and H. Li, et al., Formulation of food-grade microemulsions with glycerol monolaurate: Effects of short-chain alcohols, polyols, salts and nonionic surfactants, Eur. Food Res. Technol., 2008, 226(3), 613–619 CrossRef CAS.
- A. Yaghmur, A. Aserin and N. Garti, Phase behavior of microemulsions based on food-grade nonionic surfactants: Effect of polyols and short-chain alcohols, Colloids Surf., A, 2002, 209(1), 71–81 CrossRef CAS.
Footnote |
| † Electronic supplementary information (ESI) available. See DOI: https://doi.org/10.1039/d3sm00380a |
| This journal is © The Royal Society of Chemistry 2023 |