DOI:
10.1039/C5RA13404H
(Paper)
RSC Adv., 2015,
5, 64790-64796
Facile synthesis of fluorescent carbon dots for determination of curcumin based on fluorescence resonance energy transfer
Received
8th July 2015
, Accepted 20th July 2015
First published on 22nd July 2015
Abstract
In the present work, a novel sensing system based on fluorescence resonance energy transfer (FRET) between carbon dots (CDs) and curcumin (Cur) was designed for Cur detection. CDs were synthesized via a facile one-pot pyrolysis treatment using diethylenetriaminepentaacetic acid (DTPA) as the carbon source. The as-prepared CDs possessed strong blue fluorescence and excitation wavelength-dependent emission behavior with the maximum excitation and emission wavelength at 360 nm and 420 nm, respectively. However, the fluorescence of the CDs quenched with the introduction of Cur via FRET and the decreased intensity was linearly proportional to the concentration of Cur in the range of 0.74–5.18 μg mL−1, leading to the quantitative detection of Cur with an excellent detection limit of 44.8 ng mL−1. Furthermore, the CD-based probe can be applied in the determination of Cur in real samples with satisfactory results. The proposed method is thus expected to become a potential tool for the fast response of Cur.
Introduction
Curcumin, 1,7-bis-(4-hydroxy-3-methoxyphenyl)-1,6-heptadiene-2,5-dione (Fig. 1), is a phenolic compound derived from the rhizomes of turmeric (Curcuma longa Linn.).1 It can be used as a coloring agent2,3 and also has been well applied in the medical industry due to its antioxidant and anti-inflammatory properties.4–6 More importantly, extensive clinical trials have addressed the fact that curcumin could effectively disaggregate amyloid β associated with Alzheimer's disease as well as prevent fibril and oligomer formation for preventing or treating Alzheimer's disease, furthermore curcumin has exhibited activities against numerous cancer types in human clinical trials.7–9 Because of the emphasis on the use of curcumin in the medical industry and clinical therapy, a number of methods have been developed for quantification of curcumin, such as spectrophotometry,10,11 spectrofluorimetry,12,13 high performance liquid chromatography,14 high-performance thin-layer chromatographic,15 liquid chromatography-mass spectrometry,16 electrochemical technique17 and resonance light scattering.18 Here in this paper, a simple carbon dot-based “turn-off” fluorescence method has been proposed for routine curcumin monitoring.
 |
| | Fig. 1 The structure of curcumin. | |
Carbon dots (CDs), a new star member of carbon nanomaterials, have recently been given considerably intense interest since they were first discovered during purification of single-walled carbon nanotubes in 2004 (ref. 19). Compared with other fluorescent nanoparticles such as traditional semiconductor quantum dots and fluorescent metal nanoparticles, CDs exhibit low toxicity, small size, excellent water solubility, strong chemical inertness, broad excitation spectra, outstanding optical stability, high biocompatibility, ease of synthesis and modifications.20,21 Based on the above superior properties, CDs have been used extensively to replace the use of other fluorescent nanoparticles for various applications including bioimaging,22,23 photocatalysis,24,25 fluorescence sensors,26,27 optoelectronic devices28 and drug delivery.29 To date substantial research work has been carried out on the simple synthesis approach to prepare CDs, such as pyrolysis,30 hydrothermal treatment,31,32 electrochemical exfoliation,33 oxidative acid treatment,34 laser ablation,35 microwave irradiation36 and ultrasonic treatment37 of various carbon precursors.
In this work, photoluminescence CDs were synthesized by a facile one-pot pyrolysis approach using diethylenetriaminepentaacetic acid as carbon precursor. The as-prepared CDs exhibit excitation wavelength-dependent photoluminescence with a size around 2–8 nm and a quantum yield of 17%. Subsequently, the prepared CDs were used for curcumin determination with high selectivity and excellent sensitivity based on fluorescence resonance energy transfer. Furthermore, satisfactory results were obtained in detecting curcumin in real drug sample with the present method. The synthesis of the CDs and the principle for the response toward curcumin were illustrated in Scheme 1.
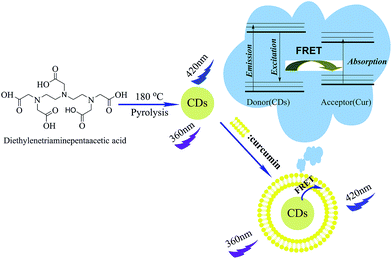 |
| | Scheme 1 Illustration of the formation process of CDs and the principle for the response toward curcumin. | |
Experimental
Apparatus and chemicals
The fluorescence spectra were carried out on an F-2500 spectrofluorophotometer (Hitachi, Tokyo, Japan). Absorption spectra were recorded on a UV-8500 spectrophotometer (Tianmei, Shanghai, China) with a 1 cm quartz cell. A transmission electron microscope (Tecnai G2 F20 S-TWIN, FEI Company, USA) was performed at an accelerating voltage of 200 kV to characterize the morphology of the as-prepared CDs. Fourier transform infrared spectrometer (FTIR-8400S, Kyoto, Japan) was employed to identify functional groups of the as-prepared CDs. A pHS-3D pH meter (Shanghai Scientific Instruments Company, China) was used to adjust the pH values.
Diethylenetriaminepentaacetic acid (DTPA) was obtained Shanghai Chemical Company. All other chemical reagents were purchased from Sigma-Aldrich (Shanghai). Stock solutions of curcumin (37 μg mL−1) was prepared and maintained at 4 °C. Working solutions were freshly prepared by diluting the corresponding stock solution. Britton–Robinson (BR) buffer solutions with different pH were prepared by mixing the mixed acid (composed of 2.71 mL 85% H3PO4, 2.36 mL HAc and 2.47 g H3BO3) with 0.2 mol L−1 NaOH in different proportions. All reagents were of analytical grade and used as received. Ultrapure water was supplied by a Millipore System (18.2 MΩ cm) throughout the whole experiments.
Synthesis of CDs
An aliquot of 0.500 g of DTPA powder was weighed and transferred into a ceramic crucible, then heated in heating mantle at a moderate temperature of 180 °C. About 5 min later, the color of the white powder gradually changed to dark brown-yellow, yielding the fluorescent CDs. The obtained product was dissolved with 15 mL ultrapure water when the crucible cooled to room temperature. The resultant solution was separated by centrifugation at 15![[thin space (1/6-em)]](https://www.rsc.org/images/entities/char_2009.gif) 000 rpm for 30 min and the supernatant was then dialyzed through a dialysis bag (1000 MWCO) for 24 h. The obtained CDs solution was stored at 4 °C for further analysis.
000 rpm for 30 min and the supernatant was then dialyzed through a dialysis bag (1000 MWCO) for 24 h. The obtained CDs solution was stored at 4 °C for further analysis.
Quantum yield measurements
The quantum yield of CDs was measured according to A Guide to Recording Fluorescence Quantum Yields.38 Absolute values were calculated using the standard sample which had a fixed and known fluorescence quantum yield value. In present work, quinine sulfate in 0.1 mol L−1 H2SO4 was chosen as a standard, according to the following equation:
where Φ is the fluorescence quantum yield, Grad refers to the gradient from the plot of integrated fluorescence intensity (excited at 360 nm) against the absorbance (never exceed 0.1 at and above the excitation wavelength in the 1 cm quartz cuvette to minimise re-absorption effects), η is the refractive index of the solvent, and the subscripts ST and X mean the standard and test sample respectively.
Detection of curcumin
In a typical Cur assay, the working solution was obtained by adding 1.0 mL as-prepared CDs and a appropriate volume of Cur solution into a 10.0 mL calibrated tube and diluting to the mark with ultrapure water. The mixture was mixed thoroughly and then incubated for 5 min at room temperature. Subsequently, fluorescent emission spectra were recorded with an excitation wavelength of 360 nm.
Analysis of a real sample
Determining Cur in real sample was performed to verify the accuracy of the proposed method. A drug sample was purchased from a local hospital. 0.1 mL of the sample was added into a 10.0 mL calibrated tube and diluted to the mark with ethanol. The resultant samples were spiked with standard Cur solution at different concentration levels and then analyzed with the proposed method.
Results and discussion
Characterizations of as-prepared CDs
Fig. 2 showed the morphology and the diameter distribution of the carbon dots. It clearly revealed that the as-synthesized CDs are spherical in shape (Fig. 2a) and the size distribution range between 2 nm to 8 nm with the average diameter about 5 nm (Fig. 2b), which indicated that a one-pot facile synthetic strategy was established for the fabrication of CDs.
 |
| | Fig. 2 (a) TEM image and magnified image (inset) and (b) the corresponding size distribution histograms of the synthesized CDs. | |
Fourier transform infrared (FT-IR) was measured to provide further evidence for the components and the surface functional groups of the as-prepared CDs. As shown in Fig. 3, the absorption bands around 3446 cm−1 was accounted for the stretching vibrations of O–H, the band at 3078 cm−1 related to the stretching vibration of ![[double bond, length as m-dash]](https://www.rsc.org/images/entities/char_e001.gif) C–H, the peak at 1733 cm−1 corresponded to the stretching vibration CO, the band at 1647 cm−1 attributed to the stretching vibration of CC, the band at 1400 cm−1 related to the C–N stretching vibration, the band at 1219 cm−1 attributed to the C–O stretching vibration, and the peaks around 1000–650 cm−1 ascribed to C–H bending vibration. The results revealed that multiple functional groups like –COOH, CC and a small amount of N-containing groups were presented on the surface of the synthesized CDs, which can be attributed to the carbonation of DTPA during the pyrolysis treatment, and the presence of these functional groups contributed to the excellent solubility and stability of the CDs.
C–H, the peak at 1733 cm−1 corresponded to the stretching vibration CO, the band at 1647 cm−1 attributed to the stretching vibration of CC, the band at 1400 cm−1 related to the C–N stretching vibration, the band at 1219 cm−1 attributed to the C–O stretching vibration, and the peaks around 1000–650 cm−1 ascribed to C–H bending vibration. The results revealed that multiple functional groups like –COOH, CC and a small amount of N-containing groups were presented on the surface of the synthesized CDs, which can be attributed to the carbonation of DTPA during the pyrolysis treatment, and the presence of these functional groups contributed to the excellent solubility and stability of the CDs.
 |
| | Fig. 3 FT-IR spectrum of the fluorescent CDs. | |
UV-vis absorption spectrum and photoluminescent spectra of the as-prepared CDs in solution were recorded to investigate the optical properties of the as-prepared CDs. The synthesized CDs showed a very broad absorption band (Fig. 4a) due to the n–π* transition of the CO band and π–π* transition of the conjugated CC band.21,39 The peculiar optical property of the CDs is that the emission depends on excitation wavelength. As shown in Fig. 4b, the emission peak would red shift with decreasing intensity while increasing excitation wavelength ranging from 360 nm to 400 nm in 5 nm increments and the inset reflects the corresponding normalized fluorescence emission. The CDs in aqueous solutions exhibited the highest fluorescence emission peak centred at 420 nm with a blue colour when excited at 360 nm, meanwhile the maximum excitation band and the maximum emission band were mirror symmetry.
 |
| | Fig. 4 Characteristic optical spectra of CDs. (a) An overlapping of absorption, excitation and emission spectra of CDs in aqueous solutions. (b) Fluorescence emission spectra and normalized PL spectra (inset) of the obtained CDs in aqueous solutions excited from 360–400 nm. | |
CDs-based fluorescent chemosensor for probing Cur
The strong blue emission of the as-synthesized CDs can be quenched obviously by Cur based on fluorescence resonance energy transfer. Thus CDs can severed as a chemosensor for monitoring Cur.
The fluorescence response of the CDs and the sensing system at different pH was investigated. As displayed in Fig. 5, the fluorescence intensity varied slightly over the pH range of 2.0–6.0, whereas the intensity of the CDs had a tendency to decrease with the intensity of the sensing system tending to increase at higher pH. The reason may be attributed to the presence of the carboxyl groups on the surface of the CDs and the carboxyl groups could be dissociated in basic solutions, which implied that overly basic environment may induced the changes of functional groups, and then the electronic transition of some defects would be disrupted or even prohibited.21 Based on above results, no buffer solution was necessary referred to adjust the acidity in the experiment.
 |
| | Fig. 5 Fluorescence responses of CDs in the absence and presence of 3.70 μg mL−1 Cur at different pH values. | |
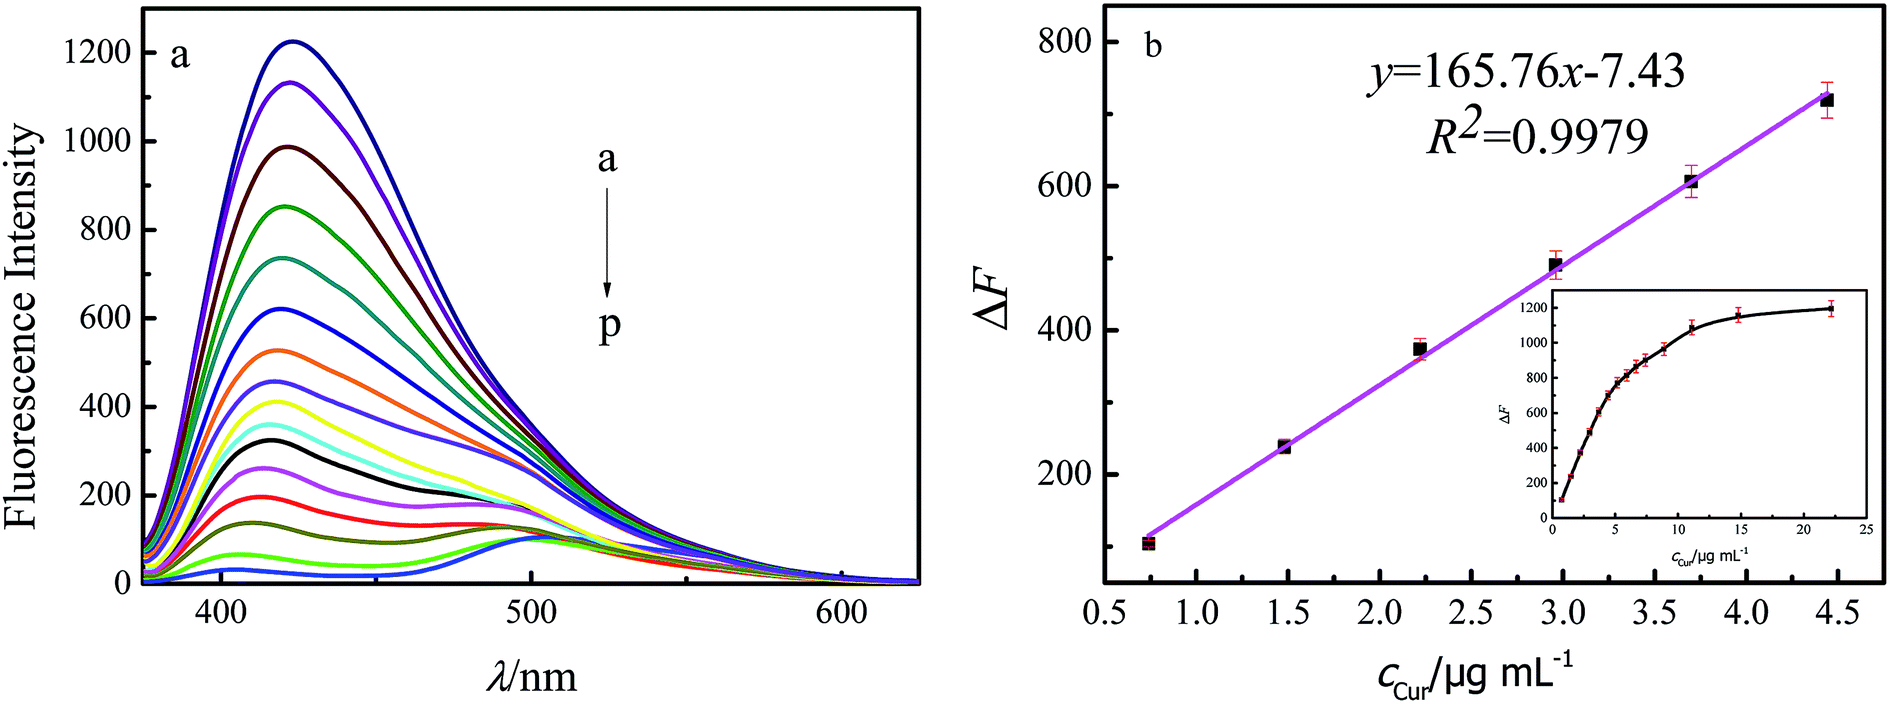
We further explored the sensitivity and the feasibility of the CDs chemosensor. Different concentrations of Cur were added to the aqueous solution of CDs and the fluorescence emission intensity was recorded. As shown in Fig. 6a, the fluorescence intensity of the CDs decreased gradually with Cur concentration increasing and about 97.5% fluorescence was quenched when the Cur concentration was 22.20 μg mL−1, that is, addition of Cur can effectively quench the fluorescence of the CDs. The quenching efficiency (ΔF), however, displayed a good linear relationship against the Cur concentration over the range of 0.74–4.44 μg mL−1 with an excellent detection limit of 44.8 ng mL−1 (Fig. 6b), which suggested that the CDs with sensitive response could be employed as a probe for the quantification of Cur. Besides, analytical features comparison of the proposed method with some typical methods employed for Cur determination was listed in Table 1.
 |
| | Fig. 6 (a) Fluorescence responses of the CDs to different concentrations of curcumin. a–p: Cur = 0, 0.74, 1.48, 2.22, 2.96, 3.70, 4.44, 5.18, 5.92, 6.66, 7.40, 8.88, 11.10, 14.80, 22.20 μg mL−1. (b) The linear correlations of fluorescent intensity toward curcumin concentrations. | |
Table 1 Comparison of the proposed method with some typical methods employed for Cur determination
| Method |
Reagent |
Determination condition |
Detection limit (ng mL−1) |
Ref. |
| Spectrophotometry |
Lecithin; dichloromethane; poly(L-lactic acid); methanol |
λ = 465 nm; |
50 |
10 |
| |
β-Cyclodextrin |
λ = 431 nm; pH = 2.4 |
76 |
11 |
| High performance liquid chromatography |
Ethyl acetate; sodium dodecyl sulfate; acetonitrile; tetrahydrofuran; formic acid |
C18 column; λ = 425 nm |
1.5 |
14 |
| High-performance thin-layer chromatographic |
Chloroform; methanol |
TLC aluminium plates precoated with silica gel 60F-254; λ = 430 nm |
8000 |
15 |
| Liquid chromatography-mass spectrometry |
Acetonitrile; methanol; formic acid |
C18 column |
18.9 |
16 |
| Electrochemical technique |
Graphene |
Graphene-modified glassy carbon electrode; pH = 3.0 (cyclic voltammetry); 0.1 mol L−1 H2SO4 (linear sweep voltammetry) |
11.1 |
17 |
| Resonance light scattering |
Phosphodiesters quaternary ammonium salt |
λmax = 460.5 nm; pH = 4.0 |
2.6 |
18 |
| Spectrofluorimetry |
Sodium dodecylbenzene sulfonate; cetyltrimethylammonium bromide |
λex = 426 nm; pH = 4.0 |
0.017 |
12 |
| |
Acetonitrile; poly (D,L-lactide); soybean hydrogenated lecithin; castor oil; hydroxystearic acid-polyethylene glycol copolymer; poloxamer |
λex = 397 nm |
30 |
13 |
| |
CDs (prepared by DTPA) |
λex = 360 nm |
44.8 |
This work |
To evaluate the selectivity of the proposed method, we investigated the fluorescence response of CDs to Cur at a concentration of 3.70 μg mL−1 (10 μmol L−1) in the presence of different interfering substances at a concentration of 200 μmol L−1. As shown in Fig. 7a, in comparison to the efficient quenching effect of Cur, the influence of some common metal ions (Na+, K+, Ag+, Ca2+, Fe2+, Cu2+, Mg2+, Mn2+, Pb2+, Pd2+, Hg2+, Fe3+), amino acids (L-tryptophane, D-tryptophane, L-phenylalanine, glycine, tyrosine, L-asparaginic acid, L-cystine) and sugars (glucose, malt sugar) could be negligible, except that Fe2+ may quench slightly the fluorescence intensity of the CDs. This also can be confirmed from Fig. 7b, the results were obtained by mixing 3.7 μg mL−1 of Cur with CDs alone (blank bar) and mixing 3.7 μg mL−1 of Cur and 200 μmol L−1 of the above-mentioned interferents with the CDs respectively, suggesting that the fluorescence quenching was mostly caused by interaction between the CDs and Cur. Thus, the prepared CDs can selectively sense Cur.
 |
| | Fig. 7 (a) Selective fluorescence response of CDs toward 3.70 μg mL−1 curcumin and 200 μM other interferents. (b) Selectivity of the sensing system in the presence of 200 μM various interferents. | |
Real sample analysis
To evaluate the practicality of the present method, the fluorescence quenching assay was applied to determine Cur in drug. The real sample was purchased from a local chemist's shop, and used directly without any pretreatment. 0.1 mL of the drug sample was added into a 10 mL calibrated flask and diluted to the mark with distilled water. Then 0.1 mL of the sample solutions was transferred in a 10 mL calibrated flask and detected according to the procedure mentioned above. The recovery was detected by standard addition method and the results of the above determination were listed in Table 2. The corresponding results revealed that the proposed method with well accurate (recovery was between 95.5% and 106.8%) and repeatability (RSD was between 2.9% and 3.6%) could be successfully applied to the analysis of Cur in real sample.
Table 2 Determination of Cur in drug sample
| Samples |
Found (mg mL−1) |
Added (mg mL−1) |
Total found (mg mL−1) |
Recovery (%) |
RSD (%, n = 5) |
| 1 |
10.1 |
7.4 |
18.0 |
106.8 |
3.2 |
| 2 |
10.1 |
14.8 |
24.8 |
99.3 |
2.9 |
| 3 |
10.1 |
22.2 |
31.3 |
95.5 |
3.6 |
Mechanism for the recognition of Cur
The fluorescence quenching may be triggered by the FRET from CDs to Cur. The main requirements for the FRET to occur are (i) sufficient overlap between the donor emission and the acceptor absorption, (ii) the suitable orientation of the transition dipole of donor and acceptor, and (iii) the close proximity distance between the donor and the acceptor (1–10 nm).40 In order to confirm this, emission spectrum of CDs and absorption spectrum of Cur were recorded (Fig. 8) and the result demonstrated that the emission and absorption spectra were well overlapped. This confirms that the fluorescence quenching of CDs is mainly due to the light absorption by Cur. Furthermore, according to the Förster's theory, FRET efficiencies can be calculated using the following equation:41,42| |
 | (1) |
| | |
R06 = 8.79 × 10⁻²⁵k2n−4ΦJ
| (2) |
| |
 | (3) |
where F and F0 represent the fluorescence intensities of donor in the presence and absence of accepter, respectively; R0 is the Förster distance at which the transfer efficiency E = 50%; r is the distance between the energy donor and acceptor; K2 refers to the relative orientation in space of the transition dipoles of the donor and acceptor and K2 = 2/3 is for random orientation as in fluid solution; n is the refractive index of medium; Φ is the fluorescence quantum yield of the donor; J is the overlap integral expressing the degree of spectral overlap between the donor emission and between the emission spectrum of the donor and the absorption spectrum of the acceptor (Fig. 8); F(λ) describes the corrected fluorescence intensity of the donor in the wavelength range λ–λ + Δλ with the total intensity normalized to unity; ε(λ) is the molar absorption coefficient of the acceptor at λ.
 |
| | Fig. 8 Overlap of the fluorescence emission of CDs (a) and the absorption spectrum of curcumin (b). | |
In the present case, according to eqn (1)–(3) we could calculate that J = 3.0589 × 10⁻¹⁴ cm3 L mol−1, E = 49.4%, R0 = 3.1 nm, and r = 3.2 nm. The close proximity of donor and acceptor can be speculated as the direct consequence of the interaction between CDs and Cur through hydrogen bonds. The carboxyl group on the surface of CDs and hydroxyl group on Cur make the as-prepared CDs and Cur are both weak acid, due to this, hydrogen of carboxyl group may combine with the oxygen of hydroxyl group and methoxyl group on Cur through hydrogen bonds. As shown in Fig. 5, the fluorescence intensity of CDs and the sensing system varied slightly over the pH range of 2.0–6.0, whereas the intensity of the sensing system had a tendency to increase at higher pH, indicating that the deprotonation of carboxyl group occurs under alkaline condition and thus leading to the destruction of hydrogen bonds, which further confirm that noncovalent binding of curcumin on the CDs surface impels the close proximity of Cur with CDs and the energy transfer from CDs to Cur.
Conclusion
In conclusion, we have designed a novel strategy to detect Cur in drug sample based on the fluorescence resonance energy transfer. First, fluorescent CDs were one-step synthesized from DTPA. Further, the prepared CDs were served as a turn-off fluorescence sensor, exhibiting high sensitivity and excellent selectivity toward Cur. Well performance in the determination of real samples was also obtained. Thus, we believe that the CDs can be used for practical application in chemical and biological systems by offering rapid, simple detection and quantification.
Acknowledgements
We gratefully acknowledge financial support for this study by grants of the National Natural Science Foundation of China (Grant No.21475014) and the Special Fund of Chongqing Key Laboratory (CSTC).
References
- T. Cooper, G. Clark, J. Guzinski and C. Ho, Food phytochemicals II, teas, spices and herbs, ACS, Washington, DC, USA, 1994 Search PubMed.
- V. Govindarajan and W. H. Stahl, Crit. Rev. Food Sci. Nutr., 1980, 12, 199–301 CrossRef CAS PubMed.
- N. Shankaracharya and C. Natarajan, Indian Spices, 1973, 10, 7–11 Search PubMed.
- T. Ak and I. Gulcin, Chem.–Biol. Interact., 2008, 174, 27–37 CrossRef CAS PubMed.
- Y. Abe, S. Hashimoto and T. Horie, Pharmacol. Res., 1999, 39, 41–47 CrossRef CAS PubMed.
- Z.-Y. Du, X. Wei, M.-T. Huang, X. Zheng, Y. Liu, A. H. Conney and K. Zhang, Arch. Pharmacal Res., 2013, 36, 1204–1210 CrossRef CAS PubMed.
- F. Yang, G. P. Lim, A. N. Begum, O. J. Ubeda, M. R. Simmons, S. S. Ambegaokar, P. P. Chen, R. Kayed, C. G. Glabe and S. A. Frautschy, J. Biol. Chem., 2005, 280, 5892–5901 CrossRef CAS PubMed.
- D. Karunagaran, R. Rashmi and T. Kumar, Curr. Cancer Drug Targets, 2005, 5, 117–129 CrossRef CAS.
- S. C. Gupta, S. Patchva and B. B. Aggarwal, AAPS J., 2013, 15, 195–218 CrossRef CAS PubMed.
- R. A. da Silva-Buzanello, A. C. Ferro, E. Bona, L. Cardozo-Filho, P. H. H. de Araújo, F. V. Leimann and O. H. Gonçalves, Food Chem., 2015, 172, 99–104 CrossRef PubMed.
- B. Tang, L. Ma, H.-y. Wang and G.-y. Zhang, J. Agric. Food Chem., 2002, 50, 1355–1361 CrossRef CAS PubMed.
- F. Wang, X. Wu, F. Wang, S. Liu, Z. Jia and J. Yang, J. Fluoresc., 2006, 16, 53–59 CrossRef CAS PubMed.
- L. Mazzarino, I. C. Bellettini, E. Minatti and E. Lemos-Senna, Braz. J. Pharm. Sci., 2010, 46, 219–226 CAS.
- Y. R. Han, J. J. Zhu, Y. R. Wang, X. S. Wang and Y. H. Liao, Biomed. Chromatogr., 2011, 25, 1144–1149 CrossRef CAS PubMed.
- M. Ansari, S. Ahmad, K. Kohli, J. Ali and R. Khar, J. Pharm. Biomed. Anal., 2005, 39, 132–138 CrossRef CAS PubMed.
- R. Li, C. Xiang, M. Ye, H.-F. Li, X. Zhang and D.-A. Guo, Food Chem., 2011, 126, 1890–1895 CrossRef CAS PubMed.
- K. Li, Y. Li, L. Yang, L. Wang and B. Ye, Anal. Methods, 2014, 6, 7801–7808 RSC.
- X. Chen, S. Liang, L. Zhu, J. Liu, G. Zhang and Z. Chen, Phytochem. Anal., 2012, 23, 456–461 CrossRef CAS PubMed.
- X. Xu, R. Ray, Y. Gu, H. J. Ploehn, L. Gearheart, K. Raker and W. A. Scrivens, J. Am. Chem. Soc., 2004, 126, 12736–12737 CrossRef CAS PubMed.
- S. N. Baker and G. A. Baker, Angew. Chem., Int. Ed., 2010, 49, 6726–6744 CrossRef CAS PubMed.
- Q. Liang, W. Ma, Y. Shi, Z. Li and X. Yang, Carbon, 2013, 60, 421–428 CrossRef CAS PubMed.
- H. Ding, L.-W. Cheng, Y.-Y. Ma, J.-L. Kong and H.-M. Xiong, New J. Chem., 2013, 37, 2515–2520 RSC.
- S. Mitra, S. Chandra, S. H. Pathan, N. Sikdar, P. Pramanik and A. Goswami, RSC Adv., 2013, 3, 3189–3193 RSC.
- H. Li, X. He, Z. Kang, H. Huang, Y. Liu, J. Liu, S. Lian, C. H. A. Tsang, X. Yang and S. T. Lee, Angew. Chem., Int. Ed., 2010, 49, 4430–4434 CrossRef CAS PubMed.
- H. Li, R. Liu, S. Lian, Y. Liu, H. Huang and Z. Kang, Nanoscale, 2013, 5, 3289–3297 RSC.
- C.-L. Li, C.-C. Huang, A. P. Periasamy, P. Roy, W.-C. Wu, C.-L. Hsu and H.-T. Chang, RSC Adv., 2015, 5, 2285–2291 RSC.
- R. Zhang and W. Chen, Biosens. Bioelectron., 2014, 55, 83–90 CrossRef CAS PubMed.
- X. Guo, C.-F. Wang, Z.-Y. Yu, L. Chen and S. Chen, Chem. Commun., 2012, 48, 2692–2694 RSC.
- Q. Wang, X. Huang, Y. Long, X. Wang, H. Zhang, R. Zhu, L. Liang, P. Teng and H. Zheng, Carbon, 2013, 59, 192–199 CrossRef CAS PubMed.
- C. Stan, C. Albu, A. Coroaba, M. Popa and D. Sutiman, J. Mater. Chem. C, 2015, 3, 789–795 RSC.
- Z. L. Wu, P. Zhang, M. X. Gao, C. F. Liu, W. Wang, F. Leng and C. Z. Huang, J. Mater. Chem. B, 2013, 1, 2868–2873 RSC.
- J. H. Zhu, M. M. Li, S. P. Liu, Z. F. Liu, Y. F. Li and X. L. Hu, Sens. Actuators, B, 2015, 219, 261–267 CrossRef CAS PubMed.
- H. Ming, Z. Ma, Y. Liu, K. Pan, H. Yu, F. Wang and Z. Kang, Dalton Trans., 2012, 41, 9526–9531 RSC.
- S. Liu, J. Tian, L. Wang, Y. Luo and X. Sun, RSC Adv., 2011, 2, 411–413 RSC.
- Y.-P. Sun, B. Zhou, Y. Lin, W. Wang, K. S. Fernando, P. Pathak, M. J. Meziani, B. A. Harruff, X. Wang and H. Wang, J. Am. Chem. Soc., 2006, 128, 7756–7757 CrossRef CAS PubMed.
- Q. Wang, H. Zheng, Y. Long, L. Zhang, M. Gao and W. Bai, Carbon, 2011, 49, 3134–3140 CrossRef CAS PubMed.
- H. Li, X. He, Y. Liu, H. Huang, S. Lian, S.-T. Lee and Z. Kang, Carbon, 2011, 49, 605–609 CrossRef CAS PubMed.
- H. J. Yvon, A Guide to Recording Fluorescence Quantum Yields, HORIBA, Jobin Yvon Ltd., Stanmore, Middlesex, UK, 2012 Search PubMed.
- Z. Ma, H. Ming, H. Huang, Y. Liu and Z. Kang, New J. Chem., 2012, 36, 861–864 RSC.
- H. M. Zhang, Y. Q. Wang and Q. H. Zhou, J. Lumin., 2010, 130, 781–786 CrossRef CAS PubMed.
- N. Y. Chen, H. F. Li, Z. F. Gao, F. Qu, N. B. Li and H. Q. Luo, Sens. Actuators, B, 2014, 193, 730–736 CrossRef CAS PubMed.
- J. R. Lakowicz, Principles of fluorescence spectroscopy, Springer Science & Business Media, 2007 Search PubMed.
|
| This journal is © The Royal Society of Chemistry 2015 |
Click here to see how this site uses Cookies. View our privacy policy here.