DOI:
10.1039/C5RA08025H
(Paper)
RSC Adv., 2015,
5, 64106-64118
Removal of dyes and heavy metal ions from water by magnetic hydrogel beads based on poly(vinyl alcohol)/carboxymethyl starch-g-poly(vinyl imidazole)
Received
1st May 2015
, Accepted 8th July 2015
First published on 16th July 2015
Abstract
Novel magnetic nanocomposite hydrogel (m-CVP) beads were prepared by instantaneous gelation of carboxymethyl starch-g-polyvinyl imidazole (CMS-g-PVI), poly(vinyl alcohol) (PVA), and Fe3O4 mixture in boric acid solution followed by crosslinking by glutaraldehyde (GA). Highly porous m-CVP beads with magnetic sensitivity were fully characterized and used as eco-friendly adsorbent for the removal of crystal violet (CV) and congo red (CR) dye and Pb(II), Cu(II) and Cd(II) from water. Batch adsorption results showed that the sorbent had high affinity to the heavy metals and dyes in water. The adsorption kinetics results showed that the adsorption rates could be described by pseudo-second-order kinetics, indicating chemical sorption as the rate determining step. Sorption of Pb(II), Cu(II), Cd(II), CR and CV to m-CVP beads agreed well with the Langmuir adsorption model at different ionic strengths, with maximum adsorption capacities of 65.00, 83.60, 53.20, 83.66 and 91.58 mg g−1, respectively. Positive values of ΔH0 showed that the adsorption was chemisorption, and the negative values of ΔG0 indicated the spontaneity of the pollutant adsorption. Desorption and reusability of m-CVP beads was also investigated for tested heavy metal ions and dyes based on sequential adsorption–desorption cycles. All the studied results indicated that m-CVP beads were an efficient, low cost, and reusable adsorbent for the removal of dye and heavy metal ions from aqueous solutions.
1. Introduction
The effective treatment of chemical contaminations of water in the environment has become one of the major issues of public interest due to their toxicity. Heavy metal ions, aromatic compounds (including phenolic derivatives, and polycyclic aromatic compounds) and dyes are often found in the environment as a result of their wide industrial use.1 There are many kinds of technologies used for heavy metal and dye removal of wastewater, such as membrane separation, chemical oxidation, coagulation and flocculation, photocatalytic degradation, and adsorption methods.2–6 Adsorption is now the most common technology for removal of dyes and heavy metals from water due to its effectiveness, efficiency, economy and lack of secondary pollution. Magnetic separation is one of the promising methods of environmental purification, because it produces no contaminants such as flocculants and it has the capability of treating large amounts of wastewater within a short time. Embedding magnetic nanoparticles in porous polymer materials can expand the absorption capacity due to the improvement in electrostatic interaction.7
Recently, natural low cost polysaccharide materials such as starch, chitosan and gum have gained interest for application as adsorbents in wastewater treatment because of their biodegradability and non-toxic nature.8–10 Starch is a biodegradable agriculturally derived biopolymer with some limiting properties including poor chemical stability, low mechanical strength and difficult recovery. Chemical modification of starch can greatly improve its properties. A variety of starch derivatives containing amide, amino, carboxyl and other groups have been prepared and utilized in water treatment for decades.11–13 Combining two or more polymers has increasingly become an important technique for the development of new biomaterials with improved properties that could not be achieved by individual polymers. Poly(vinyl alcohol) (PVA) is a water soluble, biodegradable and nontoxic polymer that has been used in many blend formations for biomedical8 and water treatment applications.14,15 PVA beads and chitosan/PVA hydrogel beads have been widely investigated as effective adsorbents for heavy metal ions and dyes.14–18 PVA/starch blend is also recognized as a potential biodegradable polymeric material.19 However, study on preparation, characterization and adsorption properties of magnetic crosslinked starch/PVA hydrogel in bead form for dye and heavy metal removal has not yet been studied.
In the present study, 1-vinyl imidazole (VI) was graft-copolymerized onto macromolecular chains of acid functionalized carboxymethyl starch (CMS) in the presence of potassium persulfate as an initiator to afford a water soluble CMS-g-PVI copolymer. Then, a mixture of CMS-g-PVI, PVA, and Fe3O4 nanoparticles was used in the preparation of magnetic hydrogel nanocomposite beads (m-CVP) by instantaneous gelation method in boric acid followed by crosslinking by glutaraldehyde (GA). The prepared beads were characterized by FT-IR, scanning electron microscopy (SEM), vibrating sample magnetometer (VSM), X-ray diffraction (XRD), energy-dispersive X-ray spectroscopy (EDX), transmission electron microscopy (TEM) and thermal gravimetric analysis (TGA). The adsorption equilibrium of a cationic dye, crystal violet (CV), and an anionic azo dye, congo red (CR), and heavy metal ions such as Cu(II), Pb(II) and Cd(II) from aqueous solutions on m-CVP beads was investigated in detail. The effects of various parameters such as initial dye and heavy metal ion concentration, contact time, and temperature on adsorption were studied to investigate adsorption isotherms, kinetics and thermodynamics. Adsorption–desorption experiments were also undertaken to find out the reusability of the adsorbent.
2. Experimental
2.1. Materials
Polyvinyl alcohol (PVA) was 98% hydrolyzed with a molecular weight average of 49![[thin space (1/6-em)]](https://www.rsc.org/images/entities/char_2009.gif) 000 and purchased from Aldrich Chemical Company. Glutaraldehyde (GA) aqueous solution (25 wt%), starch, sodium hydroxide, monochloroacetic acid, hydrochloric acid and ammonia solution were purchased from Merck and used without further purification. 1-Vinylimidazole (VI), copper sulfate (Cu(SO4)2·5H2O), cadmium chloride (CdCl2·12H2O), lead nitrate (Pb(NO3)2), ferric chloride (FeCl3·6H2O), and ferrous chloride (FeCl2·7H2O) were purchased from Fluka. Potassium persulfate (KPS) (Aldrich) was used as an initiator for grafting PVI onto carboxymethyl starch (CMS). Congo red (CR) and crystal violet (CV) dye were purchased from Sigma-Aldrich.
000 and purchased from Aldrich Chemical Company. Glutaraldehyde (GA) aqueous solution (25 wt%), starch, sodium hydroxide, monochloroacetic acid, hydrochloric acid and ammonia solution were purchased from Merck and used without further purification. 1-Vinylimidazole (VI), copper sulfate (Cu(SO4)2·5H2O), cadmium chloride (CdCl2·12H2O), lead nitrate (Pb(NO3)2), ferric chloride (FeCl3·6H2O), and ferrous chloride (FeCl2·7H2O) were purchased from Fluka. Potassium persulfate (KPS) (Aldrich) was used as an initiator for grafting PVI onto carboxymethyl starch (CMS). Congo red (CR) and crystal violet (CV) dye were purchased from Sigma-Aldrich.
2.2. Preparation of carboxymethyl starch (CMS)
The experimental technique adopted for carboxymethylation of starch was as follows: 3.2 g sodium hydroxide, 4 g starch, 4 g monochloroacetic acid and 20 mL distilled water were put inside of a 100 mL flask.20 The mixture was stirred under magnetic stirring at 60 °C for 3 h and then was neutralized with 10 wt% acetic acid solution. The reaction product was precipitated in ethanol, filtered and then dried in a vacuum oven at 60 °C for 4 h.
2.3. Preparation of carboxymethyl starch-g-poly(vinyl imidazole) (CMS-g-PVI)
1 g CMS was dissolved in 50 mL distilled water in a three-necked flask and stirred magnetically for 15 min to obtain a homogeneous solution. Then 3.7 g 1-vinyl imidazole (VI) was added into the solution and purged with argon gas for 30 min. The temperature was raised to 60 °C and a solution of potassium persulfate (KPS) was added to the solution to initiate the graft copolymerization of VI. The reaction proceeded at 60 °C for 3 h. The reaction product was precipitated in acetone, filtered, and then extracted with hot methanol for 24 h. The synthetic procedure for preparation of CMS-g-PVI and CMS from starch is illustrated in Fig. 1a. The following equation was used to estimate the grafting yield:| |
 | (1) |
where W1 and W2 are the weights of CMS before and after graft reaction. The grafting yield was obtained as 200% (±15.6) for PVI grafted carboxymethyl starch.
 |
| | Fig. 1 Illustration of synthetic procedure for preparation of CMS and CMS-g-PVI (a), and preparation of m-CVP beads (b). | |
2.4. Preparation of Fe3O4 nanoparticles
Magnetic Fe3O4 nanoparticles were prepared by conventional co-precipitation method.21 FeCl3·6H2O (10 mmol, 2.730 g) and FeCl2·7H2O (5 mmol, 0.994 g) were dissolved in deionized water (20 mL) and stirred at 80 °C. Then, 80 mL NH4OH solution (1.5 M) was added into the mixture under N2 atmosphere until the pH reached 10 and the reaction mixture was stirred for 1 h. The formed black precipitate was separated by an external magnet, and then was washed several times with deionized water.
2.5. Preparation of magnetic hydrogel beads
The CMS-g-PVI/PVA/Fe3O4 hydrogel beads (m-CVP) with weight ratios (w/w) of (CMS-g-PVI):(PVA):(magnetite) = 2:2:1 were prepared by instantaneous gelation method followed by chemical crosslinking by GA.16 First, CMS-g-PVI (2 g) was dissolved in distilled water (40 mL) and 5 wt% PVA solution was prepared by dissolving a certain amount of PVA powder in distilled water at 80 °C. Then, the PVA solution was mixed homogenously with CMS-g-PVI solution, and then stirred vigorously with Fe3O4 nanoparticles for 24 h to form a gel-forming solution. After that, the mixture was dropped through a syringe needle into acetone solution of boric acid under stirring at 300 rpm where spherical beads were formed instantaneously. The beads were retained in this solution for 24 h. For chemical crosslinking, 1.5 mL glutaraldehyde and 1 mL hydrochloric acid (1 M) was added to the above mixture and then incubated for 8 h at 55 °C. It is worth noting that the magnetic hydrogel beads were recovered with the help of an external magnet in order to remove unreacted chemicals. Finally, the beads were rinsed with distilled water and dried at 50 °C in a vacuum oven.
2.6. Characterization
FT-IR spectra were recorded in the range of 400–4000 cm−1 on KBr pellets using a Bruker Vector 22 FT-IR spectrophotometer (Bruker, Karlsrohe, Germany). Scanning electron microscopy (SEM) (Leo 1455 VP, Germany) was used to study the surface morphology of m-CVP beads. TEM imaging of m-CVP beads was performed using an instrument (model EM10C, Zeiss Co.) with an accelerating voltage of 80 kV. A vibrating sample magnetometer (VSM) (Kavir Magnetic Co. Iran) was used to evaluate the room temperature magnetic parameter of Fe3O4 and magnetic hydrogel beads with an applied field from −10000 to +10000 Oe. In VSM, the sample under study was kept in a magnetic field to be magnetized by aligning the magnetic dipoles or the individual magnetic spins of the magnetic particles along the direction of the applied magnetic field. The stronger the applied field, the larger is the magnetization. The thermal behavior of m-CVP beads was evaluated by TGA (Rheometric Scientific, USA) from room temperature up to 600 °C under nitrogen atmosphere with a heating rate of 10 °C min−1. XRD measurements were carried out using an X-ray diffractometer (XRD, GBC MMA Instrument). The patterns with the CuKα radiation (1.5418 Å) at 35.4 kV and 28 mA were recorded in the 2θ region from 10° to 80°. The Brunauer–Emmett–Teller (BET) surface area of m-CVP beads was obtained from N2 adsorption isotherms at 77 K with a Micromeritic chemisorb 2750 analyzer. The mechanical stability of m-CVP beads was measured according to the procedure reported in the literature.22 The m-CVP beads (m1) were added to 100 mL deionized water, and after 24 h of shaking at 250 rpm in a mechanical shaker, the granules were filtered and dried at 50 °C for 24 h to obtain the remaining weight (m2). The stability of the m-CVP bead was calculated from m2/m1 × 100%. The water absorption of the prepared beads was determined in distilled water from room temperature to 55 °C. The dried beads were first weighed (W0), and then were fully immersed in a beaker filled with distilled water. At regular time intervals, the beads were taken out and weighed (W1) after their surface water droplets were dried by a tissue. The absorption was calculated using eqn (2):| |
 | (2) |
Deswelling of the beads was also determined with variation of temperature. First, the beads were weighed (W0) and were immersed in a beaker in distilled water at 55 °C. After equilibrium, the beads were taken out, dried with a tissue and weighed (W1) and the swelling was measured. Then, the beads transfer to the beaker again and the temperature was decreased to 45 °C, and remained at this temperature for 3 h to achieve equilibrium. The weight of the sample after drying with a tissue was determined. This process was repeated at 35 °C and at 25 °C and deswelling was determined.
For determination of solubility (%), the dried beads (m1) were immersed in a beaker filled with distilled water. After 24 h, the beads were dried in an oven at 60 °C and weighed again (m2). The percentage of solubility was calculated using eqn (3):
| |
 | (3) |
2.7. Dye and heavy metal adsorption experiments
Batch experiments were conducted to study the adsorption behavior of crystal violet (CV, a cationic dye), congo red (CR, an anionic azo dye) and Pb(II), Cu(II) and Cd(II), heavy metal ions, onto m-CVP beads in aqueous media. For determination of the optimum dosage of the adsorbent, the adsorption experiments were carried out using beads in the range 0.01–0.1 g (0.2–2 g L−1) in the solution of dyes and heavy metal ions (20 mg L−1), and the mixture was stirred at 200 rpm at 25 °C for a predetermined time. The effect of pH was studied in the range 2–6 and 2–8 for heavy metal ions and dyes, respectively. The pH of the initial solution was adjusted to the required pH value using either 0.1 M HNO3 or 0.1 M NaOH. Adsorption isotherms were studied with a constant dosage of beads (1 g L−1) and different initial concentrations of dye and heavy metal ions in the range 20–200 mg L−1. Adsorption kinetics was studied at a constant concentration with changing the contact time in the range 0.5–24 h. The effect of temperature on adsorption was carried out with 0.05 g beads in 50 mL dye and heavy metal ion solution (40 mg L−1 concentration) at different temperatures ranging from 25 to 55 °C. In this study, dye concentration was determined by a UV-vis spectrophotometer at a wavelength of 590 nm, maximum absorbance, for CV and 500 nm for CR. The concentration of heavy metal ions was determined with an atomic absorption spectrophotometer (nov AA 400p, Germany). The removal percentage (R, %) and the adsorption capacity (Qe, mg g−1) of the beads was calculated using the following equations| |
 | (4) |
| |
 | (5) |
where C0 and Ce (mg L−1) are the concentrations of dye and heavy metal ions in the initial solution and in the aqueous phase after adsorption, respectively, V is the volume of the aqueous phase (L) and m is the weight of adsorbent.
2.8. Desorption and reusability experiments
Desorption of CV adsorbed m-CVP beads was carried out in 100 mL ethanol for 9 h at room temperature while desorption of CR was investigated in 0.1 M NaOH solution. Desorption of heavy metal ion adsorbed m-CVP beads was carried out in 100 mL of 0.01 M HNO3 solution. After removal of beads from the desorption medium using an external magnet, the beads were washed with distilled water and dried at 60 °C and used for the subsequent runs. The adsorption–desorption cycles were repeated four times using the same adsorbents. To measure the probable leaching of Fe from m-CVP beads, 0.05 g adsorbent was added to 100 mL of 0.01 M HNO3 and the release of Fe ions was measured by atomic absorption spectrophotometer after 24, 48 and 72 h.
3. Results and discussion
3.1. Characterization of m-CVP beads
The detailed mechanistic scheme of synthesis of magnetic nanocomposite hydrogel beads (m-CVP) is shown in Fig. 1b. These hydrogel beads were prepared by instantaneous gelation of a mixture of PVA, CMS-g-PVI, and Fe3O4 nanoparticles in boric acid solution followed by crosslinking by glutaraldehyde. FT-IR spectra of m-CVP beads and the starting materials are presented in Fig. 2a and b. The spectrum of starch and CMS discloses broad absorption bands at 3420 cm−1, due to the stretching frequency of the OH group, at 2925 cm−1 due to the stretching vibration of C–H, and at 1018 cm−1 due to the C–O–C stretching vibration. In the spectrum of CMS two strong bands are observed at 1602 and 1422 cm−1 due to the carboxylate group which in this case is considered a clear indication that carboxymethylation of starch took place.23–25 In the spectrum of poly(N-vinyl imidazole) grafted onto CMS (CMS-g-PVI), absorption bands at 3116 cm−1 are attributed to the stretching vibrations of C![[double bond, length as m-dash]](https://www.rsc.org/images/entities/char_e001.gif) C–H and NC–H in the VI ring, at 2850 and 2928 cm−1 due to C–H stretching of CH and CH2 in the main chain and at 1497 and 1544 cm−1 due to C–C and N–C stretching.26
C–H and NC–H in the VI ring, at 2850 and 2928 cm−1 due to C–H stretching of CH and CH2 in the main chain and at 1497 and 1544 cm−1 due to C–C and N–C stretching.26
 |
| | Fig. 2 FTIR spectra of synthesized materials (panels a and b), and 1H NMR of CMS-g-PVI (panel c). | |
The bands centered at 760 and 660 cm−1 are assigned to a C–H ring bending vibration and C–N vibration of the azole ring, respectively.27 The 1H NMR spectrum of the CMS-g-PVI is shown in Fig. 2c. The obvious signals for grafting of PVI are presented in the region of 6.8–7.9 ppm, which is attributed to the hydrogen of the imidazole rings. The Hβ in the PVI main chains appeared at 2.4 ppm.28 Signals in the region of 3.5 to 4.5 were characterized to the Hα of PVI and protons of CMS.23,28 The characteristic absorption bands of PVI appeared in the FT-IR and 1H NMR spectrum of CMS-g-PVI, confirming that PVI has been successfully grafted onto the CMS. In the FT-IR spectrum of Fe3O4 (Fig. 2b), the absorption bands at around 653 cm−1 can be ascribed to the Fe–O stretching vibration of Fe3O4. In addition, the O–H stretching vibration around 3420 cm−1 and the O–H deformed vibration at 1633 cm−1 suggest that the surface of the nanoparticles is covered with OH groups.6 To verify the network structure m-CVP beads, the FT-IR spectrum of as-prepared m-CVP adsorbents (Fig. 2b) was compared to CMS-g-PVI, PVA and Fe3O4. The band observed between 3550 and 3200 cm−1 corresponds to the stretching of O–H from the intermolecular and intramolecular hydrogen bonds.13 The characteristic absorption bands of CMS-g-PVI are observed in the spectrum of m-CVP beads. Furthermore, vibration bands of PVA and or Fe3O4 nanoparticles have been verified in the IR-spectrum of m-CVP beads.
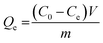
Fig. 3 shows both the macro and micro structures of m-CVP beads. In the right corner of Fig. 3a, a photo image of an m-CVP bead is shown, with a nearly spherical shape and an average diameter of 3 mm. The size of the beads depends on the agitating rate. To achieve the spherical uniform m-CVP beads, the coagulation bath must be agitated at a constant rate at 300 rpm. The size of spherical beads decreases with increasing the agitating rate. SEM was used to identify the micro-structure and surface morphology of the m-CVP beads. As shown in Fig. 3a and b, m-CVP beads have a highly porous and rough surface. The pore distribution and porosity of the beads seem similar to the results reported by other researchers for their materials.16,22,29 This porosity is indicative of magnetite nanoparticles being captured and well dispersed in spaces throughout the three-dimensional structure. The roughness of the surface should be considered as a factor providing an increase in the surface area. In addition, these pores reduce the mass transfer resistance and facilitate the diffusion of metal ions and dye molecules because of their high internal surface area. The measured specific surface area and average pore diameter of the m-CVP beads by the BET method were found to be 9.4382 m2 g−1 and 4.827 nm, respectively. The total pore volume was 0.0114 mL g−1. The higher specific surface areas and lower pore size were obtained for m-CVP beads compared to the value of 3.0973 m2 g−1 and 16.039 nm for Fe0–Fe3O4 nanocomposite embedded PVA/sodium alginate beads.30 The porosity based on a skeletal density of 0.5 g mL−1 was 0.0057 per gram of sample. Although Fe3O4 nanoparticles were not visible in SEM images, their morphology could be clearly observed in the TEM image of Fig. 3c. It can be seen that Fe3O4 nanoparticles are nearly spherical with an average diameter of 20 nm and are homogenously dispersed inside the polymer matrix, while some agglomeration is still observed. In addition, their existence in m-CVP beads was confirmed by EDX spectra in Fig. 3d, where typical iron peaks were detected. The weight percentage of Fe was 19.3%. The EDX image also gives information about other elements: C, O and N. They are the main elements in the m-CVP beads and originate from PVA and CMS-g-PVI components.
 |
| | Fig. 3 Digital photograph of a bead (right corner of panel a), SEM images of m-CVP beads (panel a: low magnification and panel b: high magnification), TEM image (panel c) and EDX patterns (panel d) of m-CVP beads. | |
The crystalline structures of Fe3O4 nanoparticles and m-CVP beads are shown by XRD patterns in Fig. 4a. The main signals of crystalline magnetic nanoparticles were recorded at 2θ = 30.15°, 35.55°, 43.1°, 56.97°, and 62.55°. These peaks were consistent with the results obtained by Zhou et al.16 At the same time, these characteristic XRD signals have also been detected from m-CVP hydrogel beads. According to the Debye–Scherrer equation, the naked Fe3O4 and Fe3O4 in m-CVP beads had an average diameter of 13 nm. These results indicated that the m-CVP beads have been prepared successfully without damaging the crystal structure of the Fe3O4 core. The magnetic properties of Fe3O4 and m-CVP were investigated by VSM and are illustrated in Fig. 4b. It is vitally important that the sorbents should possess sufficient magnetic and superparamagnetic properties. The saturation magnetization (σs) of m-CVP beads is (12.21 emu g−1), much lower than the saturation magnetization of Fe3O4 (65.43 emu g−1). In spite of the EDX results, which showed an almost 20% Fe presence in the m-CVP beads, this decrease (∼80%) in σs of m-CVP shows that Fe3O4 nanoparticles were deeply covered by the polymer chains of PVA and CMS-g-PVI. Similar results have also been reported in magnetic chitosan/PVA hydrogel beads.15 Furthermore, the coercivity and remanence of Fe3O4 and m-CVP beads tended to zero, Fig. 4b, indicating the superparamagnetic properties for naked Fe3O4 and m-CVP. The magnetic strength of the m-CVP beads is sufficient for separation in aqueous solution by a conventional external magnet, as shown in Fig. 4c. The effects of cross-linker (GA) concentration on the solubility and mechanical stability of the beads are shown in Table 1. According to the obtained results, the solubility of the beads decreased with increasing GA content. As can be seen in Table 1, when the concentration of GA is 25% of the total weight of the polymers, the beads still showed little solubility in water and 33 wt% GA was just enough to prevent the beads from dissolving in water. The m-CVP beads are water loving in nature and thus soluble in water if the crosslinking is marginal. However, they become a completely water insoluble material after suitable crosslinking. Thus, the crosslinking is necessary to enhance the chemical stability of beads in aqueous medium.
 |
| | Fig. 4 XRD patterns (panel a), VSM curves of Fe3O4 and m-CVP beads (panel b), and a photographic image of m-CVP bead separation by an external magnetic field (panel c). | |
Table 1 Effect of GA on the solubility and stability of m-CVP beads and Pb(II) adsorption
| GAa (%) |
Solubility (%) (STD)b |
Stability (%) (STD) |
Pb(II) adsorption (%) (STD) |
| With respect to total weight of polymers. Standard deviation. |
| 5 |
66.3 (11.6) |
— |
— |
| 15 |
19.4 (7.1) |
— |
— |
| 25 |
5.3 (1.9) |
88.2 (8.5) |
90.67 (7.0) |
| 33 |
Insoluble |
98.0 (2.5) |
88.40 (5.6) |
| 45 |
Insoluble |
99.1 (0.98) |
85.5 (7.1) |
The mechanical stability of beads is affected by GA content, as indicated in Table 1. The mechanical stability increased from 88.2% to 99.4% when concentration of GA increased from 25 wt% to 45 wt% GA. This can be due to the formation of a more dense and compact network with increasing GA content. The effect of GA concentration was also investigated on the removal percentage of Pb(II). Adsorption studies were carried out with 50 mL of 20 mg L−1 Pb(II) solution containing 50 mg of the adsorbent in each case. As shown in Table 1, the Pb(II) adsorption has decreased with increasing GA content. This decrease in the metal ion adsorption can be due to the decrease in the number of hydroxyl groups in the polymer chains that are active in the adsorption process, and also due to the compact network structure as a result of greater cross-link formation. Due to the obtained results of high adsorption capacity and enough stability and insolubility, m-CVP beads with 33 wt% GA as a cross-linker were used for further experiments. Therefore, these beads may also be suitable for column applications. The water absorption behavior of m-CVP beads was illustrated in Fig. 5a. Initially, swelling increases sharply with time up to a certain level, and then it begins to level off. The equilibrium water absorption of m-CVP beads is almost 130% after ∼2 h at 25 °C.
 |
| | Fig. 5 Swelling behavior (panel a) and the inset of panel (a) shows the equilibrium swelling and deswelling of m-CVP beads at different temperatures, and TGA curves of Fe3O4, PVA, CMS-g-PVI and m-CVP beads (panel b). | |
The high water absorption can be due to the highly porous and very hydrophilic structure of m-CVP components. As can be seen in Fig. 5a, the swelling reached equilibrium more quickly with increasing temperature from 25 to 55 °C. With increasing temperature, the dissociation of intermolecular interactions like hydrogen bonding between polymer chains increases water absorption. Moreover, equilibrium swelling and deswelling with temperature are shown in the inset graph of Fig. 5a. On decreasing the temperature from 55 to 25 °C, a gradual decreasing trend was observed. However, the slope of the lines of equilibrium swelling and deswelling was not the same. This shows that the absorbed water during swelling has not been removed after deswelling with temperature. The reason could be due to strong hydrogen bonding between water molecules and the hydrophilic structure of the m-CVP beads, which are not dissociated at the tested temperatures.
The m-CVP beads were subjected to TGA testing to study their thermal stability compared with that of CMS-g-PVI, PVA and Fe3O4. In the TGA curve (Fig. 5b), neat Fe3O4 showed a mass loss of about 2% at temperatures below 150 °C due to evaporation of the adsorbed moisture, and a weight loss of about 5% at temperatures around 400 °C due to decomposition of Fe3O4 to α-Fe2O3.31 The pure PVA showed mass loss of 10% below 150 °C due to evaporation of adsorbed water, and the major mass loss of ∼84% occurred in the temperature range 300–500 °C due to decomposition of polymer chain. The CMS-g-PVI copolymer also showed a 10% weight loss below 150 °C due to the evaporation of adsorbed water. Thermal decomposition of this copolymer starts at around 250 °C due to the loss of side groups initially, such as decarboxylation of CMS chains and then degradation of the main chain. However, the residue of this copolymer at 600 °C (∼42%) is much higher compared to PVA, indicating its higher thermal stability due to the presence of aromatic imidazole rings. Based on the information shown in Fig. 5b, there were two main weight loss steps in TGA curves of m-CVP beads: the first step is the elimination of adsorbed water at below 160 °C, and the second step pattern with ∼42% residue at 600 °C is similar to the TGA curve of CMS-g-PVI copolymer, associated with the degradation of PVA and CMS-g-PVI.15,16 However, m-CVP beads showed a higher thermal stability in the temperature range of 250–400 °C compared to a CMS-g-PVI copolymer, which can be due to the crosslinking and network structure in m-CVP beads.
3.2. Adsorption of dye and heavy metal ions
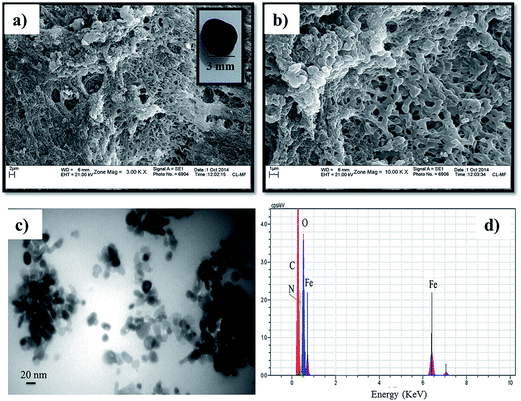
3.2.1. Effect of pH. The initial pH of the solution plays a key role in the adsorption process, because it influences the aqueous metal ion speciation, the adsorbent surface charge, and degree of ionization of the adsorbent during the desorption process.17 Fig. 6a and b shows the influence of pH on adsorption of different heavy metal ions and dyes. It was found that the adsorption of Cu(II), Pb(II) and Cd(II) was highly dependent on pH because pH affected the solubility of metal ions and the ionization state of the functional group (hydroxyl and imidazole groups) present on the m-CVP beads. Fig. 6a and b shows that the percentage removal of metal cations and CV dye increased with increase in pH. The further increase in pH for metal ions was restricted to prevent the formation of metal hydroxide. However, in the range of pH < 4 the adsorption of Cd(II), Pb(II) and Cu(II) and CV dye decreased rapidly. This shows that the acidic solution inhibits the metal cations and CV adsorption. This behavior can be explained on the basis of change in the surface charge of m-CVP beads. In acidic solution, the active groups of m-CVP such as imidazole and hydroxyl groups are protonated and competition between H+ and metal ions or cationic dye for adsorption sites led to little adsorption of heavy metal ions or CV. However, with increase of pH, deprotonation of the protonated groups takes place and the m-CVP surface charge became negative, which led to higher adsorption of cationic species. These results are in good agreement with those obtained for adsorption of Pb(II) on macroreticular PVA (MR-PVA) beads18 and adsorption of CV onto coniferous pinus bark powder.32 Therefore, solution pH was controlled at 5.5 for Pb(II), 6.0 for Cu(II) and Cd(II) and at 7.4 for CV in batch experiments. At optimum pH, the removal efficiencies (%R) for Cu(II), Pb(II), Cd(II) and CV dye were 95.4%, 88.46, 65.35% and 93.66%, respectively.
 |
| | Fig. 6 Effect of pH (panels a and b) and adsorbent dosage (panels c and d) on the adsorption of tested heavy metal ions and dye on the m-CVP beads. | |
Contrary to the CV dye, the removal of CR dye by m-CVP beads increased with decreasing pH from 8 to 5, and the best result was obtained at pH = 5 (it is noticeable that CR dye started to be insoluble in water and its color changed to blue at pH < 5). At pH 5, the removal efficiency for CR dye was 93.11%. The CR dye has anionic sulfonate groups in the molecule and, in acidic conditions, strong electrostatic attraction between the positively charged surface of m-CVP beads and –SO3− groups of the dye molecule led to enhanced CR adsorption. By increasing the pH, the de-protonation of imidazole rings and hydroxyl groups in the m-CVP beads led to the decrease of CR adsorption. Similar results were observed for the adsorption of CR dye using xanthan gum/silica hybrid nanocomposite33 and magnetic chitosan/poly(vinyl alcohol) hydrogel beads.15
3.2.2. Effect of adsorbent dosage. The effect of m-CVP bead dosage (0.2–2 g L−1) on the amount of the tested metal ions and dyes (50 mL, 20 mg L−1) was studied and the obtained results are shown in Fig. 6c and d. The result shows that the adsorption increased sharply with the increase in the adsorbent dosage and reached maximum values of 73.4%, 99.3%, 93.8%, 96.7% and 97.5% for Cd(II), Cu(II), Pb(II), CR and CV pollutants, respectively, at 2 g L−1 m-CVP bead. However, saturation occurred at 1 g L−1, at which further increase in dosage caused gradual increase in ion and dye adsorption. So, 1 g L−1 was selected as the optimum dosage for further adsorption experiments. The increase of adsorption with increasing sorbent mass can be ascribed to the increased surface area and the availability of more adsorption sites.
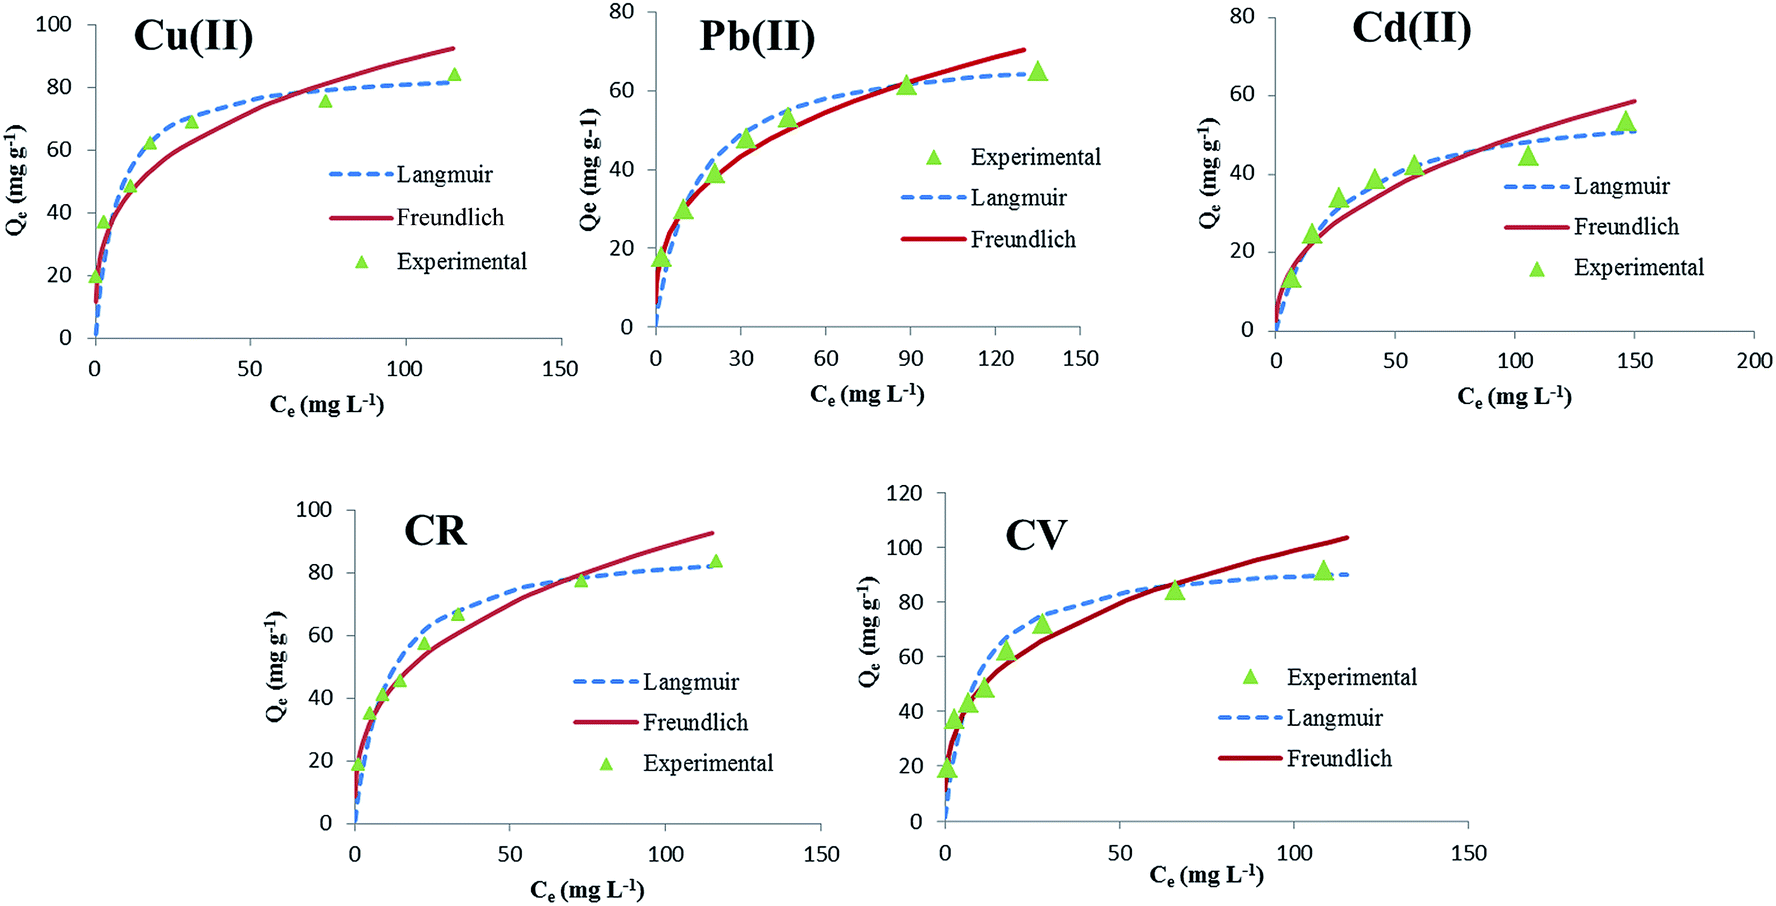
3.2.3. Sorption isotherms. The removal percentage at different concentrations of heavy metal ions and dyes (20–200 mg L−1), keeping all other parameters constant, is presented in Fig. 7a. As the initial concentration of Pb(II), Cu(II) and or Cd(II) heavy metal ions and CV and or CR dyes increased from 20 to 200 mg L−1, the removal percentage decreased. This reduction in adsorption efficiency can be due to the fact that the total existing adsorption sites on m-CVP beads are confined at high initial concentration, thus resulting in a decrease of percentage uptake. However, the adsorption capacity (Qe, mg g−1) increased when their initial concentrations have increased. The maximum adsorption capacity of Cu(II), Pb(II) and Cd(II) was determined as 83.6, 65.0, and 53.2 mg g−1, respectively. From the obtained results it was evident that Cu(II) exhibited strong affinity for m-CVP beads followed by Pb(II) and Cd(II) ions. These differences in adsorption may be related to the differences in the ionic radius and charge density. Cu(II) ions have a smaller ionic radius and a greater charge density than other tested metal ions, implying that the Cu(II) ion has a stronger attraction to the lone pair electrons in the nitrogen and oxygen atoms to form more stable complexes. Despite the larger molecules of CR dye in comparison with the CV molecules, the active functional groups of CR for adsorption are higher than those of CV. Therefore at the optimum conditions, the maximum adsorption of CR and CV by m-CVP beads was 91.6 mg g−1 and 83.7 mg g−1, respectively, indicating that m-CVP beads have good potential for removal of both cationic and anionic dyes.
 |
| | Fig. 7 Effect of initial concentration of tested heavy metal ions and dyes (panel a), and contact time (panel b) on adsorption. | |
The adsorption isotherm studies are of fundamental importance in determining the adsorption capacity of the beads to diagnose the nature of adsorption. The adsorption isotherm experimental data were fitted by Langmuir and Freundlich models. The Langmuir isotherm model assumes that adsorption sites are identical and energetically equivalent, and only monolayer adsorption occurs in the process.34 The Langmuir equation is expressed as follows:
| |
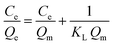 | (6) |
where
Qe (mg g
−1) and
Ce (mg L
−1) are the adsorption capacity and the residual concentration of tested dyes or heavy metal ions in solution at equilibrium, respectively;
Qm (mg g
−1) and
KL (L mg
−1) are the amount of species adsorbed at complete monolayer coverage and a constant related to the affinity of the binding sites, respectively;
Qm and
KL can be determined from the linear plot of
Ce/
Qe versus Ce.
The Freundlich model is an empirical equation that can be used to describe the multilayer adsorption equilibrium on a heterogeneous surface.35 It is mathematically described by eqn (7).
| |
 | (7) |
where
KF [(mg g
−1)(L mg
−1)
1/n] and
n are the Freundlich constants related to adsorption capacity and adsorption intensity.
KF and
n can be determined from the linear plot of ln
Qe versus ln
Ce. Experimental isotherms were determined at 25 °C and 50 mL of ion solution and 1 g L
−1 adsorbent with different concentrations of tested dyes and heavy metal ions.
The obtained isotherm parameters, Qm, KL, KF, n and the correlation coefficients (R2) are listed in Table 2. The R2 of the linear form of isotherm equations for tested dyes and heavy metal ions is much closer to unity for the Langmuir model than for the Freundlich model (Table 2), and also as shown in Fig. 8, the experimental data is better fitted to the Langmuir model. This confirms the monolayer adsorption of Cu(II), Pb(II) and Cd(II) heavy metal ions and CR and CV dye onto m-CVP beads. The theoretical monolayer capacities of m-CVP beads (Qm,cal) for selected dye and heavy metal ions were also close to that experimentally obtained (Table 2). The favorability of m-CVP beads as an adsorption medium for CV, CR, Cu(II), Pb(II) and Cd(II) can be obtained from the Langmuir adsorption constant KL; which is related to the separation factor “RL” defined as:36
| |
 | (8) |
where
C0 is the initial concentration of the pollutant.
Table 3 presents the calculated
RL values at different initial concentrations, which are in the range of 0.04–0.28 for CV, 0.06–0.33 for CR dye and in the range of 0.04–0.25 for Cu(
II), 0.06–0.40 for Pb(
II) and 0.13–0.54 for Cd(
II) adsorption on m-CVP beads. 0 <
RL < 1 indicates that m-CVP beads are a favorable medium for the adsorption of selected dyes and heavy metal ions. The results in
Table 2 also indicate that the equilibrium data is not fitted well to the Freundlich isotherm model (lower
R2 value).
Table 2 Isotherm parameters for CV, CR, Cu(II), Pb(II) and Cd(II) sorption onto m-CVP beads
| Pollutants |
Qm,exp (mg g−1) |
Langmuir model |
Freundlich model |
| Qm,cal (mg g−1) |
KL |
R2 |
KF |
n |
R2 |
| Cu(II) |
83.60 |
82.21 |
0.149 |
0.9950 |
22.850 |
3.390 |
0.9507 |
| Pb(II) |
65.00 |
70.92 |
0.074 |
0.9954 |
13.890 |
2.998 |
0.9833 |
| Cd(II) |
53.20 |
58.82 |
0.043 |
0.9877 |
7.126 |
2.378 |
0.9101 |
| CV |
91.58 |
96.15 |
0.129 |
0.9944 |
23.310 |
3.188 |
0.9681 |
| CR |
83.66 |
89.25 |
0.098 |
0.9945 |
18.840 |
2.981 |
0.9717 |
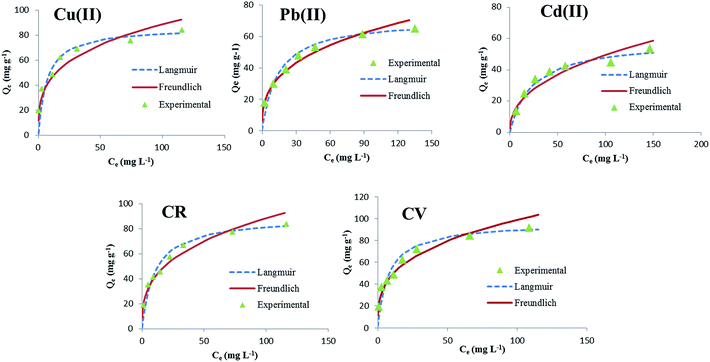 |
| | Fig. 8 The adsorption isotherms of tested metal ions and dyes (C0 = 20–200 mg L−1, adsorbent dosage = 1 g L−1, T = 25 °C, contact time = 24 h). | |
Table 3 Calculated RL values at different initial concentrations of tested dyes and metal ions
| C0 (mg L−1) |
RL |
| Cu(II) |
Pb(II) |
Cd(II) |
CV |
CR |
| 20 |
0.25 |
0.40 |
0.54 |
0.28 |
0.33 |
| 40 |
0.14 |
0.25 |
0.37 |
0.16 |
0.20 |
| 60 |
0.12 |
0.18 |
0.32 |
0.11 |
0.16 |
| 80 |
0.10 |
0.14 |
0.28 |
0.09 |
0.14 |
| 100 |
0.08 |
0.12 |
0.22 |
0.07 |
0.11 |
| 150 |
0.06 |
0.08 |
0.19 |
0.05 |
0.09 |
| 200 |
0.04 |
0.06 |
0.13 |
0.04 |
0.06 |
The adsorption capacity (Qm) for CV and CR dye and Cu(II), Pb(II) and Cd(II) ions on m-CVP beads were compared with those of other low cost adsorbents found in the literature (Table 4). It is obvious that the m-CVP beads have good adsorption capacity when compared with other adsorbents reported previously. Therefore, it can be concluded that m-CVP beads have good potential for the removal of cationic and anionic azo dyes and heavy metal ions from aqueous solutions.
Table 4 Comparison of CV, CR, Cu(II), Pb(II) and Cd(II) adsorption capacity on m-CVP beads with other adsorbents
| Adsorbent |
Qm (mg g−1) |
Ref. |
| CV |
CR |
Cu(II) |
Pb(II) |
Cd(II) |
| Magnetic starch-graft-poly(acrylic acid) nanocomposite hydrogels |
80.64 |
|
|
|
|
7 |
| Coniferous pinus bark powder (CPBP) |
32.78 |
|
|
|
|
32 |
| Treated ginger waste (TGW) |
64.93 |
|
|
|
|
37 |
| N,O-Carboxymethyl-chitosan/montmorillonite |
|
74.24 |
|
|
|
38 |
| Chitosan/montmorillonite nanocomposite |
|
54.52 |
|
|
|
39 |
| Xanthan gum/silica hybrid nanocomposite |
|
209.20 |
|
|
|
33 |
| Wool graft polyacrylamidoxime |
|
|
|
23.56 |
12.55 |
40 |
| Sporopollenin |
|
|
17.4 |
94.7 |
7.09 |
41 |
| Modified ABS |
|
|
56.18 |
56.50 |
53.47 |
42 |
| Poly(vinylalcohol)/chitosan beads |
|
|
98.77 |
98.61 |
70.16 |
43 |
| Clay (montmorillonite) |
|
|
|
31.1 |
30.7 |
44 |
| Chitosan–poly(vinyl alcohol) hydrogel adsorbent |
|
|
78.68 |
13.6 |
32.12 |
45 |
| m-CVP beads (our study) |
91.58 |
93.66 |
83.60 |
65.00 |
53.2 |
— |
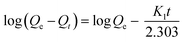
3.2.4. Sorption kinetics. In order to evaluate the adsorptive property of m-CVP beads, it is important to investigate the rate at which CV, CR, Cu(II), Pb(II) or Cd(II) is removed from aqueous solution. Fig. 7b shows the effect of contact time (0.5–24 h) on the adsorption capacity of m-CVP beads, the initial concentration of the tested dyes and metal ions was 20 mg L−1.Experimental results indicated that adsorption capacity of m-CVP beads increased with increasing contact time and equilibrium was reached after about 5 and 9 h for CV and CR dyes, 6 h for Cu(II) and 9 h for other tested heavy metal cations (Pb(II) and Cd(II)). Beyond these times few changes occurred in the adsorption. The equilibrium adsorption capacity was about 19.80 and 18.62 mg g−1 for CV and CR and 19.08, 17.66 and 13.07 mg g−1 for Cu(II), Pb(II) and Cd(II) adsorption on m-CVP beads after 24 h, respectively. The adsorption process consists of two stages: rapid stage at initial time of adsorption and a slow process as the second stage. Adsorption was fast initially because of the high concentration of ions and also the high number of free adsorptive sites. At a later stage, adsorption slowed down and reached an equilibrium level because of a decrease in the concentration and also exhaustion of the free adsorptive sites. Also, Zhu et al.15 found similar results when magnetic chitosan/poly(vinyl alcohol) hydrogel beads were used to remove congo red from aqueous solution. It is well known that different kinds of mechanisms such as chemical reaction and mass transfer can control the adsorption process. In order to investigate the mechanism controlling the adsorption process (physical or chemical mechanism), the commonly used kinetic models including the pseudo-first order eqn (9), pseudo-second order eqn (10), and intra-particle diffusion models eqn (11) were employed to evaluate the kinetics data. The pseudo-first order (the most reliable kinetics equation suitable only for the rapid initial phase, eqn (9)) and pseudo-second order (for predicting the kinetic behavior of chemical sorption as a rate controlling step, eqn (10)) models are expressed as:
| |
 | (9) |
| |
 | (10) |
where
Qe and
Qt are the adsorption capacity (mg g
−1) on the beads at equilibrium and at time
t, respectively;
K1 (min
−1) and
K2 (g mg
−1 min
−1) are the rate constants of the pseudo-first order and the pseudo-second order adsorption, respectively, which can be obtained from log(
Qe −
Qt)
versus t and
t/
Qt versus t.
23,37 Additionally, the initial adsorption rate,
h (mg g
−1 min
−1) can be determined from
K2 and
Qe values using
h =
K2Qe2. The intra-particle diffusion equation assumes that binding of contamination to the surface of the adsorbent is influenced by the mass transfer resistance and is described as:
where
C is the intercept (mg g
−1) and
kid (mg g
−1 min
−1.5) is the intra-particle diffusion rate constant, which can be evaluated from the slope of the linear plot of
Qt versus t0.5. The experimental data has been fitted to the kinetics models mentioned above. The pseudo-first order constants (
Qe1,cal,
K1 and
R2) for the tested dye and metal ion adsorption on m-CVP beads are presented in
Table 5. The theoretical
Qe values calculated from the first-order kinetic model (
Qe1,cal) did not agree with the experimental values (
Qe,exp), and the correlation coefficients were also found to be slightly lower. These results indicated that the pseudo-first order kinetic model was not appropriate for modeling the adsorption of CV and CR dye and Cu(
II), Pb(
II) and Cd(
II) metal ions on m-CVP beads.
Table 5 Kinetic parameters of CV, CR, Cu(II), Pb(II) and Cd(II) adsorption onto m-CVP beads
| Kinetic model |
Parameters |
CV |
CR |
Cu(II) |
Pb(II) |
Cd(II) |
| Pseudo-first-order |
Qe1,cal (mg g−1) |
8.23 |
14.36 |
6.08 |
13.98 |
11.56 |
| K1 (min−1) |
0.0041 |
0.0074 |
0.3530 |
0.0032 |
0.0030 |
| R2 |
0.9614 |
0.9777 |
0.8573 |
0.9703 |
0.9558 |
| Pseudo-second-order |
Qe2,cal (mg g−1) |
20.44 |
19.38 |
20.12 |
20.41 |
15.90 |
| Qe,exp (mg g−1) |
19.80 |
18.62 |
19.08 |
17.66 |
13.07 |
| K2 (g mg−1 min−1) |
0.0012 |
0.0011 |
0.0008 |
0.0002 |
0.0002 |
| h (mg g−1 min−1) |
0.4704 |
0.4047 |
0.3138 |
0.0624 |
0.0381 |
| R2 |
0.9999 |
0.9995 |
0.9966 |
0.9964 |
0.9890 |
| Intra-particle diffusion |
kid (mg g−1 min−1.5) |
0.3184 |
0.3078 |
0.3057 |
0.4295 |
0.3485 |
| C (mg g−1) |
10.153 |
9.3648 |
9.7809 |
3.4592 |
1.3802 |
| R2 |
0.7310 |
0.7676 |
0.5879 |
0.8725 |
0.9012 |
According to the results listed in Table 5, the values of R2 for the pseudo-second-order kinetic model were much closer to unity for m-CVP beads as an adsorbent. The adsorption capacities calculated from the pseudo-second-order model (Qe2,cal) were also close to those determined by experiments (Qe,exp). The pseudo-second-order model is based on the assumption that the rate-determining step may be a chemical sorption involving valence forces through sharing or exchange of electrons between adsorbent and sorbate.42,46 The h and K2 values calculated from the pseudo-second-order kinetic model were higher for CV than those obtained for the CR dye, and for heavy metal ions, Cu(II) had the highest value. This indicated that the adsorption of CV and Cu(II) onto m-CVP beads was much faster than adsorption of CR and Pb(II) or Cd(II) ions. Among the mentioned models, the intra-particle diffusion model showed a poor fit to the experimental data, revealing that the intra-particle diffusion was not the rate-limiting step in the adsorption.
3.2.5. Adsorption thermodynamics. For investigating the effect of temperature, adsorption experiments were performed at 25, 35, 45 and 55 °C using 50 mL of 40 mg L−1 pollutant solution. The results (Fig. 9a and b) showed that the removal and sorption capacity increased with increasing temperature. This may be due to the increase in mobility of the large dye molecules and heavy metal ions with temperature. As the temperature increases, the number of molecules requiring sufficient energy to undergo an interaction with active sites at the surface also increases.47,48 Furthermore, according to Fig. 5a, increasing temperature produced a swelling effect within the internal structure of the adsorbent, enabling more dye and metal ions to penetrate further. Increase of adsorption due to temperature indicates that the adsorption process was endothermic in nature. Similar endothermic nature of adsorption was observed by using magnetic chitosan/poly(vinyl alcohol) hydrogel beads.15 The thermodynamic parameters such as Gibbs free energy change (ΔG0), standard enthalpy change (ΔH0), and standard entropy change (ΔS0) were also studied to understand better the effect of temperature on the adsorption.41 Gibbs free energy (ΔG0) is calculated by using equilibrium constant (KL) from eqn (12).| | |
ΔG0 = −RTlnKL
| (12) |
 |
| | Fig. 9 Effect of adsorption temperature on tested heavy metal ion and dye removal (panels a and b), and reusability of m-CVP beads during four cycles (panel c). | |
ΔH0 and ΔS0 of adsorption can be estimated from the Van’t Hoff equation (eqn (13))
| |
 | (13) |
where
KL is the ratio of concentration of CV, CR, Cu(
II), Pb(
II) or Cd(
II) adsorbed by the adsorbent to their remaining concentration in solution at equilibrium (
Ce). The slope and intercept of the plot of ln
KL versus 1/
T give Δ
H0 and Δ
S0, respectively, and the obtained data are listed in
Table 6. Δ
G0 values found here are negative for adsorption of the tested dyes and metal ions on m-CVP beads (
Table 6). This indicates that the adsorption process is thermodynamically feasible and spontaneous at room temperature. Moreover, the Δ
G0 values decreased with an increase in temperature, indicating an increased trend in the degree of spontaneity and feasibility of adsorption of the dyes or metal cations onto m-CVP beads. Generally, the change in adsorption enthalpy for chemisorption is in the range of 5.0–100.0 kcal mol
−1 (20.9–418.4 kJ mol
−1).
39 The adsorption enthalpy change (Δ
H0) was calculated to be 36.48, 35.54 kJ mol
−1 for CV and CR dyes and 47.25, 36.85 and 14.90 kJ mol
−1 for Cu(
II), Pb(
II) and Cd(
II) adsorption onto m-CVP beads, respectively. The positive values of the change in enthalpy suggest that the adsorption is chemisorption in nature. Furthermore, positive Δ
S0 of the adsorption process indicates an irregular increase of the randomness at the m-CVP bead–solution interface during adsorption.
Table 6 Thermodynamic parameters for adsorption of CV, CR, Cu(II), Pb(II) and Cd(II) on m-CVP beads
| Pollutants |
ΔH0 (kJ mol−1) |
ΔS0 (J mol−1 K−1) |
−ΔG0 (kJ mol−1) |
| 25 °C |
35 °C |
45 °C |
55 °C |
| Cu(II) |
47.252 |
177.695 |
5.937 |
7.023 |
9.451 |
11.064 |
| Pb(II) |
36.855 |
137.913 |
4.518 |
5.558 |
6.200 |
8.973 |
| Cd(II) |
14.903 |
53.683 |
1.139 |
1.582 |
2.121 |
2.757 |
| CV |
36.476 |
142.718 |
6.283 |
7.465 |
8.163 |
10.871 |
| CR |
35.540 |
134.753 |
4.870 |
5.676 |
7.064 |
8.945 |
3.2.6. Reusability of adsorbents. The reusability of adsorbents after a particular process is one of the most important properties for environmental and economic reasons. Therefore the desorption–adsorption cycles were performed to investigate the potential of m-CVP beads for applications. In this study, ethanol and alkaline environment (0.1 M sodium hydroxide) solution were used as desorption media for CV and CR dye, respectively. Desorption of adsorbed Cu(II), Pb(II) and Cd(II) was carried out using nitric acid solution and the reusability was evaluated four times as shown in Fig. 9c. It can be found from this figure that removal of pollutants was not much affected. Therefore, m-CVP beads can be used several times for water pollution remediation. The leaching of Fe ions from m-CVP beads after several reuses in 100 mL of 0.01 M HNO3 solutions was investigated. The amount of released Fe ions was only 2.823 ± 0.121, 4.831 ± 0.369 and 5.345 ± 0.350 mg L−1 after 24, 48 and 72 h exposure, respectively. Moreover, the feasibility of recycling of m-CVP beads from wastewater using a magnetic field, as shown in Fig. 4c, can prevent the secondary pollution in wastewater treatment. These results indicate that m-CVP beads are suitable for dye and heavy metal ion removal from wastewater for industrial applications.
4. Conclusions
Novel magnetic nanocomposite hydrogel (m-CVP) beads were prepared by instantaneous gelation of carboxymethyl starch-g-polyvinyl imidazole (CMS-g-PVI), poly(vinyl alcohol) (PVA), and Fe3O4 mixture in boric acid followed by crosslinking by glutaraldehyde (GA). The characterization of m-CVP beads indicated that Fe3O4 nanoparticles have been introduced successfully in the crosslinked hydrogel beads. The saturation magnetization of m-CVP beads was enough for separation of the adsorbent from solution after adsorption. The adsorption of CR and CV dye or Cu(II), Pb(II) and Cd(II) ions onto m-CVP agreed well with the pseudo second order kinetic model. The chemisorption process was spontaneous and endothermic. The experimental adsorption isotherm data were fitted to the Langmuir model with maximum adsorption capacity of 91.58 and 83.66 mg g−1 for CV and CR dye and 83.60, 65.00, and 53.20 mg g−1 for Cu(II), Pb(II) and Cd(II) adsorbed m-CVP beads, respectively. This work will be helpful in the development of high capacity magnetic bioadsorbents with convenient recovery.
Notes and references
- G. Crini, Prog. Polym. Sci., 2005, 30, 38–70 CrossRef CAS PubMed.
- P. Daraei, S. S. Madaeni, E. Salehi, N. Ghaemi, H. S. Ghari, M. A. Khadivi and E. Rostami, J. Membr. Sci., 2013, 436, 97–108 CrossRef CAS PubMed.
- K. Dutta, S. Mukhopadhyay, S. Bhattacharjee and B. Chaudhuri, J. Hazard. Mater., 2001, 84, 57–71 CrossRef CAS.
- S. S. Moghaddam, M. A. Moghaddam and M. Arami, J. Hazard. Mater., 2010, 175, 651–657 CrossRef PubMed.
- Y. Gao, X. Pu, D. Zhang, G. Ding, X. Shao and J. Ma, Carbon, 2012, 50, 4093–4101 CrossRef CAS PubMed.
- S. Zhang, Y. Zhang, J. Liu, Q. Xu, H. Xiao, X. Wang and J. Zhou, Chem. Eng. J., 2013, 226, 30–38 CrossRef CAS PubMed.
- A. Pourjavadi, S. H. Hosseini, F. Seidi and R. Soleyman, Polym. Int., 2013, 62, 1038–1044 CrossRef CAS PubMed.
- J. Cao, Y. Tan, Y. Che and H. Xin, Bioresour. Technol., 2010, 101, 2558–2561 CrossRef CAS PubMed.
- L. Huang, C. Xiao and B. Chen, J. Hazard. Mater., 2011, 192, 832–836 CrossRef CAS PubMed.
- A. Masoumi and M. Ghaemy, Carbohydr. Polym., 2014, 108, 206–215 CrossRef CAS PubMed.
- P. Lanthong, R. Nuisin and S. Kiatkamjornwong, Carbohydr. Polym., 2006, 66, 229–245 CrossRef CAS PubMed.
- G. Crini, Bioresour. Technol., 2006, 97, 1061–1085 CrossRef CAS PubMed.
- G. Xie, X. Shang, R. Liu, J. Hu and S. Liao, Carbohydr. Polym., 2011, 84, 430–438 CrossRef CAS PubMed.
- K. Kumar, B. P. Tripathi and V. K. Shahi, J. Hazard. Mater., 2009, 172, 1041–1048 CrossRef PubMed.
- H. Y. Zhu, Y. Q. Fu, R. Jiang, J. Yao, L. Xiao and G. M. Zeng, Bioresour. Technol., 2012, 105, 24–30 CrossRef CAS PubMed.
- Y. Zhou, S. Fu, L. Zhang, H. Zhan and M. V. Levit, Carbohydr. Polym., 2014, 101, 75–82 CrossRef CAS PubMed.
- Y. Zhu, J. Hu and J. Wang, Prog. Nucl. Energy, 2014, 71, 172–178 CrossRef CAS PubMed.
- Y. Zhang, Y. Li, X. Li, L. Yang, X. Bai, Z. Yeb, L. Zhoua and L. Wang, J. Hazard. Mater., 2010, 181, 898–907 CrossRef CAS PubMed.
- L. T. Sin, S. T. Bee, T. T. Tee, A. A. H. Kadhum, C. Ma, A. R. Rahmat and P. Veerasamy, Carbohydr. Polym., 2013, 98, 1281–1287 CrossRef CAS PubMed.
- M. I. Khalil, A. Hashem and A. Hebeish, Starch-Stärke, 1990, 42, 60–63 CrossRef CAS PubMed.
- X. Liu, Z. Ma, J. Xing and H. Liu, J. Magn. Magn. Mater., 2004, 270, 1–6 CrossRef CAS PubMed.
- H. X. Wu, T. J. Wang, L. Chen, Y. Jin, Y. Zhang and X. M. Dou, Powder Technol., 2011, 209, 92–97 CrossRef CAS PubMed.
- S. Komulainen, C. Verlackt, J. Pursiainen and M. Lajunen, Carbohydr. Polym., 2013, 93, 73–80 CrossRef CAS PubMed.
- X. Chen, Y. He, C. Shi, W. Fu, S. Bi, Z. Wang and L. Chen, J. Membr. Sci., 2014, 469, 447–457 CrossRef CAS PubMed.
- Y. He, X. Chen, S. Bi, W. Fu, C. Shi and L. Chen, React. Funct. Polym., 2014, 74, 58–66 CrossRef CAS PubMed.
- A. Kara, L. Uzun, N. Beşirli and A. Denizli, J. Hazard. Mater., 2004, 106, 93–99 CrossRef CAS PubMed.
- Z. Ajji and A. M. Ali, J. Hazard. Mater., 2010, 173, 71–74 CrossRef CAS PubMed.
- B. B. Dambatta, J. R. Ebdon and T. N. Huckerby, Eur. Polym. J., 1984, 20, 645–652 CrossRef CAS.
- J. Lee and M. H. Cho, Korean J. Chem. Eng., 2010, 27, 193–197 CrossRef CAS.
- X. Lv, G. Jiang, X. Xue, D. Wu, T. Sheng, C. Sun and X. Xu, J. Hazard. Mater., 2013, 262, 748–758 CrossRef CAS PubMed.
- O. Philippova, A. Barabanova, V. Molchanov and A. Khokhlov, Eur. Polym. J., 2011, 47, 542–559 CrossRef CAS PubMed.
- R. Ahmad, J. Hazard. Mater., 2009, 171, 767–773 CrossRef CAS PubMed.
- S. Ghorai, A. K. Sarkar, A. B. Panda and S. Pal, Bioresour. Technol., 2013, 144, 485–491 CrossRef CAS PubMed.
- I. Langmuir, J. Am. Chem. Soc., 1918, 40, 1361–1403 CrossRef CAS.
- H. Freundlich, Trans. Faraday Soc., 1932, 28, 195–201 RSC.
- M. K. Sureshkumar, D. Das, M. B. Mallia and P. C. Gupta, J. Hazard. Mater., 2010, 184, 65–72 CrossRef CAS PubMed.
- R. Kumar and R. Ahmad, Desalination, 2011, 265, 112–118 CrossRef CAS PubMed.
- L. Wang and A. Wang, Chem. Eng. J., 2008, 143, 43–50 CrossRef CAS PubMed.
- L. Wang and A. Q. Wang, J. Hazard. Mater., 2007, 147, 979–985 CrossRef CAS PubMed.
- C. Cao, H. Kang, N. Che, Z. Liu, P. Li, C. Zhang, W. Li, R. Liu and Y. Huang, RSC Adv., 2014, 4, 60609–60616 RSC.
- N. Ünlü and M. Ersoz, Sep. Purif. Technol., 2007, 52, 461–469 CrossRef PubMed.
- A. Masoumi, K. Hemmati and M. Ghaemy, RSC Adv., 2015, 5, 1735–1744 RSC.
- X. Li, Y. Li and Z. Ye, Chem. Eng. J., 2011, 178, 60–68 CrossRef CAS PubMed.
- S. S. Gupta and K. G. Bhattacharyy, J. Environ. Manage., 2008, 87, 46–58 CrossRef CAS PubMed.
- X. Wang, W. Deng, Y. Xie and C. Wang, Chem. Eng. J., 2013, 228, 232–242 CrossRef CAS PubMed.
- G. Bayramoglu, B. Altintas and M. Y. Arica, Chem. Eng. J., 2009, 152, 339–346 CrossRef CAS PubMed.
- L. Wang, J. Zhang and A. Wang, Colloids Surf., A, 2008, 322, 47–53 CrossRef CAS PubMed.
- R. Dash and P. Mishra, J. Hazard. Mater., 2010, 112, 269–278 Search PubMed.
|
| This journal is © The Royal Society of Chemistry 2015 |
Click here to see how this site uses Cookies. View our privacy policy here.