Interaction of SO2 with a Cu–Mn oxide oxygen carrier during chemical looping with oxygen uncoupling†
Received
22nd September 2023
, Accepted 21st December 2023
First published on 10th January 2024
Abstract
Chemical looping with oxygen uncoupling (CLOU) is a variant of the chemical looping combustion (CLC) process, where fuel combustion occurs via metal oxides, known as oxygen carriers. The purpose of this study is to investigate how SO2 interacts with a Cu–Mn oxide oxygen carrier during CH4 combustion in the CLOU process. The oxygen carrier was reduced via CH4–N2 gas mixture with and without SO2 in a batch fluidized-bed reactor. The results indicate that SO2 does not affect the oxygen release capacity of a Cu–Mn oxide. However, it negatively affects the CH4 conversion by increasing CO formation as well as the unreacted CH4 amount. This adverse effect becomes more pronounced as the SO2 concentration increases. Increasing the temperature from 850 to 950 °C improves the conversion of CH4. During a reduction cycle, SO2 oxidizes to SO3, creating a competing demand for oxygen between fuel and SO2, and lowers CH4 conversion if there is not enough oxygen for both reactions. Hence, decreasing the feed CH4 concentration with a fixed oxygen carrier amount improves CH4 conversion in the presence of SO2. Additionally, characterization of SO2-exposed oxygen carriers shows that sulfate species form on the surface, possibly causing a further reduction in CH4 conversion. However, the presence of SO2 does not cause a permanent deactivation of the particles and they can be fully regenerated during the oxidation cycle.
Introduction
Fossil-fuel combustion accounts for about 60% of total electricity in the U.S. despite increased renewable energy resources.1 Burning fossil fuels generates a considerable amount of CO2, a significant greenhouse gas. Carbon capture and storage (CCS) is a promising technology to limit CO2 concentration in the atmosphere. Since a high purity CO2 stream is essential to ensure the economic viability of CCS technologies, several carbon-capture methods have been proposed and investigated in recent years.2–5 Of these methods, chemical looping combustion (CLC) is a promising technology because of its inherent ability to produce N2-free CO2 during fuel combustion while bypassing an expensive gas separation method. In CLC, fuel oxidation occurs via a metal oxide, also referred to as an oxygen carrier, instead of air, viareaction (R1), therefore avoiding direct contact between fuel and air. As a result, after steam condensation, a highly concentrated CO2 stream is obtained. The reduced oxygen carrier is regenerated by air via(R2) before being transferred back to the fuel reactor.6–12| |  | (R1) |
| |  | (R2) |
| |  | (R4) |
The oxidation by which a metal oxide's lattice oxygen reacts with the fuel is the primary distinguishable characteristic of chemical looping technologies. This phenomenon may occur in two ways: i) surface reactions between the fuel and lattice oxygen, (R1), and ii) reaction with gaseous oxygen, (R4), from metal oxide decomposition, (R3), at suitable temperature and oxygen partial pressures. The latter mechanism, where fuel reacts with gaseous oxygen like the traditional combustion reaction, is commonly referred to as chemical looping with oxygen uncoupling (CLOU). The CLOU mechanism is particularly beneficial for solid fuel utilization due to a faster gas–solid reaction rate relative to a solid–solid reaction in CLC.7,13–22
Early CLOU research identified monometallic CuO/Cu2O, Mn2O3/Mn3O4 oxide-systems as suitable CLOU oxygen carriers. However, these oxides have some limitations like sintering of copper oxides and slow oxidation kinetics of Mn3O4 to Mn2O3.23 Therefore, to overcome this limitation, copper and manganese oxides are combined with inert oxides such as TiO2, ZrO2, SiO2, or active metal oxides such as NiO, CaO, and Fe2O3.14,24–27 One such oxygen carrier is bimetallic Cu–Mn oxide, which utilizes the oxygen uncoupling characteristics of CuO and Mn2O3 and negates the disadvantages of constituent oxides.28 It transitions between spinel CuxMn3−xO4 and CuMnO2 during oxygen uncoupling that provides a considerable amount of gaseous O2 that results in high reactivity with the fuel. Furthermore, CuMnO2 can also react with the fuel via heterogeneous reactions (CLC) to form Cu and MnO.29–31 Previous studies employing a Cu–Mn oxide achieved high combustion efficiency for both solid and gaseous fuels.28,32–37 However, the investigations mainly involved sulfur-free or low-sulfur fuels to highlight the redox reactivity of the oxygen carrier. Although one study tested high-sulfur coal (5.2 wt% S) with a Cu–Mn oxygen carrier, it did not investigate the potential impact that sulfur contamination may have on the carrier.38 Given the variable presence of sulfur in fuels such as coal (200–10![[thin space (1/6-em)]](https://www.rsc.org/images/entities/char_2009.gif) 000 ppm H2S in coal-derived synthesis gas) and natural gas (up to 20 ppm H2S), the oxygen carrier will most likely be exposed to sulfur-containing species in the fuel reactor.39,40
000 ppm H2S in coal-derived synthesis gas) and natural gas (up to 20 ppm H2S), the oxygen carrier will most likely be exposed to sulfur-containing species in the fuel reactor.39,40
Sulfur is found in coal in various forms, including sulfides, sulfates, and organic sulfur compounds and most part of the coal-S is released during combustion from sulfides and organic bound sulfur.41 At temperatures higher than 1000 °C and oxygen-rich conditions, SO2 is the thermodynamically favored species. H2S can be formed in the gas phase or released from coal-S under sub-stiochiometric conditions. At lower temperatures, the equilibrium shifts towards SO3 and typically 0.1 to 1% of the SO2 is oxidized to SO3 during air combustion viareactions (R5)–(R7) in the gas phase.42
| | | HOSO2 + O2 → SO3 + HO2 | (R7) |
SO
3 formation is influenced by the temperature profile, residence time, concentrations of SO
2 and O
2, fly ash composition and presence of catalysts
e.g. Fe
2O
3.
43 In the CLOU process, with the presence of the oxygen carrier acting as an oxidizing catalyst, SO
2 could be oxidized to SO
3 heterogeneously. Due to the likelihood of the interactions of sulfur species and the oxygen carrier, understanding how sulfur species affect the oxygen carrier's performance is crucial to developing the chemical looping technology. Nevertheless, studies looking into the impacts of sulfur on Cu and Mn-based oxygen carriers during the CLOU process are limited. A study investigating high-sulfur lignite combustion in a continuous CLOU reactor with CuO–MgAl
2O
4 observed SO
2 as the major sulfur species in the effluent. In this study, the sulfur mass balance closure was ∼80 wt%, with the rest remaining unaccounted. The authors assumed that the remaining sulfur was accumulated on the oxygen carrier; however, they did not observe a decrease in the reactivity of the oxygen carrier due to the presence of sulfur.
44 In a similar CLOU study with a Cu-based oxygen carrier (CuO–Fe
2O
3–MgAl
2O
4), SO
2 was also observed as the final sulfur product.
45 They observed no decrease in the reactivity of the oxygen carrier when exposed to sulfurous fuel; however, the oxygen uncoupling capacity decreased ∼10% after 35 hours of operation. Around 15 wt% of the total sulfur was unaccounted for in the sulfur mass balance. Through a controlled TGA study followed by SEM-EDX analysis, (CuO)·(CuSO
4) formation was observed at 930 °C even though it is thermodynamically unstable above 700 °C. The authors speculated that combination of different oxides in the oxygen carrier causes a synergic effect making its reaction affinity with SO
2 different from those of the individual oxides.
45 Besides Cu-based oxides, a study with a Mn–Si oxide investigated sulfur effects by introducing 5000 ppm SO
2 with CH
4.
46 The oxygen carrier displayed no appreciable decrease in reactivity or oxygen uncoupling capacity at a maximum exposure of 5000 ppm SO
2.
On the other hand, Cu and Mn-based oxides tend to form sulfides in the CLC process depending on the operating conditions.39,47–51 For Cu-based oxygen carriers, thermodynamic calculations show that the possibility of sulfide formation is high at oxygen-deficient conditions, while it is less likely to form at oxygen-rich conditions. For a Mn-based oxide, MnSO4 formation is thermodynamically possible at both oxygen-deficient and rich conditions.49 A CLOU fuel reactor usually operates in an oxygen-rich environment which decreases the possibility of sulfide formation.52 However, local regions with high reducing potentials may promote sulfide formation.
Given the prospects of Cu–Mn oxide as an oxygen carrier in CLOU and the potential probability of sulfur interaction with constituent elements, it is necessary to examine the influence of sulfur on this oxygen carrier. Therefore, the objective of this study is to evaluate how sulfur affects the Cu–Mn oxygen carrier in a CLOU process. The study simulates coal combustion in a CLOU process by introducing CH4 as fuel since it is released during the volatilization stage of coal combustion. Since SO2 is the major sulfur species formed during solid fuel combustion in CLOU,45 it was added as a sulfur impurity. Effects of SO2 on the oxygen carrier's reactivity with CH4 was investigated in a laboratory-scale fluidized bed reactor. Finally, Cu–Mn oxygen carrier particles were characterized before and after SO2 exposure to determine its interaction with SO2.
Experimental
Materials
The bi-metallic Cu–Mn oxide, synthesized by the incipient wetness impregnation method,53 consists of 34 wt% CuO and 66 wt% Mn3O4. Before impregnation, Mn3O4 was mixed with graphite (5 wt% of Mn3O4) and sintered at 950 °C for one hour. A certain amount of copper nitrate solution (60–80 °C) corresponding to the pore volume of Mn3O4 was added to the sintered particles. The impregnated samples were dried at 70 °C overnight and were calcined at 600 °C in an air atmosphere for two hours. The desired loading was achieved by successive 3–4 impregnation steps followed by drying and calcination. Finally, the particles were heated at 950 °C for 6 hours at 10 °C min−1 and sieved to a size of 150–300 μm. The final oxygen carrier obtained is referred to as Cu34Mn66 in this study.
Characterization of the oxygen carrier
The powder X-ray diffraction (XRD) method (Rigaku Ultima-III; 30 kV and 40 mA) with Cu-Kα radiation was used to determine the crystalline structure of the oxygen carrier. The pattern was collected in the range of 10 to 90°. The X-ray photoelectron spectroscopy (XPS) analysis was conducted with an AXIS Supra by Kratos Analytical (300 W, 20 mA) equipped with a hemispherical electron analyzer and monochromatic Al-Kα source to analyze the surface chemical composition. Survey and high-resolution spectra of elements were acquired with 160 and 40 eV pass energies, respectively. The binding energies were calculated referencing the C 1s peak energy of 284.8 eV. Temperature programmed reduction (TPR) via hydrogen was performed using a Micromeritics 3Flex Surface and Catalyst Analyzer. A 10% H2/Ar mixture of 30 ml min−1 flow rate was used to reduce 60 mg particles. Before reduction, particles were pretreated at 200 °C in N2 for 1 hour, then cooled to 50 °C. The temperature was ramped up to 800 °C at a heating rate of 10 °C min−1. Isopropanol and liquid N2 slurry were used to condense the water formed during the process. A thermal conductivity detector (TCD) was used to measure the H2 consumption signal. Thermogravimetric analysis (TGA) was utilized to determine the oxygen release capacity of Cu34Mn66 particles. Netzsch TG 209 F1 Libra was used to analyze the oxygen release capacity at the following isothermal conditions: 850 °C, 900 °C, and 950 °C. Around 7–9 mg sample was reduced in N2 and oxidized in air at a 180 ml min−1 flow rate. The oxygen uncoupling capacity (Ro) was determined using eqn (E1):| | | Ro = (mox − mred)/mox | (E1) |
Here mox is the weight of the fully oxidized sample and mred is the weight of the reduced sample in TGA.
Experimental set-up
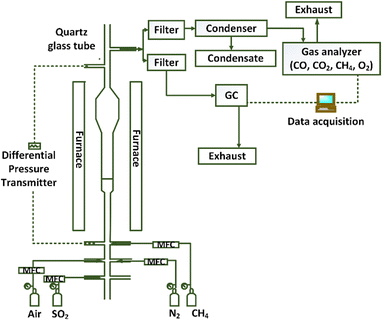
A quartz fluidized bed reactor was used to investigate the reactivity of the oxygen carrier with CH4 in the presence of SO2 at CLOU conditions. The experimental set-up simulates the gas–solid contact conditions relevant for a large-scale chemical looping combustion process. Instead of two separate reactors, fuel and air feeds into a single reactor are alternated to create the reduction and oxidation environments in a batch manner. Fig. 1 presents the schematic of the experimental set-up used in this work.
 |
| | Fig. 1 Schematic of the experimental set-up. | |
The reactor has a 2 cm inner diameter at the lower section and a 2.5 cm inner diameter section at the top. The increase in diameter at the top section lowers the gas velocity to prevent the smaller particles to leave the reactor. A porous quartz disc inside the reactor supports the particles and allows the gas to flow through the particle bed. A Thermcraft furnace surrounds the reactor to heat it up to the desired temperature. An Omega PX-409 differential pressure transducer measures the pressure fluctuations across the reactor bed and the quartz disc, indicating the fluidization behavior of the particles. For all the experiments, the Cu34Mn66 oxygen carrier inventory was 4 g to ensure there is enough oxygen released for fuel conversion. Experiments were performed at various conditions by changing the temperature and concentrations of CH4 and SO2 as shown in the test matrix in Table 1. All the experiments were repeated three times to ensure the reproducibility. Each cycle consisted of a reduction–purge–oxidation pattern. Reduction of the oxygen carrier occurred via a reducing mixture of either CH4–N2 or CH4–SO2–N2 at a flowrate of 600 ml min−1. Duration of the reduction period was 1 minute for most of the cases. After the reduction cycle, inert N2 was flowed through the reactor for around 1 minute to purge the reactor, followed by 700 ml min−1 air flow to reoxidize the particles. The selected reduction and oxidation flow rates, respectively, correspond to about 2–8 and 2–9 times the theoretical minimum fluidization velocity (Umf). The Umf value is calculated according to the correlations of Kunii and Levenspiel.54 Flue gas species (CO, CO2, CH4, and O2) were analyzed at a dry basis by a continuous Rosemount X-stream enhanced analyzer to obtain the reduction profiles for each cycle. H2 and S species were measured on a wet basis by a gas chromatograph (SRI MG#5 GC); therefore, eliminating the possibility of losing sulfur in condensed water. With a GC, the analysis of each sample takes 8 minutes, which makes it impossible to obtain a continuous profile of SO2 in a single experiment. Therefore, fresh particles were exposed to different reduction periods in separate experiments to obtain the SO2 concentration profile against time for a certain cycle. The GC data was collected at the end of each reducing period. So, each data point shown in the concentration profiles presented in the results section represents data from a separate experiment. For the experiments conducted to obtain the SO2 concentration profiles, the reduction cycle was extended to 8 minutes, instead of 1 min, to see if prolonged exposure to SO2 results in sulfur accumulation on the oxygen carrier. Additionally, the salt method was employed to qualitatively detect SO3 in the gas phase as opposed to quantitatively measuring its concentration. This analysis was performed by flowing the fluidized bed reactor effluent from a specific reduction cycle through a small packed-bed reactor containing 1 g of sodium chloride (NaCl) without condensing the water.55–57 The temperature of the sample line from the reactor to the packed bed was maintained at 180 °C, while the reactor temperature was maintained at 200 °C. In the presence of H2O vapor at this temperature, SO3 reacts with the salt and form sodium sulfate.57 The exposed salt sample was titrated by barium perchlorate (Ba(ClO4)2) solution to detect the presence of SO3.56
Table 1 Experimental conditions
| Case |
Oxygen carrier amount (g) |
Temperature (°C) |
SO2 concentration (ppm) |
CH4 concentration (%) |
Reducing time (min) |
| 1 |
4 |
900 |
0, 1000, 3000, 5000 |
9 |
1 |
| 2 |
4 |
900 |
0, 5000 |
3, 6, 9 |
1 |
| 3 |
4 |
900 |
5000 |
9 |
1, 3, 8 |
| 4 |
4 |
850, 900, 950 |
0, 5000 |
9 |
1 |
Data evaluation
Reduction performance of the Cu34Mn66 was evaluated using total conversion of CH4 and yields of CO2 and CO. Total CH4 conversion considers formation of both CO and CO2 as calculated viaeqn (E2).| | | CH4 conversion (%) = [(XCO + XCO2)/(XCO + XCO2 + XCH4)] × 100 | (E2) |
CO2 and CO yields were calculated viaeqn (E3) and (E4).| | | CO2 yield (%) = [(XCO2)/(XCO + XCO2)] × 100 | (E3) |
| | | CO yield (%) = [(XCO)/(XCO + XCO2)] × 100 | (E4) |
Here, Xi is the molar fraction of the carbon gas species in the reactor outlet stream, with i denoted as CO, CO2, or unreacted CH4. The carbon mass balance closure for the 1 minute reduction period is 0.98 ± 0.013 SE. From the sulfur balance around the reactor, the SO2 loss is calculated by eqn (E5).| | | SO2 loss (mol%) = [1 − (XSO2·out·Fout)/(XSO2·in·Fin)] × 100 | (E5) |
Here, XSO2·out is the molar fraction of SO2 in the flue gas as measured by the GC analyzer and XSO2·in is the inlet molar fraction of SO2. Fout is the calculated outlet molar flow rate, Fin is the inlet molar flow rate of the reducing gas. The loss of SO2 can occur from sulfur accumulation on the Cu34Mn66 particles, SO3 formation, or both.
Results
Effect of SO2 on oxygen uncoupling behavior of Cu34Mn66
Fig. 2 depicts the oxygen concentration profile during oxygen uncoupling in N2 at 900 °C with and without 5000 ppm of SO2. Oxygen concentration measurement in an empty reactor is also reported to show that the N2 flow clears the existing air in the reactor and the oxygen detected in presence of the oxygen carrier particles is the oxygen released from the particles. Without SO2, the oxygen concentration decreases over time, from 6% to 0.6% within 11 minutes. Similar behavior was observed in previous literature.36 In the presence of SO2, the oxygen concentration is slightly higher until about 2.5%; then, the profile is the same. However, the presence of SO2 does not affect the total oxygen uncoupling capacity of the particles after 20 cycles of SO2 exposure. TGA results show that R0 remains at 4 wt% ± 0.02 wt% for the three cases tested: fresh oxidized particles, particles reduced for 20 cycles with 5000 ppm SO2, and particles reduced for 20 cycles without SO2.
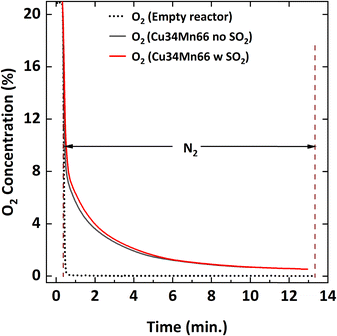 |
| | Fig. 2 O2 concentration profile during oxygen uncoupling of Cu34Mn66 particles in N2 at 900 °C with and without 5000 ppm SO2. | |
Chemical looping combustion of CH4 without SO2
Initially, the Cu34Mn66 particles were reduced with a mixture of 9% CH4-balance N2 to determine its behavior in the absence of SO2. Fig. 3 shows the dry basis concentration profiles of the flue gas species with and without SO2 addition during the 5th cycle at 900 °C. Corresponding CH4 conversion and yields of CO2 and CO are plotted in Fig. 4 and 5, respectively. In Fig. 3, during the pre-reduction N2 purge cycle, O2 concentration drops, but never reaches zero because the Cu34Mn66 particles start releasing O2via the CLOU mechanism. Upon CH4 addition without SO2, fuel oxidation occurs, producing CO2 as the primary product and a small amount of CO. Oxidation can occur from two reactions: 1) CH4 oxidation with the released O2 in the gas phase and 2) direct reaction with the Cu34Mn66 particles. No H2 forms during reduction, as confirmed by the GC analysis. As the reduction proceeds, oxygen content of the Cu34Mn66 particles depletes. Consequently, CO2 concentration decreases while CO and unconverted CH4 concentrations start to increase. Total CH4 conversion is between 90–99% throughout the 1 minute reduction period as seen in Fig. 4. Slight amount of CO formation during the first 10 seconds results in a decrease in CO2 as observed from the CO2 yield shown in Fig. 5. It is also worth noting that O2 release still occurs from the Cu34Mn66 particles (about 1%) during the subsequent inert period after stopping the reducing gas flow of 9% CH4-balance N2 as seen in Fig. 3.
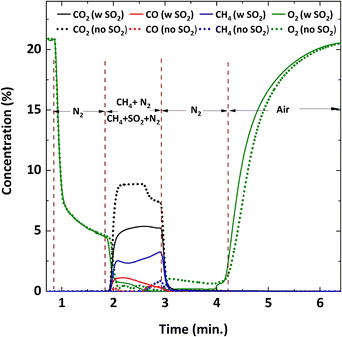 |
| | Fig. 3 Flue gas concentration profiles during the 5th cycle at 900 °C with and without 5000 ppm SO2. The reducing gas is 9% CH4-balance N2 and 9% CH4-5000 ppm SO2-balance N2. The oxidizing gas is air. | |
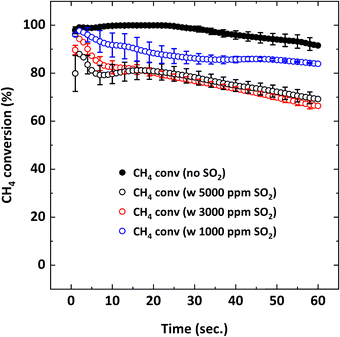 |
| | Fig. 4 CH4 conversion as a function of reduction period during the 5th cycle at 900 °C with 9% CH4-X ppm SO2-balance N2 where X: 0, 1000, 3000, 5000. | |
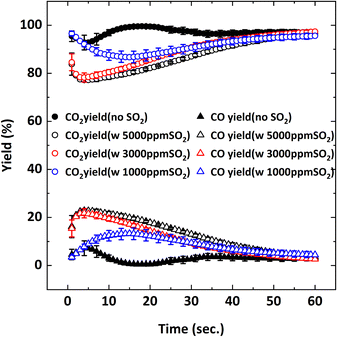 |
| | Fig. 5 CO2 and CO yields as a function of reduction period during the 5th cycle at 900 °C with 9% CH4-X ppm SO2-balance N2 where X: 0, 1000, 3000, 5000. | |
Chemical looping combustion of CH4 with SO2
Before starting the reduction cycle in the presence of SO2, a mixture of 9% CH4-5000 ppm SO2-balance N2 was introduced to an empty reactor at 900 °C to evaluate the possibility of homogenous gas-phase reactions between CH4 and SO2. No such gas-phase reactions were observed, as confirmed by the steady CH4 concentration profile. Then the reduction cycle was performed in the presence of the oxygen carrier particles with a mixture of 9% CH4-X ppm SO2-balance N2 (X: 1000, 3000, 5000 ppm). Fig. 3 depicts the measured flue gas concentration profiles with 5000 ppm SO2 addition during the 5th cycle at 900 °C. When 5000 ppm SO2 is added, CO and unreacted CH4 amounts are higher initially, compared to the SO2-free reduction, resulting in a lower production of CO2. Increasing the SO2 concentration from 1000 ppm to 5000 ppm lowers the conversion of CH4, while increasing the CO yield resulting in a decrease in CO2 yield. Concentration profiles in Fig. 3 shows that negligible O2 release occurs from the particles during the subsequent N2 purge after reduction, unlike the case without SO2, meaning the oxygen content is depleted when SO2 is present. Based on this observation, the presence of SO2 may either contribute to particle deactivation or the consumption of available oxygen during the reduction cycle.
An extended reduction cycle was also carried out to observe the impact of SO2 on CH4 combustion as a function of the reduction duration up to 9 minutes. Fig. 6 shows the profiles of the flue gas species obtained during complete reduction of Cu34Mn66 with and without 5000 ppm SO2. In general, as the duration of the reduction cycle increases, the degree of reduction of the oxygen carrier particles also increases. Without SO2, CO2 concentration gradually decreases while the unreacted CH4 concentration increases. However, when SO2 is present, CO2 and CH4 concentrations follow a relatively steady profile between ∼2.5–4.5 minutes. In addition, the complete reduction of Cu34Mn66 with SO2 takes slightly longer to complete than the 8 minutes required for SO2-free reduction.
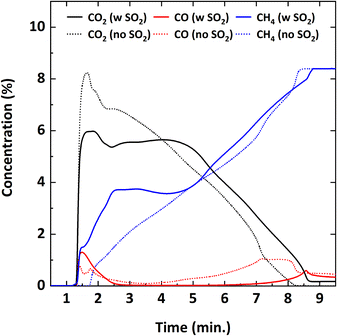 |
| | Fig. 6 Flue gas concentration profiles during complete reduction of Cu34Mn66 particles at 900 °C with 9% CH4-balance N2 and 9% CH4-5000 ppm SO2-balance N2. | |
Analysis of post-combustion species with GC shows no formation of reduced sulfur gas species such as COS and H2S during oxygen carrier reduction via 9% CH4-5000 ppm SO2-balance N2. Fig. 7 shows measured SO2 concentration profile along with calculated SO2 loss as a function of reducing time (up to 8 minutes) for the 1st, 5th, and 20th reduction cycles. For the 8-minute reduction, a single cycle was run due to observed particle agglomeration since the oxygen carrier is completely reduced. For the 1-minute reduction, about 25% of the SO2 feed is lost throughout and the increasing number of cycles does not affect the SO2 outlet concentration or the corresponding SO2 loss during this time. However, for the 3-minute reduction, increasing the cycle number increases the SO2 loss. When the reduction extent of the particles increases, SO2 loss also increases with almost no SO2 left in the flue gas after 8 minutes of reduction.
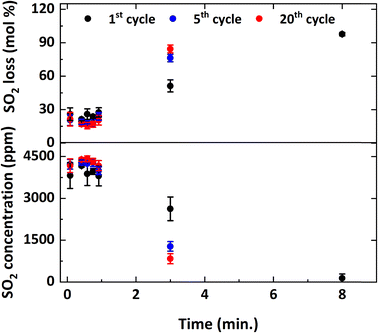 |
| | Fig. 7 Measured SO2 concentration profile and calculated SO2 loss (mol%) as a function of reduction period for the 1st, 5th, and 20th cycles at 900 °C with 9% CH4-5000 ppm SO2-balance N2. | |
To determine the likely cause of SO2 loss in the gas phase, the salt method was employed to detect SO3 if there is any in the gas phase. SO2 could possibly be oxidized to SO3 during the reduction cycle via either homogenous gas-phase or surface catalyzed reaction, resulting in the observed loss of SO2 in the gas-phase. For the 1-minute and 3-minute reduction periods, SO3 was observed during the 5th and 20th cycles, but not during the 1st cycle. However, for the 8-minute reduction it was observed during the 1st cycle.
Since SO2 is oxidized to SO3, in order to see if the availability of O2 changes the effect of SO2 on the oxygen carrier's reactivity, experiments were run with different CH4 concentrations in the feed. Oxygen carrier particles were reduced with gas mixtures of Y% CH4-balance N2 and Y% CH4-5000 ppm SO2-balance N2 (Y: 3, 6, 9), and the corresponding CH4 conversions and the yields of CO2 and CO are provided in Fig. 8 and 9, respectively.
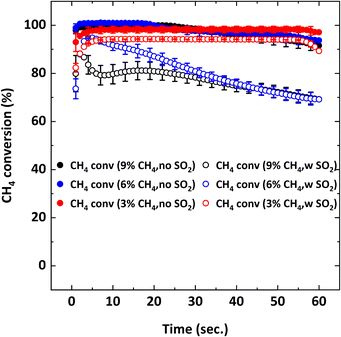 |
| | Fig. 8 CH4 conversion as a function of reduction period during the 5th cycle at 900 °C with Y% CH4-balance N2 and Y% CH4-5000 ppm SO2-balance N2 where Y: 3, 6, 9. | |
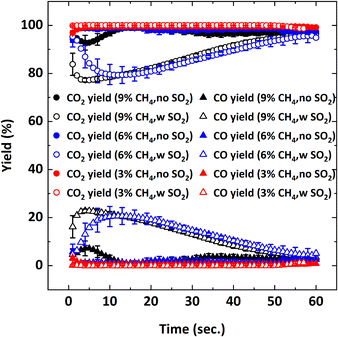 |
| | Fig. 9 CO2 and CO yields as a function of reduction period during the 5th cycle at 900 °C with Y% CH4-balance N2 and Y% CH4-5000 ppm SO2-balance N2 where Y: 3, 6, 9. | |
Without SO2, on average, 95–100% CH4 conversion occurs and there is not much difference in conversion for all the CH4 concentrations tested. As discussed before, CH4 conversion decreases in the presence of SO2. The adverse outcome of SO2 is inversely proportional to CH4 concentration. For example, for 3% CH4 in the feed, the effect of SO2 on CH4 conversion is minimal while the effect is more pronounced for the 9% CH4 case. To explain this behavior, the oxygen concentration profiles were examined. Fig. 10 shows the O2 concentration profiles for different CH4 concentrations with and without 5000 ppm SO2.
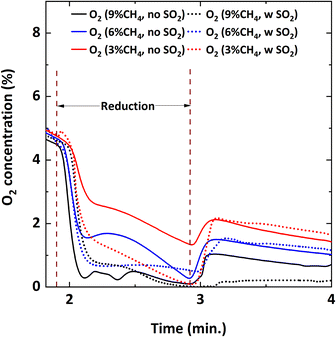 |
| | Fig. 10 O2 concentration profile during the 5th cycle at 900 °C with Y% CH4-balance N2 and Y% CH4-5000 ppm SO2-balance N2 where Y: 3, 6, 9. | |
Lowering the CH4 feed concentration from 9% increases gaseous O2 availability during the reduction cycle. In other words, for the lower CH4 concentrations (6% and 3%), more O2 is released from the oxygen carrier than the amount needed for the combustion reaction with CH4. However, when SO2 is added, the availability of O2 decreases and the O2 concentration profiles become similar for all the CH4 concentrations. This could be because the excess oxygen is being used up by SO2 to become oxidized to SO3; therefore, indicating a competing oxygen demand between SO2 and CH4. However, since Fig. 7 shows that SO2 loss% increases with the reduction period, it can also be assumed that sulfur interacts with the reduced oxygen carrier. Post combustion analysis of the oxygen carrier is discussed later to investigate this hypothesis.
Effect of SO2 on the combustion of CH4 at different operating temperatures was also examined since equilibrium O2 concentration and oxygen release rate of Cu34Mn66 are directly proportional to temperature.36Fig. 11 illustrates CH4 conversion and Fig. 12 illustrates the yields of CO2 and CO at 850, 900 and 950 °C as a function of the reduction period with and without 5000 ppm SO2 addition.
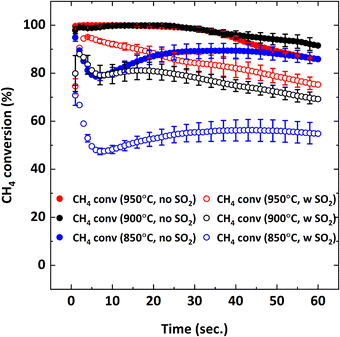 |
| | Fig. 11 CH4 conversion as a function of reduction period during the 5th cycle with 9% CH4-balance N2 and 9% CH4-5000 ppm SO2-balance N2 at different temperatures (850, 900, 950 °C). | |
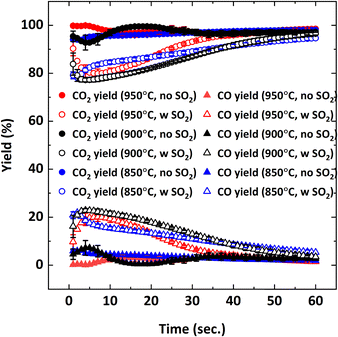 |
| | Fig. 12 CO2 and CO yields as a function of reduction period during the 5th cycle with 9% CH4-balance N2 and 9% CH4-5000 ppm SO2-balance N2 at different temperatures (850, 900, 950 °C). | |
Fig. 11 shows that decreasing the operating temperature increases the negative effect of SO2 on CH4 conversion, with the effect being more pronounced at 850 °C. However, CO2 and CO yields are similar at different temperatures (Fig. 12), indicating that SO2 addition increases the unconverted CH4. To explain the effect of temperature, O2 uncoupling profiles in N2 at different temperatures are provided in Fig. 13. The O2 concentration within the first 2 minutes is lower at 850 °C than those at 900 °C and 950 °C. That explains the lower CH4 conversion at 850 °C than the conversion at 900 °C and 950 °C without SO2. When SO2 is added, the decrease in CH4 conversion is much larger comparing to the case without SO2 since there is a competing O2 demand between SO2 and CH4. At 900 and 950 °C, O2 amount is similar, but CH4 conversion is higher at 950 °C in the presence of SO2 while it is similar without SO2. Therefore, the negative effect of SO2 on the reactivity of the oxygen carrier with CH4 becomes more pronounced at lower temperatures.
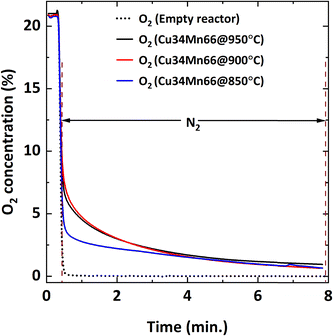 |
| | Fig. 13 O2 concentration profile during oxygen uncoupling of Cu34Mn66 particles at different temperatures (850, 900, 950 °C). | |
Effect of SO2 on multicycle stability of Cu34Mn66
The particles were exposed to 20 reduction–oxidation cycles with 1-minute reduction to determine if the CH4 conversion degrades after multiple cycles when SO2 is present. Fig. 14 shows that the concentration profiles of the flue gas species remain consistent throughout 20 cycles, indicating that the performance of the particles does not degrade over multiple cycles. Following the exposure of oxygen carrier particles to SO2 over 20 cycles, the particles were reduced without SO2 with a mixture of 9% CH4-balance N2. The purpose of this experiment was to determine if the SO2-free reduction performance of the SO2-exposed particles differed from those not initially exposed to SO2. Fig. 14 shows that during the 21st cycle most of the inlet CH4 converts to CO2, which is consistent with the behavior in Fig. 3. So, it can be assumed that the Cu34Mn66 particles recover their reactivity after oxidation and after 20 cycles of SO2 exposure no permanent deactivation occurs. Additionally, no agglomeration of the particles was observed after 21 cycles.
 |
| | Fig. 14 Multicycle redox behavior of Cu34Mn66 particles at 900 °C with 9% CH4-5000 ppm SO2-balance N2. Reducing time is 1 minute. | |
Characterization of Cu34Mn66
The Cu34Mn66 particles tested at various operating conditions were characterized with XRD, XPS, and TPR to evaluate any structural or chemical composition changes following SO2 exposure. Characterization results of samples reduced with two different gas mixtures, i.e., 9% CH4-5000 ppm SO2-balance N2 and 9% CH4-balance N2, at 900 °C are reported here.
Fig. 15 shows the XRD patterns of Cu34Mn66 samples reduced for 1, 3 and 8 minutes for 5 cycles without SO2 and the fresh oxidized sample for comparison. Powder XRD analysis confirms that fresh, fully oxidized Cu34Mn66 consists of CuMn2O4 and Mn3O4 crystalline structures. After 1-minute reduction, CuMn2O4 converts into major Cu1.04Mn0.96O2, Mn3O4, and minor Cu phases in the absence of SO2. Extended reduction of Cu34Mn66 for 3 minutes results in additional Cu2O and MnO crystalline phases, while a fully reduced sample at 8 minutes consists of only Cu and MnO. Fig. 16 shows the XRD patterns for the samples reduced for 1, 3 and 8 minutes for 5 cycles in presence of 5000 ppm SO2 and the oxidized sample following 1-minute reduction with SO2. Oxidized sample after 1-minute reduction with 5000 ppm SO2 has an XRD pattern similar to the pattern of the fresh sample. Reduced samples exposed to SO2 do not show any sulfate or sulfide presence and the XRD patterns look similar to the patterns with no SO2 exposure. The only difference is for the sample reduced for 1 minute with SO2 where the Cu peak is not present. Same thing is observed for the sample reduced for 1 minute for 20 cycles with and without SO2 (Fig. S1 and S2 in ESI†). An interaction between elemental Cu and SO2 likely occurs, but the resulting sulfur-copper compound might only be present on the surface and, therefore, not observed in the XRD pattern.
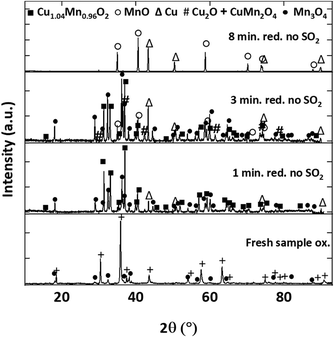 |
| | Fig. 15 XRD patterns of samples reduced for 1, 3 and 8 minutes for 5 cycles at 900 °C with 9% CH4-balance N2 and a fresh oxidized sample. | |
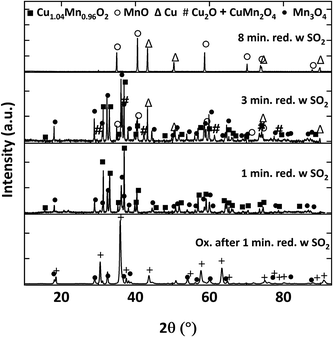 |
| | Fig. 16 XRD patterns of samples reduced for 1, 3 and 8 minutes for 5 cycles at 900 °C with 9% CH4-5000 ppm SO2-balance N2 and oxidized sample after 1-minute reduction for 5 cycles at 900 °C 9% CH4-5000 ppm SO2-balance N2. | |
XPS analysis was performed for the samples exposed to SO2 to determine if any sulfur species form on the surface of the oxygen carrier. Fig. 17 shows the S 2p spectra of 1, 3 and 8 minutes reduced samples with SO2 exposure collected after the 1st cycle. According to literature, the S 2p3/2 peak with a binding energy within 168.2–169.9 eV range indicates sulfate species presence on the surface.58–60 S spectra is not observed for the 1-minute reduced sample. However, for 3 and 8 minutes reduced samples, sulfate presence on the surface of the reduced sample is observed. For the 8-minute reduction, there is an additional S 2p3/2 position at a binding energy of 161.3 eV. This suggests the formation of sulfide species on a fully-reduced surface.58,59,61 When the samples were exposed to SO2 for multiple redox cycles, the sulfate peak is observed even for the 1-minute reduction after 5 cycles. The S spectra for 5th and 20th cycles are provided in Fig. S3.† For the 20th cycle, the sample was re-oxidized after being exposed to SO2 for 20 cycles and the sulfate peak in the XPS spectra (Fig. S4†) is not distinctly seen after oxidizing the sample, which explains the behavior in Fig. 14 where the oxygen carrier is regenerated when it is oxidized and the effect of sulfur on the reactivity is not permanent.
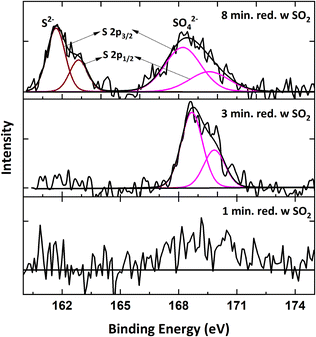 |
| | Fig. 17 S 2p spectra of samples reduced for 1, 3 and 8 minutes for 1 cycle at 900 °C with 9% CH4-5000 ppm SO2-balance N2. | |
Fig. 18 shows Cu 2p spectra of SO2-exposed samples after 1, 3 and 8 minutes of reduction after the 1st cycle. Deconvolution of spectra reveals three distinct Cu 2p3/2 peaks at A (932.2–932.5 eV), B (933.8–934.3 eV), and C (935.7–936.1 eV) positions. On the other hand, in the absence of SO2, the reduced sample only has A and B peaks (Fig. S5†). From the literature, peak A corresponds to the Cu1+ oxidation and may signify reduced CuMnO2, Cu, and Cu2O. Peak B indicates Cu2+ oxides, such as CuO and CuMn2O4. Finally, peak C coincides with a Cu2+ peak that ascribes to the Cu 2p3/2 peak of copper sulfate compounds.59,62–66 For the SO2-exposed samples reduced for 3 and 8 minutes, the presence of sulfate peak gets more prominent comparing to 1-minute reduction. For 1-minute reduction, the sulfate peak gets more pronounced as the number of cycles increases to 20 (Fig. S6†).
 |
| | Fig. 18 Cu 2p spectra of samples reduced for 1, 3 and 8 minutes for 1 cycle at 900 °C with 9% CH4-5000 ppm SO2-balance N2. | |
Fig. 19 shows Mn 2p spectra of reduced samples with SO2 exposure after different reduction periods. From the literature, Mn 2p3/2 peak positions at A (640.4–642.5 eV), B (641.3–641.9 eV), and C (641.6–646.2 eV) correspond to Mn2+, Mn3+, and Mn4+ oxidation states, respectively.58,67–70 Spectra for all three samples exhibit Mn2+, Mn3+, and Mn4+ oxidation states. Since the Mn 2p3/2 peak at 642.7 eV observed for MnSO4 (ref. 71) overlaps with Mn4+, it is challenging to confirm the contribution of Mn towards sulfate formation on the surface.
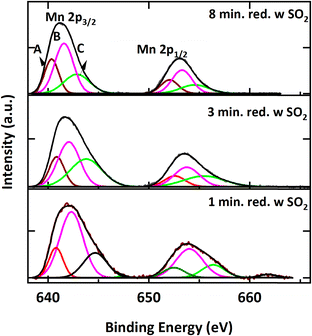 |
| | Fig. 19 Mn 2p spectra of samples reduced for 1, 3 and 8 minutes for 1 cycle at 900 °C with 9% CH4-5000 ppm SO2-balance N2. | |
To see if SO2 is interacting with the Mn sites, TPR analysis was conducted. Fig. 20 shows the TPR profiles of three samples: fresh oxidized, 1-minute reduced sample with 5000 ppm SO2 and 1-minute reduced sample without SO2. Each sample shows two broad overlapping peaks. One is a low-temperature peak between 305–325 °C, and the other is a high-temperature peak between 365–390 °C. The low and high-temperature peaks ascribe to the reduction of Cu2+ to Cu, and the reduction of Mn3+ and Mn4+ to Mn2+, respectively.35,68,72 The low-temperature peak shrinks and shifts to a lower temperature, while the high-temperature peak gets more prominent when the sample is reduced in the presence of SO2 comparing to the sample reduced without SO2. Since a clear difference in the reduction profiles for Mn is seen for the samples reduced with and without SO2, it can be concluded that SO2 is interacting with Mn in addition to Cu.
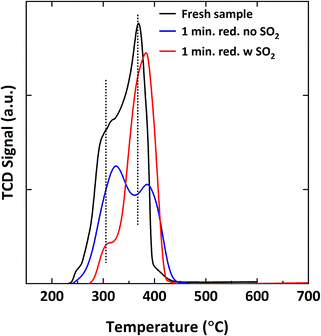 |
| | Fig. 20 H2-TPR spectra of fresh Cu34Mn66 and samples reduced for 1 minute for 5 cycles at 900 °C with 9% CH4-balance N2 and 9% CH4-5000 ppm SO2-balance N2. | |
Discussion
The results of this study show that SO2 adversely affects CH4 conversion and, consequently, the performance of the Cu–Mn oxide in the CLOU process. The possible reasons for the adverse effects of SO2 are outlined in the following discussion.
According to previous studies, reactions between CH4 and SO2 in sub-stoichiometric conditions can form reduced H2S and COS species73–75via heterogeneous catalytic reactions. Both Cu73 and Mn76 elements possess catalytic activity for these reactions. Similarly, they can also act as a catalyst for SO2 oxidation.77 Experimental evidence in this study confirms SO3 presence, but there is no presence of reduced sulfur gaseous species such as H2S or COS, not even during the extended reduction for 3 and 8 minutes. SO2 oxidation to SO3 explains the decrease in O2 concentration when SO2 is present during the reduction cycles when CH4 concentration is less than 9% (Fig. 10). When SO2 is added, the availability of O2 decreases because the excess O2 is being used up by SO2 to become oxidized to SO3; therefore, indicating a competing O2 demand between SO2 and CH4.
Based on the XPS results, SO3 formation is not the only contributor in the reduction of CH4 conversion with the presence of SO2. From the XPS results, S 2p and Cu 2p spectra confirm the presence of SO42− species after 1-minute reduction, particularly in the form of CuSO4. Sulfate species might form by the interaction of SO2 with any of the reduced species such as Cu, CuMnO2, or Mn3O4. The presence of manganese-sulfur surface species remains unconfirmed via XPS. Still, the formation of Mn-sulfate species on the surface of the oxygen carrier is possible since previous selective catalytic reduction (SCR) studies show that SO2 could poison Mn-based catalysts.68 In fact, the TPR results shows that SO2 not only interacts with Cu, but also Mn sites. On the other hand, XRD analysis reveals no sulfate or sulfide crystalline structure formation despite the presence of sulfate on the surface of the oxygen carrier. Therefore, it can be concluded that the crystalline structure of the oxygen carrier is not affected by SO2.
Decreased CH4 conversion in the presence of SO2 could be as a result of the sulfate species on the surface inhibiting O2 release and/or the heterogeneous CLC reaction via lattice oxygen. However, no change in O2 release was observed in this study (Fig. 2). Therefore, the reduction in CH4 conversion could be attributed to the heterogeneous CLC reaction being impacted by the presence of sulfate species on the surface of the oxygen carrier, in addition to the competing oxygen demand between SO2 and CH4 using the released O2 in the gas phase.
Despite the observed decrease in activity, the effect of SO2 does not worsen over multiple redox cycles. Moreover, the SO2-exposed sample can be regenerated after oxidation, going back to its original activity before SO2 exposure.
The extent of reduction of Cu–Mn oxide also affects the influence SO2 has on the oxygen carrier and, consequently, the fuel conversion. A high degree of reduction produces significant elemental Cu, increasing SO2 interaction probability, as found during the 3- and 8-minute reduction cycles. For instance, as seen from the XPS analysis, sulfide species form on the surface of the oxygen carrier upon full reduction. Keeping the reduction extent of materials within the CLOU mechanism with a short residence time where there is less Cu might improve the performance of the Cu–Mn oxide. In addition, due to SO3 formation, the oxygen carrier to fuel ratio might need to be increased to compensate for the oxygen needed for SO3 formation. It is possible that with a higher oxygen carrier to fuel ratio, the adverse effect of sulfur may not be significant.
Conclusions
The interaction of SO2 with a bimetallic Cu–Mn oxygen carrier has been investigated under CLOU conditions in a batch fluidized-bed reactor. The results suggest that SO2 negatively affects total CH4 conversion and CO2 yield. However, the oxygen release capacity of the Cu–Mn oxide remains unaffected. The reactivity with CH4 decreases as the SO2 concentration increases. Increasing the temperature from 850 to 950 °C improves the conversion of CH4. During the reduction cycle, SO2 oxidizes to SO3, creating a competing oxygen demand in the reactor with the fuel, and lowers CH4 conversion if there is not enough oxygen for both reactions. Hence, decreasing the feed CH4 concentration with the same oxygen carrier amount lowers the impact of SO2 on CH4 conversion.
Additionally, characterization of SO2-exposed oxygen carriers via XPS shows that sulfate species form on the surface, possibly causing further reduction in CH4 conversion. However, the presence of sulfate does not cause a permanent deactivation of the particles. The reduction in CH4 conversion does not worsen during 20 redox cycles with 5000 ppm SO2 and the particles can be fully regenerated during the oxidation cycle. Nevertheless, further studies are required in a continuous CLOU unit to determine the sulfur effect during a long-time operation.
Author contributions
Turna Barua: investigation, methodology, formal analysis, writing – original draft. Bihter Padak: conceptualization, funding acquisition, methodology, project administration, supervision, writing – review & editing.
Conflicts of interest
There are no conflicts to declare.
Acknowledgements
The authors are grateful for the financial support provided by the National Science Foundation's (NSF) Combustion and Fire Systems Program (award number 1606874). The authors would also like to thank Madeline Talebi for her assistance with conducting some of the experiments and synthesis of some of the oxygen carriers used in the experiments. She has also helped editing the language of the paper.
References
- Monthly Energy Review: Electricity, U.S Energy Information Administration, 2021.
- M. Bui, C. S. Adjiman, A. Bardow, E. J. Anthony, A. Boston, S. Brown, P. S. Fennell, S. Fuss, A. Galindo, L. A. Hackett, J. P. Hallett, H. J. Herzog, G. Jackson, J. Kemper, S. Krevor, G. C. Maitland, M. Matuszewski, I. S. Metcalfe, C. Petit, G. Puxty, J. Reimer, D. M. Reiner, E. S. Rubin, S. A. Scott, N. Shah, B. Smit, J. P. M. Trusler, P. Webley, J. Wilcox and N. Mac Dowell, Energy Environ. Sci., 2018, 11, 1062–1176 RSC.
- G. De Guido, M. Compagnoni, L. A. Pellegrini and I. Rossetti, Front. Chem. Sci. Eng., 2018, 12, 315–325 CrossRef CAS.
- J. Gibbins and H. Chalmers, Energy Policy, 2008, 36, 4317–4322 CrossRef.
- D. Y. C. Leung, G. Caramanna and M. M. Maroto-Valer, Renewable Sustainable Energy Rev., 2014, 39, 426–443 CrossRef CAS.
- J. Adánez, A. Abad, T. Mendiara, P. Gayán, L. F. de Diego and F. García-Labiano, Prog. Energy Combust. Sci., 2018, 65, 6–66 CrossRef.
-
I. Adánez Rubio, P. Gayán, A. Abad, F. García-Labiano, L. de Diego and J. Adánez, CO2 Capture in Coal Combustion by Chemical-Looping with Oxygen Uncoupling (CLOU) with a Cu-based Oxygen-Carrier, 2011.
-
M. Anheden, A. S. Nasholm and G. Svedberg, Chemical-looping combustion - Efficient conversion of chemical energy in fuels into work, Amer Soc Mechanical Engineers, New York, 1995 Search PubMed.
- M. M. Hossain and H. I. de Lasa, Chem. Eng. Sci., 2008, 63, 4433–4451 CrossRef CAS.
- M. Ishida and H. G. Jin, Ind. Eng. Chem. Res., 1996, 35, 2469–2472 CrossRef CAS.
- J. Li, H. Zhang, Z. Gao, J. Fu, W. Ao and J. Dai, Energy Fuels, 2017, 31, 3475–3524 CrossRef CAS.
- A. Lyngfelt, B. Leckner and T. Mattisson, Chem. Eng. Sci., 2001, 56, 3101–3113 CrossRef CAS.
- I. Adánez-Rubio, A. Abad, P. Gayán, L. F. de Diego, F. García-Labiano and J. Adánez, Int. J. Greenhouse Gas Control, 2013, 12, 430–440 CrossRef.
- P. Gayan, I. Adanez-Rubio, A. Abad, L. F. de Diego, F. Garcia-Labiano and J. Adanez, Fuel, 2012, 96, 226–238 CrossRef CAS.
- T. Mattisson, H. Leion and A. Lyngfelt, Fuel, 2009, 88, 683–690 CrossRef CAS.
- Z. Zhou, L. Han, O. Nordness and G. M. Bollas, Appl. Catal., B, 2015, 166–167, 132–144 CrossRef CAS.
- M. Arjmand, H. Leion, A. Lyngfelt and T. Mattisson, Int. J. Greenhouse Gas Control, 2012, 8, 56–60 CrossRef CAS.
- P. Hallberg, D. Z. Jing, M. Ryden, T. Mattisson and A. Lyngfelt, Energy Fuels, 2013, 27, 1473–1481 CrossRef CAS.
- C. Linderholm, A. Lyngfelt, A. Cuadrat and E. Jerndal, Fuel, 2012, 102, 808–822 CrossRef CAS.
- J. S. Dennis, C. R. Muller and S. A. Scott, Fuel, 2010, 89, 2353–2364 CrossRef CAS.
- Ø. Langørgen, I. Saanum and N. E. L. Haugen, Energy Procedia, 2017, 114, 352–360 CrossRef.
- M. M. Hossain and H. I. de Lasa, Chem. Eng. Sci., 2008, 63, 4433–4451 CrossRef CAS.
- T. Mattisson, A. Lyngfelt and H. Leion, Int. J. Greenhouse Gas Control, 2009, 3, 11–19 CrossRef CAS.
- I. Adánez-Rubio, M. Arjmand, H. Leion, P. Gayán, A. Abad, T. Mattisson and A. Lyngfelt, Energy Fuels, 2013, 27, 3918–3927 CrossRef.
- G. Azimi, H. Leion, M. Rydén, T. Mattisson and A. Lyngfelt, Energy Fuels, 2012, 27, 367–377 CrossRef.
- M. Rydén, A. Lyngfelt and T. Mattisson, Energy Procedia, 2011, 4, 341–348 CrossRef.
- M. Rydén, A. Lyngfelt and T. Mattisson, Int. J. Greenhouse Gas Control, 2011, 5, 356–366 CrossRef.
- N. Mohammad Pour, H. Leion, M. Rydén and T. Mattisson, Energy Fuels, 2013, 27, 6031–6039 CrossRef CAS.
- P. Mungse, G. Saravanan, T. Uchiyama, M. Nishibori, Y. Teraoka, S. Rayalu and N. Labhsetwar, Phys. Chem. Chem. Phys., 2014, 16, 19634–19642 RSC.
- A.-M. Azad, A. Hedayati, M. Rydén, H. Leion and T. Mattisson, Energy Technol., 2013, 1, 59–69 CrossRef CAS.
- F. C. M. Driessens and G. D. Rieck, Z. Anorg. Allg. Chem., 1967, 351, 48–62 CrossRef CAS.
- I. Adánez-Rubio, A. Abad, P. Gayán, L. F. de Diego and J. Adánez, Fuel, 2018, 212, 605–612 CrossRef.
- I. Adánez-Rubio, A. Abad, P. Gayán, F. García-Labiano, L. F. de Diego and J. Adánez, Appl. Energy, 2017, 208, 561–570 CrossRef.
- C. F. Patzschke, M. E. Boot-Handford, Q. Song and P. S. Fennell, Chem. Eng. J., 2021, 407, 127093 CrossRef CAS.
- D. Hosseini, Q. Imtiaz, P. M. Abdala, S. Yoon, A. M. Kierzkowska, A. Weidenkaff and C. R. Muller, J. Mater. Chem. A, 2015, 3, 10545–10550 RSC.
- I. Adánez-Rubio, M. T. Izquierdo, A. Abad, P. Gayán, L. F. de Diego and J. Adánez, Int. J. Greenhouse Gas Control, 2017, 65, 76–85 CrossRef.
- I. Adánez-Rubio, A. Abad, P. Gayán, I. Adánez, L. F. de Diego, F. García-Labiano and J. Adánez, Energy Fuels, 2016, 30, 5953–5963 CrossRef.
- I. Adánez-Rubio, A. Abad, P. Gayán, L. F. de Diego and J. Adánez, Fuel, 2018, 212, 605–612 CrossRef.
- R. F. Pachler, K. Mayer, S. Penthor, M. Kollerits and H. Hofbauer, Int. J. Greenhouse Gas Control, 2018, 71, 86–94 CrossRef CAS.
- E. Ksepko, R. V. Siriwardane, H. Tian, T. Simonyi and M. Sciazko, Energy Fuels, 2012, 26, 2461–2472 CrossRef CAS.
- P. Adolphi, M. Störr, P. G. Mahlberg, H. H. Murray and E. M. Ripley, Int. J. Coal Geol., 1990, 16, 185–188 CrossRef.
-
J. H. Brady and J. R. Holum, Fundamentals of Chemistry, John Wiley & Sons, 1988 Search PubMed.
- P. D. Maier and H. P. Dibbs, Thermochim. Acta, 1974, 8, 155 CrossRef.
- I. Adánez-Rubio, A. Abad, P. Gayán, F. García-Labiano, L. F. de Diego and J. Adánez, Appl. Energy, 2014, 113, 1855–1862 CrossRef.
- R. Pérez-Vega, I. Adánez-Rubio, P. Gayán, M. T. Izquierdo, A. Abad, F. García-Labiano, L. F. de Diego and J. Adánez, Int. J. Greenhouse Gas Control, 2016, 46, 28–38 CrossRef.
- M. Arjmand, M. Rydén, H. Leion, T. Mattisson and A. Lyngfelt, Ind. Eng. Chem. Res., 2014, 53, 19488–19497 CrossRef CAS.
- K. Wang, X. Tian and H. Zhao, Appl. Energy, 2016, 166, 84–95 CrossRef CAS.
- C. Chung, Y. Pottimurthy, M. Xu, T.-L. Hsieh, D. Xu, Y. Zhang, Y.-Y. Chen, P. He, M. Pickarts, L.-S. Fan and A. Tong, Appl. Energy, 2017, 208, 678–690 CrossRef CAS.
- B. Wang, R. Yan, D. H. Lee, D. T. Liang, Y. Zheng, H. Zhao and C. Zheng, Energy Fuels, 2008, 22, 1012–1020 CrossRef CAS.
- C. R. Forero, P. Gayán, F. García-Labiano, L. F. de Diego, A. Abad and J. Adánez, Int. J. Greenhouse Gas Control, 2010, 4, 762–770 CrossRef CAS.
- L. F. de Diego, F. García-Labiano, P. Gayán, A. Abad, A. Cabello, J. Adánez and G. Sprachmann, Int. J. Greenhouse Gas Control, 2014, 28, 168–179 CrossRef CAS.
- X. Tian, K. Wang, H. Zhao and M. Su, Proc. Combust. Inst., 2017, 36, 3381–3388 CrossRef CAS.
- L. F. de Diego, P. Gayán, F. García-Labiano, J. Celaya, A. Abad and J. Adánez, Energy Fuels, 2005, 19, 1850–1856 CrossRef CAS.
-
D. Kunii and O. Levenspiel, Fluidization Engineering, Butterworth-Heinemann, Boston, 1991 Search PubMed.
- E. Vainio, D. Fleig, A. Brink, K. Andersson, F. Johnsson and M. Hupa, Energy Fuels, 2013, 27, 2767–2775 CrossRef CAS.
- N. N. Choudhury and B. Padak, Int. J. Greenhouse Gas Control, 2016, 51, 165–175 CrossRef CAS.
- D. Fleig, E. Vainio, K. Andersson, A. Brink, F. Johnsson and M. Hupa, Energy Fuels, 2012, 26, 5537–5549 CrossRef CAS.
-
A. V. Naumkin, A. Kraut-Vass, S. W. Gaarenstroom and C. J. Powell, NIST X-ray Photoelectron Spectroscopy Database, NIST Standard Reference Database Number 20, National Institute of Standards and Technology, Gaithersburg MD, 2000, p. 20899, DOI:10.18434/T4T88K.
- A. Galtayries and J.-P. Bonnelle, Surf. Interface Anal., 1995, 23, 171–179 CrossRef CAS.
- M. Fantauzzi, D. Atzei, B. Elsener, P. Lattanzi and A. Rossi, Surf. Interface Anal., 2006, 38, 922–930 CrossRef CAS.
- M. Kundu, T. Hasegawa, K. Terabe, K. Yamamoto and M. Aono, Sci. Technol. Adv. Mater., 2008, 9, 035011 CrossRef PubMed.
- V. Hayez, A. Franquet, A. Hubin and H. Terryn, Surf. Interface Anal., 2004, 36, 876–879 CrossRef CAS.
- H.-Y. Chen, Y.-C. Lin and J.-S. Lee, Appl. Surf. Sci., 2015, 338, 113–119 CrossRef CAS.
- D. Fang, J. Xie, D. Mei, Y. Zhang, F. He, X. Liu and Y. Li, RSC Adv., 2014, 4, 25540 RSC.
- V. A. M. Brabers and F. V. Setten, J. Phys. D: Appl. Phys., 1983, 16, L169–L172 CrossRef CAS.
- K. K. Shukla, P. Shahi, G. S. A. Kumar, A. K. Ghosh, R. Singh, N. Sharma, A. Das, A. K. Sinha, A. G. Joshi, A. K. Nigam and S. Chatterjee, RSC Adv., 2015, 5, 83504–83511 RSC.
- H. W. Nesbitt and D. Banerjee, Am. Mineral., 1998, 83, 305–315 CrossRef CAS.
- S. Xiong, Y. Peng, D. Wang, N. Huang, Q. Zhang, S. Yang, J. Chen and J. Li, Chem. Eng. J., 2020, 387, 124090 CrossRef CAS.
- J. S. Foord, R. B. Jackman and G. C. Allen, Philos. Mag. A, 2006, 49, 657–663 CrossRef.
- M. C. Biesinger, B. P. Payne, A. P. Grosvenor, L. W. M. Lau, A. R. Gerson and R. S. C. Smart, Appl. Surf. Sci., 2011, 257, 2717–2730 CrossRef CAS.
- B. R. Strohmeier and D. M. Hercules, J. Phys. Chem., 1984, 88, 4922–4929 CrossRef CAS.
- P. Mungse, G. Saravanan, T. Uchiyama, M. Nishibori, Y. Teraoka, S. Rayalu and N. Labhsetwar, Phys. Chem. Chem. Phys., 2014, 16, 19634–19642 RSC.
- S. E. Mousavi, H. Pahlavanzadeh, M. Khani, H. Ale Ebrahim and A. Mozaffari, Iran. J. Chem. Chem. Eng., 2018, 15, 94–107 Search PubMed.
- J. Sarlis and D. Berk, Chem. Eng. Commun., 1995, 140, 73–85 CrossRef.
- A. S. Bobrin, V. I. Anikeev, A. Yermakova and V. A. Kirillov, React. Kinet. Catal. Lett., 1989, 40, 363–367 CrossRef CAS.
- N. Shikina, S. Khairulin, S. A. Yashnik, T. N. Teryaeva and Z. Ismagilov, Eurasian Chem.-Technol. J., 2015, 17, 129 CrossRef CAS.
- F. Rabiee and K. Mahanpoor, Int. J. Ind. Chem., 2018, 9, 27–38 CrossRef CAS.
|
| This journal is © The Royal Society of Chemistry 2024 |
Click here to see how this site uses Cookies. View our privacy policy here.  *b
*b


![[thin space (1/6-em)]](https://www.rsc.org/images/entities/char_2009.gif) 000 ppm H2S in coal-derived synthesis gas) and natural gas (up to 20 ppm H2S), the oxygen carrier will most likely be exposed to sulfur-containing species in the fuel reactor.39,40
000 ppm H2S in coal-derived synthesis gas) and natural gas (up to 20 ppm H2S), the oxygen carrier will most likely be exposed to sulfur-containing species in the fuel reactor.39,40


