 Open Access Article
Unveiling the dye adsorption capability of Moringa oleifera functionalized hybrid porous MOF–GO composites: in vitro and in silico ecotoxicity assessment via antibacterial and molecular docking studies†
Anil Kumar
K.
a,
Arpit
Bisoi
a,
Yeshwanth
M.
b,
Shobham
c,
Mohan
Jujaru
a,
Jitendra
Panwar
 *c and
Suresh
Gupta
 *a
*a
aDepartment of Chemical Engineering, Birla Institute of Technology and Science, Pilani 333 031, India. E-mail: sureshg@pilani.bits-pilani.ac.in
bDepartment of Bioengineering, University of Pennsylvania, Pennsylvania 19104, USA
cDepartment of Biological Sciences, Birla Institute of Technology and Science, Pilani 333 031, India. E-mail: jpanwar@ pilani.bits-pilani.ac.in
First published on 12th June 2024
Abstract
The present study demonstrated the synthesis of sustainable and eco-friendly composites composed of Fe & Al metal–organic frameworks (Fe-MOF and Al-MOF) and their graphene oxide composites (AlGC and FeGC). Post-synthetic surface functionalization of developed composites was done with Moringa oleifera leaves powder extract. The synthesized MOFs and composites were characterized using standard techniques. The ability of synthesized MOFs and composites to remove methyl orange (MO) and methylene blue (MB) dyes from wastewater was evaluated. Based on the higher dye removal ability, detailed dye adsorption studies were performed with functionalized composites (AlGC and FeGC). Taguchi optimization design was utilized to optimize the four testing factors, viz. contact time, initial dye concentration, composite dosage, and temperature, along with five levels for each factor to achieve the highest capacity for dye adsorption. The composites exhibited outstanding equilibrium adsorption capacities for MO (AlGC: 577 ± 37 and FeGC: 631 ± 42 mg g−1) and MB (AlGC: 336 ± 13 and FeGC: 387 ± 7 mg g−1) dyes, which are found to be the highest among the reported composites so far. Applying isotherms, kinetics, and thermodynamic models confirmed the spontaneous, endothermic reactions for the physisorption of both dyes. The regeneration studies showed more than ∼65% dye removal efficiency of both the composites up to three adsorption–desorption cycles, which confirms their reusability at the industrial scale. The environmental toxicity of developed composites was analyzed by antibacterial studies against selected ecologically important soil bacteria as well as by molecular docking studies against protein targets of selected microorganisms.
Water impactAdsorption is favoured for wastewater treatment due to its efficacy and versatility. MOFs are highly promising adsorbents with adjustable properties. However, challenges like cost and limited industrial use hinder their application. This study develops MOF–GO composites to enhance pollutant removal, promoting sustainable water treatment. Molecular docking and antimicrobial assays assess their environmental impact and efficacy, contributing to wastewater treatment advancements. |
1. Introduction
Water is considered a vital resource on the planet, and the demand for it has increased due to the increase in population and rapid growth of industries. Recently, the worldwide wastewater generation has been estimated as 359.4 × 10⁹ m3 y−1, of which only 52% (188.1 × 10⁹ m3 y−1) was treated.1 Unfortunately, this means that a substantial portion of wastewater remains untreated and poses environmental challenges. In general, industries such as textile, paper, leather, plastic, rubber, cosmetics, and food are mainly responsible for wastewater generation, of which dyes emanating from the textile industries drastically contaminate the water. Approximately 100![[thin space (1/6-em)]](https://www.rsc.org/images/entities/char_2009.gif) 000 distinct compounds are used as dyes, and a substantial amount of dyes and pigments are utilized during the dyeing process. A yearly average of 12% of utilized synthetic dyes and ∼27% of raw dyes are discharged via effluents into various water bodies, contributing to water pollution.2 Methyl orange (MO) and methylene blue (MB) dyes are frequently utilized in textile and other industries. MO is categorized as an anionic dye within the azo dye group and contains a potentially hazardous azo (–N
000 distinct compounds are used as dyes, and a substantial amount of dyes and pigments are utilized during the dyeing process. A yearly average of 12% of utilized synthetic dyes and ∼27% of raw dyes are discharged via effluents into various water bodies, contributing to water pollution.2 Methyl orange (MO) and methylene blue (MB) dyes are frequently utilized in textile and other industries. MO is categorized as an anionic dye within the azo dye group and contains a potentially hazardous azo (–N![[double bond, length as m-dash]](https://www.rsc.org/images/entities/char_e001.gif) N–) group in its chemical structure.3 Meanwhile, MB is a cationic dye extensively used in the textile industry. Both these dyes are reported to be toxic in water due to their complex structures, making their removal challenging as they are non-biodegradable and accumulate in environmental compartments.4–6
N–) group in its chemical structure.3 Meanwhile, MB is a cationic dye extensively used in the textile industry. Both these dyes are reported to be toxic in water due to their complex structures, making their removal challenging as they are non-biodegradable and accumulate in environmental compartments.4–6
Various methods, including physical, chemical, physicochemical, and biochemical processes, have been investigated to remove these dyes.4,7 Among physical methods, adsorption is the most preferred method for dye removal due to its simplicity, high efficiency, low energy requirement, reusability of the adsorbent, and ease of scaling up.8 In recent years, various adsorption materials have been employed to treat industrial wastewater, including zeolites, clay, graphene, activated carbon, carbon nanotubes, polymeric resins, etc.9 Among these, activated carbon stands out as a popular choice due to its exceptional porosity, strong interaction capabilities, chemical inertness, and non-toxic nature.10 However, most of its pores have diameters less than 2 nm, which limits the capturing of bulk dye molecules on the inner surfaces, thereby reducing the proper utilization of its vast surface areas. Moreover, the commercially available activated carbons are costly and non-renewable.11 Considering these drawbacks, there is an emerging need to synthesize materials with suitable pore sizes and large surface areas to remove dyes from wastewater.
In recent years, metal–organic frameworks (MOFs) have emerged as promising materials for removing dye contaminants from wastewater.12,13 Compared to other porous adsorbents, MOFs offer several advantages, such as ultra-low density, well-defined ordered structures, large specific surface areas, ease of synthesis, and good thermal stability, which makes them suitable for the adsorption and removal of dyes from industrial wastewater.14 Furthermore, their high stability in water, expansive surface area, and precise pore size make MOFs particularly effective in adsorbing and removing organic pollutants.15 However, using expensive organic ligands such as terephthalic acid (TPA) and amino-terephthalic acid (NH2–TPA) makes the synthesis process costly. In order to synthesize cost-effective MOFs, organic ligands can be derived from packing waste materials such as polyethylene terephthalate (PET), which mainly contains TPA and ethylene glycol (EG). Hydrolysis is a commonly used depolymerization method to recover TPA from PET waste, which is simple, cost-effective, and can significantly reduce the overall MOF synthesis cost.16,17
Among various MOFs, aluminum (Al) and iron (Fe)-based MOFs have gained significant attention due to their excellent thermal and adsorptive properties, and they have also been considered environmentally friendly.18,19 However, the use of Al- and Fe-based MOFs is limited only to specific applications due to their instability in aqueous and other solvent media.18,19 Compounding graphene oxide (GO) to Al- and Fe-based MOFs via an in situ synthesis procedure can overcome the structural instability of these MOFs in the aqueous medium. GO has recently attracted much interest due to its oxygen-containing functional groups, such as –OH, –COOH, and –CO, which provide a high negative charge density to GO and make it a superior material for water remediation applications.20 Combining Al- and Fe-based MOFs with GO can overcome their instability problem in aqueous media. Moreover, their synergistic properties can enhance their dye adsorption capacity.
Enhancing the surface chemistry and morphology of composites by functionalization can further enhance their dye adsorption capability.21–23 Various parts of the drumstick tree (Moringa oleifera), such as roots, stems, leaves, and husks, are a rich source of diverse compounds, including alkaloids, phenolics, carbohydrates, tannins, flavonoids, glycosides, phenols, proteins, and terpenoids.24–27 These compounds can be extracted and utilized as functional groups on the surface of non-bonded metal and oxygen sites on the composite surfaces.28 Applying these functionalized adsorbents holds great promise in the selective removal of specific dyes present in wastewater, making them effective adsorbents for improving water quality.
In general, the process of dye adsorption depends on various parameters, including equilibrium time, adsorbent dosage, solution temperature, adsorbate concentration, and pH, which necessitates the need for optimization of all the factors simultaneously using appropriate experimental design.28 The choice of experimental design method depends on factors like system complexity, number of factors, precision, and resources. Taguchi's design offers efficient simultaneous optimization of all the parameters and their applicability to design industrial-scale processes.28,29 Compared to other experiment design methods, such as central composite design (CCD) and response surface methodology (RSM), which require more experimental trials, the Taguchi design method is highly proficient in swiftly screening various parameters.28,30,31
Since the synthesis, utilization, and disposal of different MOFs and their composites will ultimately be discharged into the soil environment, they pose a potential threat to beneficial soil microorganisms.14 Very limited reports have assessed the environmental toxicity of MOF-based composite materials toward soil microorganisms due to the intricate nature of the composite structures.32–34 Hence, it is important to assess the toxicity of synthesized MOFs.
Considering the aforementioned facts, the present work aimed to synthesize Al- and Fe-MOF–GO composites following an environmentally sustainable method. It involves the utilization of discarded PET bottles, aluminum foil waste, and ferric chloride hexahydrate (FeCl3·6H2O) as the source of organic ligands (TPA), Al, and Fe, respectively. The synthesizing MOFs were subsequently combined with GO and further surface functionalized by integrating functional groups derived from Moringa leaves powder. The developed composites were tested for their MO and MB dye removal efficiency from wastewater following the Taguchi optimization method. The intricate parametric batch adsorption experiments were carried out to estimate the kinetic, equilibrium, and thermodynamic parameters. Recycling studies were performed to check the composites' reusability. Given the possibility of the composites' release into the soil environment, antimicrobial assays and molecular docking studies were performed to study the toxicity of synthesized composites against selected soil microorganisms.
2. Materials and methods
2.1. Materials
The waste mineral water bottles (PET bottles) and aluminum foil were collected from the students' mess of BITS, Pilani, Rajasthan, India. The collected PET bottles and foil were sterilized by cleaning them with 70% ethanol. After cleaning, they were dried and cut into small pieces about 2 mm in size. These cut pieces were then stored for later use.Analytical grade (AR) reagents with purity levels greater than 99% were employed throughout the study. The pre-processed 2 mm-sized PET particles, sodium hydroxide (NaOH; Merck, India), aluminium foil waste, ferric chloride hexahydrate (FeCl3·6H2O; Molychem, India), N,N-dimethyl formamide anhydrous (DMF) (C3H7NO; Spectrochem, India), 69–72% nitric acid (HNO3; Molychem, India), and 35–37% hydrochloric acid (HCl; Molychem, India) were used for the synthesis of Al and Fe based MOFs.
A graphite flake, median 7–10 microns, 99% purity (Alfa Aesar, India), and Moringa powder (MP), >95% purity were utilized to GO synthesis and extraction of phytochemicals for post-synthetic functionalization of developed composites, respectively.
A synthetic aqueous dye solution of 1000 mg L−1 concentration for MO and MB (Merck, India) in Milli-Q water (Merck KGaA, Germany) was used for dye adsorption experiments.
Agar powder, Luria broth, and 10 mcg per disc tetracycline discs were procured from HiMedia, India. Meanwhile, pure isolates of bacterial strains, namely Bacillus subtilis MTCC 121 (Gram-positive bacterium) and Escherichia coli MTCC 1302 (Gram-negative bacterium), were procured from the Microbial Type Culture Collection and Gene Bank (MTCC), Chandigarh, India.
2.2. Synthesis of adsorbents
![[thin space (1/6-em)]](https://www.rsc.org/images/entities/char_2009.gif) :
:![[thin space (1/6-em)]](https://www.rsc.org/images/entities/char_2009.gif) 6 v/v mixture of ethanol and water (400 mL) and subjected to reflux conditions at 80 °C for 4 h. The resulting mixture was cooled and filtered through Whatman no. 44 filter paper. The water from the obtained filtrate was evaporated under reduced pressure to produce a dense liquid extract, which was kept at 4 °C in a refrigerator for future use.
6 v/v mixture of ethanol and water (400 mL) and subjected to reflux conditions at 80 °C for 4 h. The resulting mixture was cooled and filtered through Whatman no. 44 filter paper. The water from the obtained filtrate was evaporated under reduced pressure to produce a dense liquid extract, which was kept at 4 °C in a refrigerator for future use.
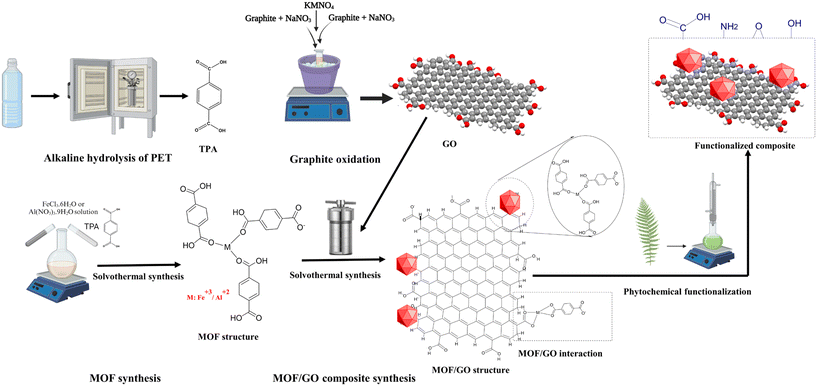
MP extract was used to functionalize the developed MOF–GO composites. Fig. 1 illustrates schematically the key stages involved in synthesizing MOF–GO-based composites. The M-MOF (M: Al, Fe)/GO composite was synthesized by adding 0.78 g of Al(NO3)3·9H2O (2.1 mmol)/0.675 g of FeCl3·6H2O (0.245 mmol) as a metal precursor and 0.206/0.518 g of TPA to a beaker containing 30/15 mL of DMF. Further, 39.4/135 mg of GO (5 wt%) was added to this mixture, and the resulting suspension was sonicated for 10 min and transferred into a Teflon-lined 100 mL hydrothermal reactor maintained at 130/110 °C for 72/20 h. The resulting solid particles were washed twice with DMF to remove unreacted TPA and then twice washed with ethanol and distilled water. The obtained particles were dried at 65 °C for 12 h, then pulverized to form fine particles of the Al-MOF–GO (AlG) and Fe-MOF–GO (FeG) composites. The prepared composite was added with 40 mL ethanol in a 250 mL Erlenmeyer flask for its surface functionalization. 3 mL of viscous MP extract was slowly added to this solution, and the resulting mixture was continuously agitated at a temperature of 70 °C for 24 hours. Later, the functionalized composite was separated by centrifugation and washed thrice with ethanol. The collected composite particles were vacuum-dried at 110 °C for 12 h. The obtained functionalized composites were denoted as AlGC and FeGC.
The pure Al-MOF, Fe-MOF, and unfunctionalized composites (AlG and FeG) were also kept to compare the difference in dye removal performance with functionalized composites (AlGC and FeGC).
Furthermore, the surface area, pore size, and pore distribution of the synthesized composites (AlGC & FeGC) were determined using N2 gas adsorption isotherms through Brunauer–Emmett–Teller (BET) analysis at 77.35 K for 20.15 h and 7.2 h for Al-MOF and Fe-MOF based composites, respectively. Using a mortar pestle, the composites were ground, and any gases that had been adsorbing on their surfaces and pores were removed by degassing the mixture for two hours at 200 °C. The surface characteristics were determined using a BET analyzer (Autosorb-iQ TPX, Anton Paar), and thermal stability analysis of the synthesized composites was performed using a thermo gravimetric analyzer (TGA) (TG-4000, PerkinElmer) in a nitrogen atmosphere at a heating rate of 10 °C min−1 from 20–800 °C.35,39 X-ray photoelectron spectroscopy (XPS, K-Alpha, Thermo Fisher Scientific Pvt. Ltd. UK) analysis was performed using a monochromatic Al Kα X-ray source operating at 1486.6 eV.
A pH meter (CyberScan pH 1100, Eutech Instruments) was used to determine the solution pH. The point of zero charge (pHZPC) for the synthesized composite was determined using the pH drift method. The detailed parameters used for analytical instruments and the sample preparation procedures were given in previous studies.37,38
A UV-vis spectrophotometer (Evolution 201, Thermo Scientific, USA) was utilized to measure the absorbance of the dyes, enabling quantification of MO and MB concentrations at wavelengths of 463.90 nm and 664.55 nm, respectively.28
2.3. Adsorption experiments
For the adsorption experiment, 20 mL of respective dye solution (300 mg L−1) were taken in 100 mL conical flasks. 0.2 M NaOH or 0.2 M HCl was used to adjust the initial solution pH, ranging from 2 to 12. Each flask was added with 20 mg of AlGC/FeGC (selected based on performance evaluation studies) and then incubated at 25 °C with a shaking speed of 150 rpm for 6 h. After that, the obtained solution was subjected to centrifugation to separate the composites from the solution. The obtained samples were appropriately diluted for analysis using a UV-vis spectrophotometer.
| S. No. | Factor A (t, min) | Factor B (m, mg) | Factor C (C0, mg L−1) | Factor D (T′, °C) |
|---|---|---|---|---|
| 1 | 10 | 10 | 100 | 20 |
| 2 | 30 | 15 | 200 | 25 |
| 3 | 60 | 20 | 300 | 30 |
| 4 | 120 | 25 | 400 | 35 |
| 5 | 180 | 30 | 500 | 40 |
Taguchi optimization experiments were carried out by taking a fixed amount of composite in 100 mL conical flasks containing 20 mL of dye solution at the optimal pH condition (determined from the effect of pH studies). The input factors for each experimental run were maintained in the flasks as per the details given in Table S1,† and the flasks were kept for incubation. The flasks were taken out once the incubation process was finished, and the solution was subjected to centrifugation for 7 min at 7000 rpm. The supernatant was collected and diluted to fit within the UV-vis spectrophotometer's detection range. To ensure accuracy, each experiment was conducted in triplicate under identical conditions. Finally, analysis of variance (ANOVA) was used to validate the optimization results and identify the most critical factors impacting the adsorption process. The employed validation methodology was consistent with prior literature studies,28,40 and a detailed analysis approach was utilized to ensure the accuracy and reliability of the model validation.
The final step of Taguchi optimization involves conducting confirmation experiments to examine the model's accuracy. Once the optimum factors have been selected, the response against those factors can be evaluated. The signal-to-noise (S/N) ratio (ηopt) utilizing optimum levels of the design parameters is calculated using the empirical formulas provided in eqn (1). Using the estimated ηopt, the predicted response (Ropt) can be calculated using eqn (2).30,41
 | (1) |
![[small eta, Greek, macron]](https://www.rsc.org/images/entities/i_char_e0c8.gif) i) represents the S/N ratio's mean at the optimum level, and q is the number of the process factors that considerably affect the performance characteristic.
i) represents the S/N ratio's mean at the optimum level, and q is the number of the process factors that considerably affect the performance characteristic. | (2) |
Adsorption experiments were conducted to evaluate the predicted response for the estimated optimum factors. The experimentally achieved adsorption capacity (qexp, mg g−1) was compared with the predicted adsorption capacity (qpred, mg g−1).
| Parameters | t (min) | C 0 (mg L−1) | T (°C) | m (g L−1) |
|---|---|---|---|---|
| t | 0–300 | 500 | 25 | 1 |
| C 0 | 120 | 50–1300 | 25 | 1 |
| T | 120 | 500 | 15–40 | 1 |
| m | 120 | 500 | 25 | 0.5–2 |
2.4. Competitive adsorption studies
Mixed dye solution (MO & MB) was exposed to 1 g L−1 of AlGC and FeGC to study the competitive adsorption performance of these dyes. Each dye concentration was kept at 250 mg L−1 to keep the total loading of dye similar to Taguchi's optimum conditions (500 mg L−1). The experimental flasks were incubated at 25 °C and 150 rpm for 3 h. After incubation, the samples were centrifuged at 7000 rpm for 5 min to separate the dye-loaded composite. The obtained supernatant was diluted to achieve the detection range and analyzed using a UV-vis spectrophotometer for the final dye concentration.2.5. Regeneration studies
The ability to reuse spent composites is crucial, as many prepared composites go unused due to the difficulty of removing the dyes from the composites. Disposing of spent composites to the environment may adversely impact the environment. Hence, removing the adsorbed dye from the spent composite and reusing it to minimize the disposal problems is important. For this, dye-saturated 100 mg composite and 25 mL of 0.01 M HCl and ethanol mixture (1![[thin space (1/6-em)]](https://www.rsc.org/images/entities/char_2009.gif) :
:![[thin space (1/6-em)]](https://www.rsc.org/images/entities/char_2009.gif) 9 v/v) (optimized based on preliminary experiments) were added to a 100 mL conical flask. The flask was then agitated at 25 °C for 2 h. Further, the composite was separated from the solution by centrifugation, which was further oven-dried for 12 h at 60 °C before being reused in subsequent adsorption–desorption experiments. A total of 5 adsorption–desorption cycles were performed.
9 v/v) (optimized based on preliminary experiments) were added to a 100 mL conical flask. The flask was then agitated at 25 °C for 2 h. Further, the composite was separated from the solution by centrifugation, which was further oven-dried for 12 h at 60 °C before being reused in subsequent adsorption–desorption experiments. A total of 5 adsorption–desorption cycles were performed.
2.6. Environmental toxicity studies
The synthesized composites' toxicity was investigated by assessing the antimicrobial activity and molecular docking studies against specific ecologically significant microorganisms, considering that their production, utilization, and eventual disposal may result in environmental release. The composite can be exposed to representative bacterial, fungal, and algal strains under controlled conditions. The growth inhibition, cell viability, and reproductive potential may be thoroughly examined to determine the potential impact on environmental microbial communities.28 Molecular docking experiments are helpful in comprehending the composite's interactions with soil microbial biomolecules. Simulating binding interactions at the molecular level makes it easier to predict how MOF-based composite materials might affect important biomolecules required by environmental bacteria.37,43,44 The combined findings of antibacterial and molecular docking studies would offer valuable insight into the ecological toxicity of the composite.Bacterial cultures ranging from 107 to 108 colony-forming units (CFU) per mL were exposed individually to the synthesized composites (FeGC and AlGC) at a concentration of 1 mg mL−1, a dose determined efficiently for these composites. This exposure was carried out for 12 h at 37 °C. A 100 μL sample was taken from each treated bacterial culture and spread onto separate Luria agar plates. These plates were then incubated for an additional 12 h at 37 °C to evaluate the effect of the composites. Subsequently, bacterial growth was monitored using a colony counter, and the obtained values were quantified as CFU mL−1.
The Kirby–Bauer disc diffusion susceptibility assay was employed to evaluate the antibacterial activity of the synthesized composites. For this, 100 μL of fresh bacterial cultures with a concentration of 108 CFU mL−1 were evenly spread on Luria agar plates. Discs made of Whatman paper no. 1 (9 mm in dia) were soaked overnight in the respective composite solutions (1 mg mL−1). Then, the soaked discs were placed aseptically onto the Petri plates using sterilized forceps. Tetracycline discs (10 mcg per disc) and discs soaked in sterile distilled water overnight were used as positive and negative controls, respectively. The zone of inhibition was assessed after a 12 h incubation at 37 °C following techniques outlined in previous studies.28,46–48
3. Results and discussion
3.1. Characterization of the composites
The graphene oxide synthesized using graphite flakes by Hummer's method has been comprehensively characterized through several techniques, including SEM as depicted in Fig. S1a,† EDS (Fig. S1b†), XRD (Fig. S2a†), and FTIR (Fig. S2b†). These characterization results are available in the ESI.†FE-SEM analysis was carried out to evaluate the morphological and textural properties of the synthesized Al-MOF, Fe-MOF, and their corresponding composites with GO (Fig. 2). The FE-SEM images of the synthesized Al-MOF and its composites exhibited a sphere-shaped morphology (Fig. 2a(i) and b(i)). The micrographs of the synthesized Fe-MOF and composites displayed uniform octahedral-shaped particles (Fig. 2c(i) and d(i)). The EDS spectra for the samples of Al-MOF, Fe-MOF, and their derived composites confirmed the existence of elements such as aluminum (Al), iron (Fe), carbon (C), and oxygen (O), with no noticeable impurities (Fig. 2(ii)).
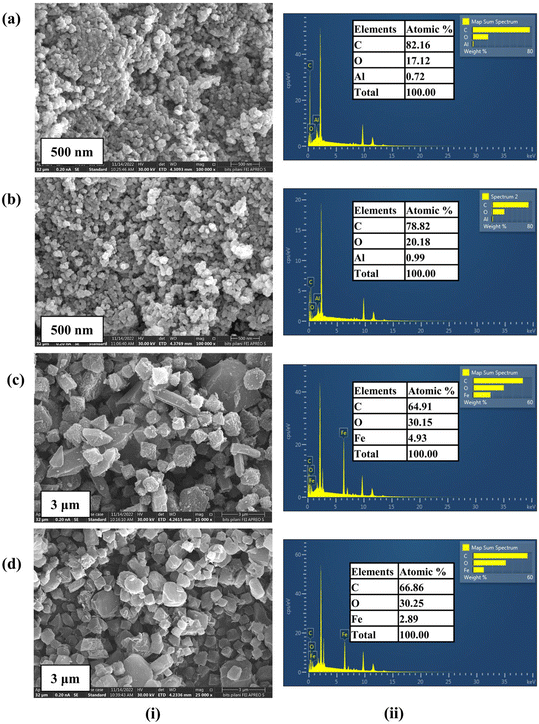 | ||
| Fig. 2 (i) SEM images and (ii) EDS spectra of elemental composition of (a) Al-MOF, (b) AlGC, (c) Fe-MOF, and (d) FeGC composites. | ||
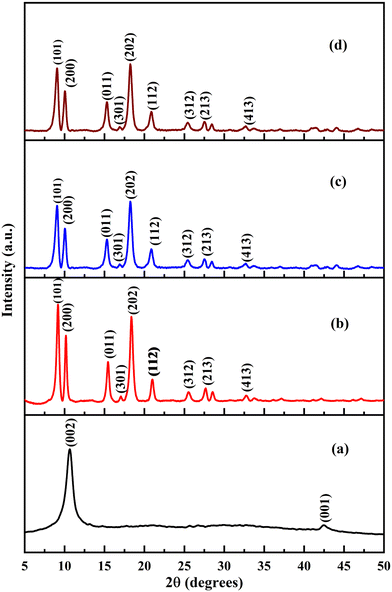
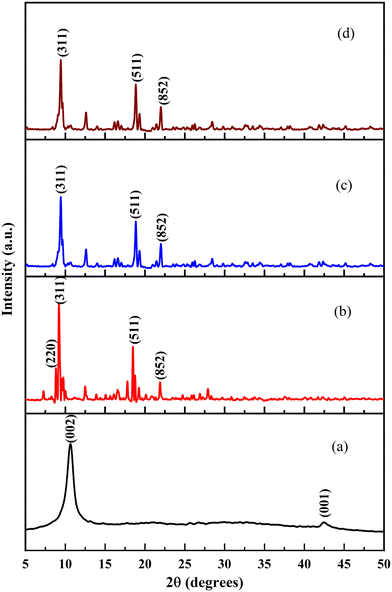
XRD analysis was carried out to study the change in crystallinity of the MOF particles after combination with GO and post-synthetic functionalization. The representative XRD patterns of the synthesized GO and parent Al-MOF were compared with patterns of composites and their functionalized composites (Fig. 3). It is observed that the prominent peaks of the Al-MOF at 2θ values of 9.3°, 10.2°, 15.49°, 17.12°, 18.34°, 20.97°, 25.55°, 27.68°, and 32.85° correspond to (101), (200), (011), (301), (202), (112), (312), (213), and (413) planes, respectively (Fig. 3b). The obtained XRD pattern matches precisely with the reported patterns of Al-MOFs in literature studies.57,58 Similarly, the as-synthesized Fe-MOF exhibited characteristic peaks located at 2θ values of 8.8°, 9.41°, 18.84°, and 21.99°, corresponding to (220), (311), (511), and (852) planes, respectively (Fig. 4b). These patterns match precisely with powder Fe-MOF patterns reported in the literature.18,19,59
The observed XRD patterns of non-functionalized (Fig. 3c and 4c) and functionalized composites (Fig. 3d and 4d) show similar diffraction with no difference in their patterns and peak positions compared to the parent MOFs, which signifies that the crystal structure of the MOF was retained even after being combined with GO and post-synthetic functionalization. The observed XRD patterns of the composites (AlG, AlGC, FeG, and FeGC) show the disappearance of GO-associated peaks due to effective dispersion facilitated by ultrasonication, which separated the single-layer structure of GO.59 However, the intensities of the peaks for composites (AlG, AlGC, FeG, and FeGC) were decreased. The variation in peak intensities can be attributed to covalent bonds between uncoordinated metal sites and oxygen-containing groups from the MOF and GO, respectively. This covalent bond formation enhances the stability of the composites, improving their structural integrity and mechanical strength.14,15,63 Such stability enhancement is of paramount importance in applications related to wastewater remediation.
FTIR analysis results for the Al-MOF and its derived composites are shown in Fig. S3.† In the FTIR spectra of the Al-MOF, a broad vibration band centered at 3600–3200 cm−1 was observed due to the stretching of hydroxyl groups (–OH), which may be due to the surface water molecules and hydrated aluminum octahedra in the Al-MOF framework (Fig. S3b†). The peaks located at 1674 and 1510 cm−1 were mainly due to the stretching of a carboxyl group (C![[double bond, length as m-dash]](https://www.rsc.org/images/entities/char_e001.gif) O) for the carboxylates in the framework. The peaks at 1611 and 1510 cm−1 correspond to asymmetric stretching, while those at 1439 and 1418 cm−1 are due to symmetric stretching of coordinated –COO− groups with Al metal.60 The spectral peaks between 800–700 cm−1 were due to the C–H stretching of terephthalate ligands.58,61 The absorption peaks at 600–1100 cm−1 are due to Al–O interactions in the Al-MOF framework.60
O) for the carboxylates in the framework. The peaks at 1611 and 1510 cm−1 correspond to asymmetric stretching, while those at 1439 and 1418 cm−1 are due to symmetric stretching of coordinated –COO− groups with Al metal.60 The spectral peaks between 800–700 cm−1 were due to the C–H stretching of terephthalate ligands.58,61 The absorption peaks at 600–1100 cm−1 are due to Al–O interactions in the Al-MOF framework.60
AlG and AlGC's spectra showed similar spectra to the parent Al-MOF (Fig. S3c and d†). However, a decrease in intensity was observed for the wide vibration band detected between 3600–3200 cm−1 when combined with graphene oxide (GO) and the organic functionalities from the MP extract. This decrease was attributed to the MOF bonding with GO and the surface modifications involving organic molecules from the extract. The new band at 1708 cm−1 observed in the FTIR spectrum of the functionalized composite corresponds to a carbonyl group (C![[double bond, length as m-dash]](https://www.rsc.org/images/entities/char_e001.gif) O) (Fig. S3d†). This absorption band is a characteristic peak of carbonyl compounds, including aldehydes and carboxylic acids, resulting from the incorporation of functionalities from the MG powder extract.
O) (Fig. S3d†). This absorption band is a characteristic peak of carbonyl compounds, including aldehydes and carboxylic acids, resulting from the incorporation of functionalities from the MG powder extract.
The FTIR spectra recorded for the Fe-MOF and its derived composites are shown in Fig. S4.† In the FTIR spectra of the Fe-MOF, the broad peak present between 3600 and 3200 cm−1 is related to hydroxyl groups (–OH) from surface hydration. The peaks located at 1657 and 1506 cm−1 were mainly due to the stretching of a carboxyl group (C![[double bond, length as m-dash]](https://www.rsc.org/images/entities/char_e001.gif) O) of the carboxylates in the framework (Fig. S4b†). The peaks at 1598 and 1388 cm−1 correspond to symmetric and asymmetric vibrations of O–C
O) of the carboxylates in the framework (Fig. S4b†). The peaks at 1598 and 1388 cm−1 correspond to symmetric and asymmetric vibrations of O–C![[double bond, length as m-dash]](https://www.rsc.org/images/entities/char_e001.gif) O of the aromatic ring of the ligand (TPA). The bending vibration of C–H and C–O–C was observed at 746 and 1014 cm−1, respectively. The characteristic peak at 549 cm−1 was due to Fe–O interaction in the Fe-MOF framework.59,62 The obtained distinct peaks after combination with GO and surface functionalization are similar to those observed in the spectra of the parent Fe-MOF (Fig. S4c and d†). However, after functionalization, the peak between 3600 and 3200 cm−1 showed a decreased intensity and narrower broadness due to composite bonding with extract functionalities. Additionally, the peak at 1719 cm−1, related to GO, completely disappeared in the FeGC composite, indicating bonding between GO surface functional groups and MOF open metal sites.
O of the aromatic ring of the ligand (TPA). The bending vibration of C–H and C–O–C was observed at 746 and 1014 cm−1, respectively. The characteristic peak at 549 cm−1 was due to Fe–O interaction in the Fe-MOF framework.59,62 The obtained distinct peaks after combination with GO and surface functionalization are similar to those observed in the spectra of the parent Fe-MOF (Fig. S4c and d†). However, after functionalization, the peak between 3600 and 3200 cm−1 showed a decreased intensity and narrower broadness due to composite bonding with extract functionalities. Additionally, the peak at 1719 cm−1, related to GO, completely disappeared in the FeGC composite, indicating bonding between GO surface functional groups and MOF open metal sites.
3.2. Screening of synthesized composites for their dye adsorption efficiency
The synthesized composites were screened for their maximum adsorption capacity to remove dyes (MO & MB) from wastewater (Fig. 5). The obtained results demonstrated that the Al-MOF and Fe-MOF had an adsorption capacity of 215 ± 7.1 and 347 ± 8.6 mg g−1 for MO and 120 ± 6.1 and 61 ± 5.1 mg g−1 for MB, respectively. The combination of the MOF and GO significantly improved the adsorption capacity, with enhancements of 53% and 8% for MO and 62% and 113% for MB for the composites AlG and FeG, respectively, over their parent MOF. However, after the surface functionalization of the composites by MP extract, AlGC and FeGC showed an upsurge of 33% and 16% for MO and 26% and 24% for MB from their original values (uncapped). The maximum adsorption capacities for AlGC and FeGC were obtained as 440 ± 9.5 and 435 ± 8.9 mg g−1 for MO and 247 ± 6.3 and 173 ± 5.6 mg g−1 for MB, respectively. The studies concluded that AlGC and FeGC exhibited superior adsorption capacity for MO and MB dyes compared to the other tested adsorbents. It is well known that the composite's heightened surface energy resulting from the combination of the MOF with GO and the incorporation of functional groups (–COOH, –OH, etc.) on the composite surface collectively contributed to an enhanced adsorption capacity. The specific functional groups from the MP extract enhanced the adsorptive properties by increasing electrostatic forces and forming interactive bonds with the dyes.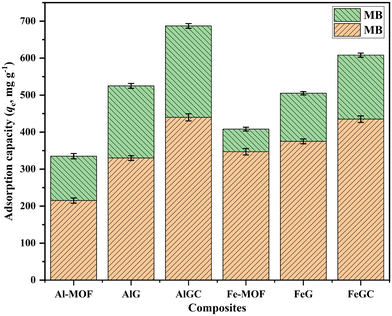 | ||
| Fig. 5 Adsorption efficiency of synthesized materials for the removal of MO and MB dyes from aqueous solutions. | ||
Considering the fact that surface area and surface charge are key parameters for the higher adsorption capacity of any composite, AlGC and FeGC were further characterized by BET surface area analysis and pHZPC. The surface area of the composite is an essential parameter to measure the adsorption efficiency. The shape of N2 adsorption & desorption isotherms and hysteresis were applied to calculate the surface area and characterization of the adsorption of AlGC and FeGC composites. The BET surface area, average pore size, Barrett–Joyner–Halenda (BJH) pore volume, and pore radius estimated for the composites are reported in Table 3. It is evident from the isotherm that the composites exhibited isotherms of type IV with a hysteresis loop of type H4 (Fig. 6a and b).63,64 The progressive increase in adsorption was observed at a relative pressure of 0–0.6 P/P0 due to monolayer adsorbate deposition on the composite surface. Then, a steady rise in adsorption was observed at 0.6–0.9 P/P0 due to the multi-molecular layer adsorption. The sudden rise in adsorption and desorption branch at a relative pressure of 0.9–1 P/P0 was due to the higher number of micropores in the composite.64 The differences in adsorption at lower and high pressure confirm the presence of the composite, which has a significant amount of macropores and a small number of micropores. Based on the BJH method, the mesopore size distribution showed a narrow pore radius peak centered at 0.0017 μm for the composites AlGC and FeGC. The BET test results indicated that the composite's surface area (AlGC: 1059 m2 g−1 and FeGC: 189 m2 g−1) and pore volume (AlGC: 1.31 cc g−1 and FeGC: 1.19 cc g−1) are significantly higher, making it a promising candidate for efficient dye adsorption from wastewater. This enhancement can be attributed to the composite's formation by combining the MOF with GO.
| Sample | BET surface area (m2 g−1) | Average pore size (μm) | Pore volume (cm3 g−1) | Pore radius (μm) |
|---|---|---|---|---|
| AlGC | 1059 | 0.003 | 1.317 | 0.002 |
| FeGC | 189 | 0.002 | 1.191 | 0.002 |
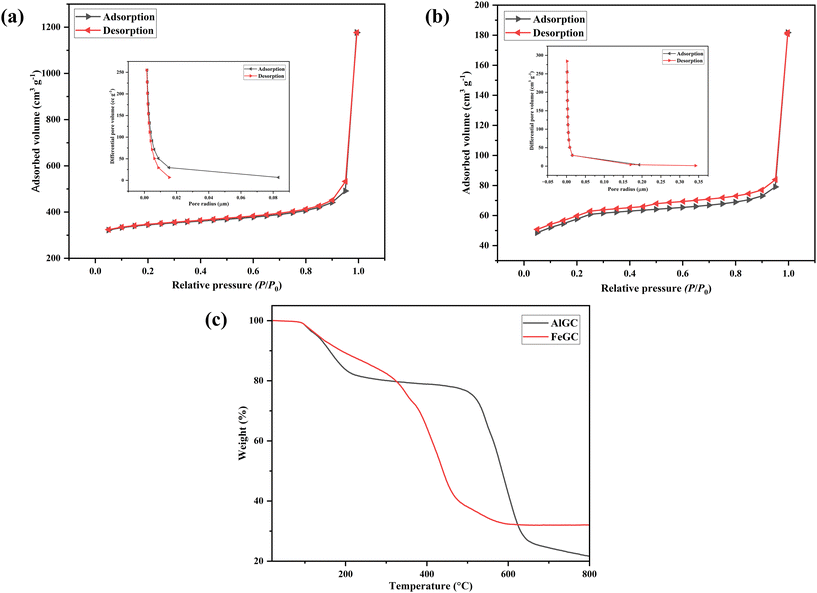 | ||
| Fig. 6 The nitrogen adsorption/desorption isotherms and BJH pore size distribution curves of (a) AlGC and (b) FeGC; (c) TGA analysis of the synthesized composites. | ||
The surface charge (pHZPC) of AlGC and FeGC was found to be 5.2 and 5.1, respectively (Fig. S5†), which corresponds to the point at which the surface charge over the composite is neutral. It refers to the pH value at which the adsorbent surface carries no net charge.37
The thermal stability of AlGC and FeGC was analyzed using TGA (Fig. 6c). There was no weight loss of the composites observed up to 90 °C. The increase in temperature from 90 to 250 °C resulted in approximately 20% weight loss of composites. The composites contained water molecules of about 19 and 22 wt% for AlGC and FeGC composites, respectively. This surface moisture and other volatile compounds were easily evacuated before 250 °C. Furthermore, an increase in temperature beyond 250 °C showed the removal of residual solvent molecules entrapped within the pores of the composite.35 The TGA curves showed 3 stages for AlGC and FeGC composites, corresponding to the removal of free and bonded H2O molecules, followed by the decomposition of organic ligands, and MOF decomposition at 670 and 350 °C for the AlGC and FeGC composites, respectively.65 The TGA signifies the high thermal stability of the synthesized composites, confirming the possibility of their utilization at higher temperatures.
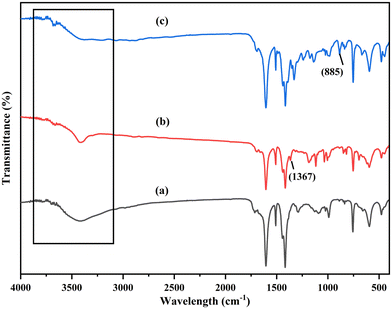
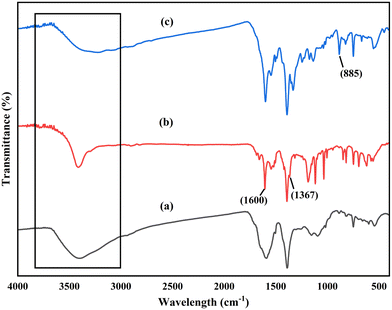
Further, to better understand the detailed adsorption mechanism, FTIR and XPS analysis of AlGC and FeGC was determined before and after dye adsorption. The obtained FTIR spectra after dye adsorption were compared with the recorded spectra of pure composites (Fig. 7 and 8). After dye adsorption, there was a decrease in peak intensities, a shift in spectral position, and the presence of new peaks, which confirmed the dye adsorption on the surface of AlGC and FeGC. The detailed results are discussed in section 3.6.
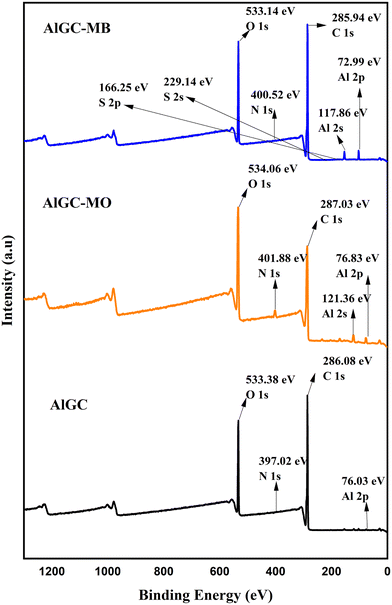
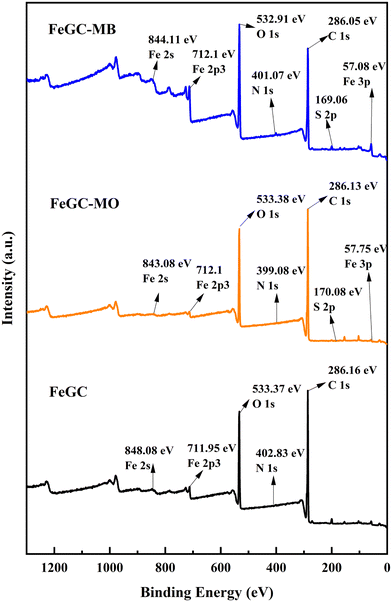
Fig. 9 and 10 present the XPS survey spectra of AlGC and FeGC before and after adsorption of MO and MB dyes, respectively. The full-scale XPS spectrum of composites before adsorption revealed the presence of elements in both composites, including C 1s, O 1s, and N 1s, followed by Al 2s and Fe 2p for AlGC and FeGC, respectively. Hence, the wide range of functionalities and stable configuration achieved between the composite and graphene oxide are confirmed by XPS, corroborating the results obtained from XRD analysis. It can be observed that there was a slight shift in binding energy in the C 1s and O 1s peaks of the AlGC and FeGC composites, respectively, due to interactions between the dye molecules and the composite surface, which supported the dye molecule adsorption on the composite surface.
The results obtained from the present work and surface characteristics of the adsorbents validated the suitability of functionalized composites, i.e., AlGC and FeGC, for further optimization and batch adsorption investigations to remove MO and MB dyes from synthetic aqueous solutions.
3.3. Solution pH influence on dye adsorption
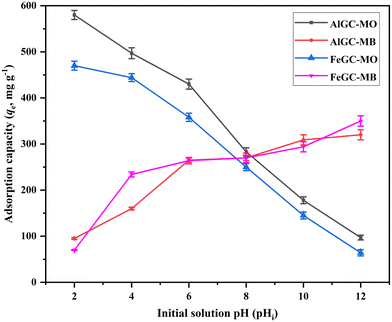
Fig. 11 displays the adsorption capacity of AlGC and FeGC composites for MO and MB dyes by varying initial solution pH values (2–12). The highest MO adsorption was attained in an acidic environment, yielding 580 ± 9.8 mg g−1 and 470 ± 9.7 mg g−1 using AlGC and FeGC, respectively. Conversely, maximum MB adsorption capacity values of 320 ± 10.9 and 350 ± 11.28 mg g−1 were achieved in the basic region using AlGC and FeGC, respectively. At pH below pHZPC of the composite (AlGC: 5.2, FeGC: 5.1), the surface is positively charged, providing an electrostatic force on the composite surface for the adsorption of the anionic dye (MO). Hence, the adsorption of MO dye reaches its maximum in the acidic region due to the favorable interaction among the negatively charged dye molecules and positively charged surface of composites.65 Conversely, when the initial solution pH is higher than the pHZPC, the composite surface becomes negatively charged, making it easier for the cationic dye (MB) to adsorb.28,37 The findings reveal that the pH level of the solution notably impacts the MO and MB adsorption onto the composite. To achieve optimal adsorption for the removal of both dyes, it is recommended to maintain a pH range between 6 and 8. The pH of the initial solutions containing MO and MB dyes was 4.4 ± 0.4 and 6.2 ± 0.3, respectively. These initial solutions were utilized without any pH adjustment to investigate the parametric effects on dye removal from wastewater using the developed composite materials. Furthermore, it should be noted that the composite surface charge properties are conducive to the specified pH conditions of the solution. Specifically, the composite exhibits positive and negative surface charges, which are suitable for the anionic (MO) and cationic (MB) dye adsorption depending on the pH conditions of the initial solution.3.4. Optimization using the Taguchi method and statistical analysis
Fig. 12 and 13 illustrate the sensitivity analysis based on the S/N ratio for the adsorption of dyes onto the developed composites by considering each input factor. These plots assist in identifying the key parameters and their ideal levels for achieving the highest adsorption capacity. Based on the S/N ratio plots (Fig. 12 and 13), the adsorption of dyes was maximum at higher C0 (mg L−1) and at a lower value of m (mg), which were found to be the most significant factors compared to other input factors. Conversely, the solution temperature and contact time had minimal effects on the composite's adsorption capacity.
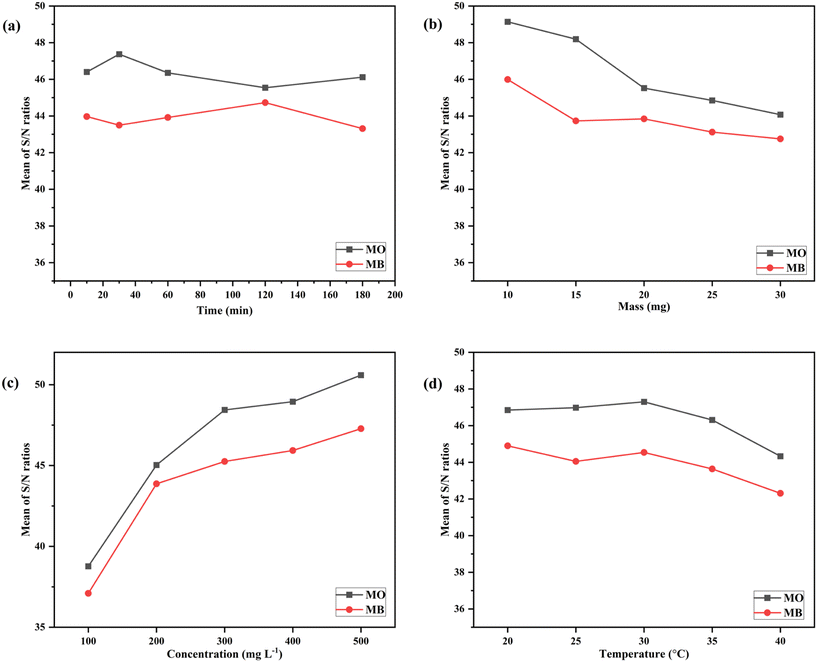 | ||
| Fig. 12 Sensitivity analysis of AlGC based on S/N ratios for the parameters (a) t (min), (b) m (mg), (c) C0 (mg L−1), and (d) T (°C). | ||
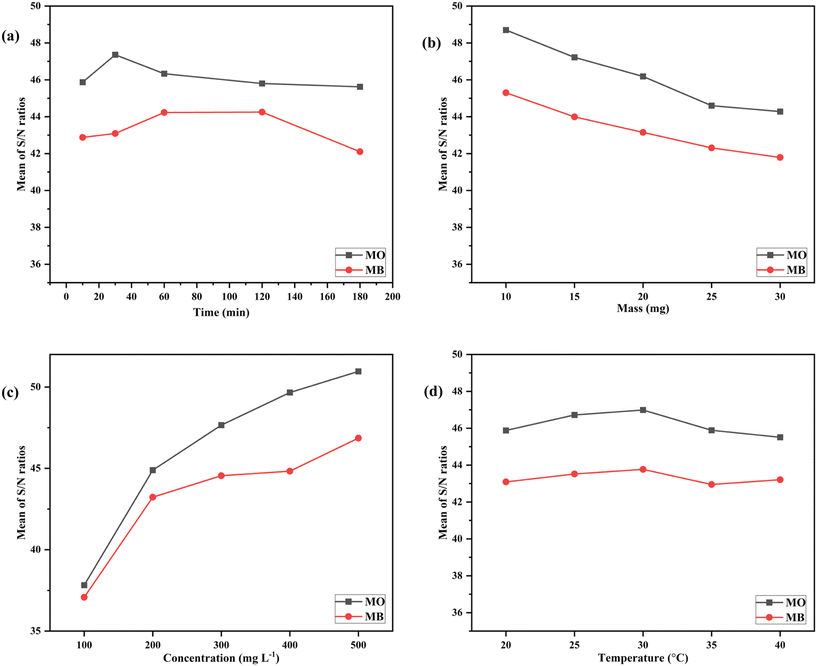 | ||
| Fig. 13 Sensitivity analysis of FeGC based on S/N ratios for the parameters (a) t (min), (b) m (mg), (c) C0 (mg L−1), and (d) T (°C). | ||
Table S3† summarises the findings from the ANOVA for dye removal utilizing composites. The significance of the model and related factors were statistically validated using Fisher's test (F-test) and the coefficient of determination (R2). The higher F-test value also confirmed that the initial dye concentration and composite dosage had a more significant impact on the removal of the dye using composites than contact time and solution temperature. Moreover, the analysis revealed that the R2 value exceeded 0.75 in all instances, suggesting that the study only accounted for 75% of the variability in the dye removal process. However, these results also suggested that the model did not account for the remaining 25% of the variance caused by the process. The study utilised percentage contribution calculations to assess the relative impact of each parameter on the process (Table 4). The findings demonstrated that among the various parameters investigated for dye removal utilizing the developed AlGC and FeGC, C0 and m were the primary factors exerting the most influence on dye adsorption.
| Adsorbent | Dye | T (min) | m (mg) | C 0 (mg L−1) | T (°C) | q pred (mg g−1) | q exp (mg g−1) | E% |
|---|---|---|---|---|---|---|---|---|
| AlGC | MO | 30 | 10 | 500 | 30 | 483.29 | 425 | 13.71 |
| AlGC | MB | 120 | 10 | 500 | 20 | 294.08 | 248 | 18.58 |
| FeGC | MO | 30 | 10 | 500 | 30 | 477.67 | 435 | 9.81 |
| FeGC | MB | 120 | 10 | 500 | 30 | 291.84 | 238 | 22.62 |
3.5. Parametric batch studies
Taguchi optimization has provided the optimum set of factors for removing dyes from aqueous solutions using AlGC and FeGC composites. However, further batch studies were performed for the same input factors used in Taguchi optimization studies to confirm the model's adaptability to the one factor at a time (OFAAT) approach. Table 2 provides a comprehensive list of parameter values employed in the batch studies.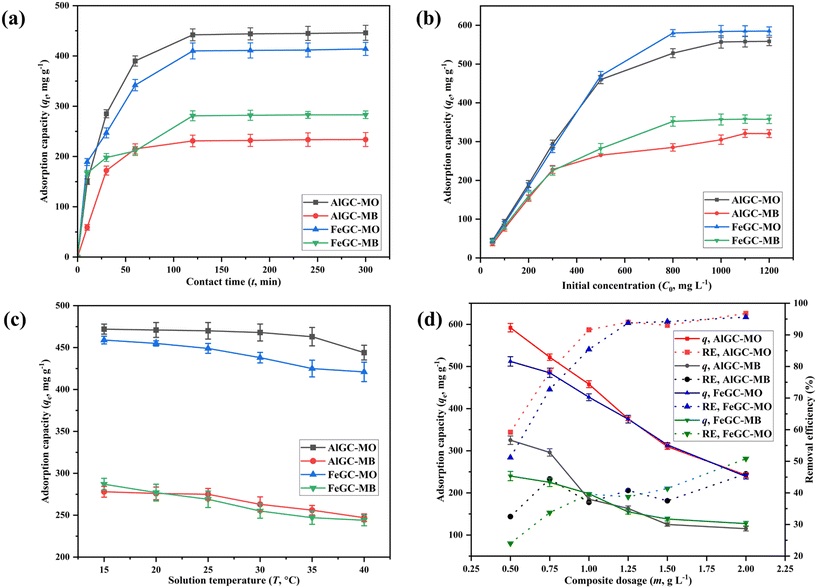 | ||
| Fig. 14 Investigating the influence of (a) t (min), (b) C0, (mg L−1), (c) T (°C), and (d) m (mg L−1) on MO and MB adsorption using AlGC and FeGC. | ||
Indeed, adsorption time studies alone may not fully elucidate the complex interaction between the dye and composite. Therefore, it is necessary to employ appropriate models to analyze this interaction comprehensively. The present study utilized non-linear forms of kinetic models to determine the removal rate and other kinetic parameters of dye removal using AlGC and FeGC. The Origin software 2023 (Learning version) was utilized to conduct non-linear adsorption kinetic model fitting using the experimental kinetic data (Fig. S6 and S7†). The estimated kinetic constants and parameters by fitting the experimental results to the kinetic models are reported in Tables 5 and 6.
| Model | Parameters | Values | Regression coefficient (R2) | ||
|---|---|---|---|---|---|
| MO | MB | MO | MB | ||
| Kinetic models | |||||
| Pseudo-first-order | q e (mg g−1) | 448 ± 3.8 | 234 ± 4 | 0.998 | 0.992 |
| k 1 (min−1) | 0.036 ± 0.006 | 0.039 ± 0.003 | |||
| Pseudo-second-order | q e (mg g−1) | 493 ± 11 | 260 ± 12 | 0.991 | 0.967 |
| k 2 (g mg−1 min−1) | 9.95 × 10⁻⁴ ± 1 × 10⁻⁵ | 1.95 × 10⁻⁴ ± 5 × 10⁻⁵ | |||
| Elovich model | α (mg g−1 min−1) | 67 ± 36 | 34 ± 27 | 0.956 | 0.912 |
| β (g mg−1) | 0.011 ± 0.001 | 0.021 ± 0.004 | |||
| Isotherms | |||||
| Langmuir | Q m (mg g−1) | 577 ± 37 | 336 ± 13 | 0.91 | 0.97 |
| b (L mg−1) | 0.061 ± 0.018 | 0.017 ± 0.003 | |||
| R L | 1–0.013 | 1–0.04 | |||
| Freundlich | 1/n | 0.24 | 0.29 | 0.77 | 0.85 |
| K F (mg g−1) (dm3 mg−1)1/n | 123 ± 41 | 45 ± 15 | |||
| Temkin isotherm | A T (L min−1) | 1 ± 0.6 | 0.19 ± 0.06 | 0.87 | 0.95 |
| B (J mol−1) | 91 ± 13 | 64 ± 5 | |||
| b T | 26.97 | 38.28 | |||
| D–R isotherm | Q m (mg g−1) | 532 ± 34 | 297 ± 10 | 0.88 | 0.96 |
| K (mol2 kJ−2) | 1 × 10⁻⁵ ± 2 × 10⁻⁶ | 1.8 × 10⁻⁴ ± 3 × 10⁻⁵ | |||
| E (J mol−1) | 219.26 | 52.27 | |||
| Model | Parameters | Values | R 2 | ||
|---|---|---|---|---|---|
| MO | MB | MO | MB | ||
| Kinetic models | |||||
| Pseudo-first-order | q e (mg g−1) | 407 ± 14 | 266 ± 14 | 0.961 | 0.895 |
| k 1 (min−1) | 0.037 ± 0.006 | 0.066 ± 0.001 | |||
| Pseudo-second-order | q e (mg g−1) | 445 ± 14 | 288 ± 12 | 0.981 | 0.956 |
| k 2 (g mg−1 min−1) | 1.28 × 10⁻⁴ ± 2 × 10⁻⁵ | 3.44 × 10⁻⁴ ± 1 × 10⁻⁵ | |||
| Elovich model | α (mg g−1 min−1) | 94 ± 43 | 238 ± 157 | 0.975 | 0.979 |
| β (g mg−1) | 0.013 ± 0.001 | 0.02 ± 0.003 | |||
| Isotherms | |||||
| Langmuir | Q m (mg g−1) | 631 ± 42 | 387 ± 7 | 0.92 | 0.99 |
| b (L mg−1) | 0.036 ± 0.01 | 0.016 ± 0.001 | |||
| R L | 1–0.02 | 1–0.04 | |||
| Freundlich | 1/n | 0.28 | 0.31 | 0.76 | 0.92 |
| K F (mg g−1) (dm3 mg−1)1/n | 106 ± 41 | 47 ± 12 | |||
| Temkin isotherm | A T (L min−1) | 0.43 ± 0.2 | 0.22 ± 0.03 | 0.88 | 0.98 |
| B (J mol−1) | 114 ± 15 | 72 ± 3 | |||
| b T | 21.66 | 34.40 | |||
| D-R isotherm | Q m (mg g−1) | 589 ± 11 | 337 ± 17 | 0.99 | 0.92 |
| K (mol2 kJ−2) | 4 × 10⁻⁵ ± 3 × 10⁻⁶ | 2 × 10⁻⁴ ± 6 × 10⁻⁵ | |||
| E (J mol−1) | 105.23 | 49.78 | |||
The experimental kinetic data of dye adsorption using AlGC demonstrated strong concordance with the pseudo-first-order kinetic model, yielding an R2 > 0.99 (Tables 5 and 6). The estimated equilibrium adsorption capacity (qe, mg g−1) was 448 ± 3.8 & 234 ± 14 mg g−1 for MO and MB removal, respectively, using AlGC that is well-concordant with the experimentally obtained adsorption capacities of dyes (MO: 446 ± 14 mg g−1 and MB: 233.8 ± 14 mg g−1). Therefore, the adsorption of dyes by AlGC is more likely a physical adsorption process.
Similarly, the observed kinetics of dye adsorption using FeGC closely adhere to the pseudo-second-order kinetic model, exhibiting higher R2 values (MO: 0.98 and MB: 0.95) compared to the R2 values obtained for the first-order kinetic model (Tables 5 and 6). However, the estimated qe values (MO: 407 ± 14 mg g−1 and MB: 266 ± 14 mg g−1) from the first-order kinetic model provided close estimation with the experimentally obtained adsorption capacities (MO: 414 ± 13 mg g−1 and MB: 283 ± 7.5 mg g−1) using FeGC. Hence, the consistent experimental applicability of the first-order kinetic model shows the presence of physisorption as the primary adsorption process; however, chemisorption can't be denied. In addition, the calculated rate constants (k1 and k2) from the first- and second-order kinetic models demonstrated that the adsorption of dyes by AlGC and FeGC occurs rapidly, reaching saturation within a short time.
The Elovich kinetic model is considered a better method for describing the adsorption rate kinetics than the commonly used pseudo-first and second-order rate kinetic models. The Elovich model provides a more comprehensive description of the adsorption process by incorporating two rate constants. These constants are useful in characterizing the initial rapid adsorption phase, followed by a slower adsorption rate as the surface becomes saturated. The adsorption rate (α, mg g−1 min−1) and desorption rate (β, g mg−1) were calculated by fitting the non-linear Elovich model to the experimental kinetic data for the dye adsorption (Fig. S6, S7† and Tables 5, 6). This investigation showed that the adsorption rate was greater than the desorption rate since the values of α for removal of both dyes utilizing the composites were higher than the β values.67 The lower desorption rate suggested that the synthesized composite provides better removal efficiency of the dyes.
Further, the study utilized four different types of non-linear isotherms (Langmuir, Freundlich, D–R, and Temkin) to fit the experimental equilibrium studies of dye adsorption by the composites (Fig. S8 and S9†) and obtained parameters are presented in Tables 5 and 6. The results obtained from isotherm models aid in comprehending the interaction between the dye molecules and the AlGC and FeGC surface. Among the Langmuir and Freundlich isotherms, the Langmuir isotherm proved to be the most suitable fit for the equilibrium data. It exhibited an r2 exceeding 0.9 for both MO and MB adsorption on both composites, confirming that dye molecules cover the composites' surface in a monolayer. The maximum adsorption capacity from the Langmuir model was obtained as 577 ± 37 and 631 ± 42 mg g−1 for MO and 336 ± 13 and 387 ± 7 mg g−1 for MB using AlGC and FeGC, respectively, which showed a good match with the experimentally obtained adsorption capacity. The separation constant RL, falling within the range of 0–1, indicates favorable adsorption of the dyes on the composites.69 Additionally, the adsorption parameters, adsorption intensity (1/n) and adsorption capacity (KF), calculated from the Freundlich isotherm, confirmed the feasibility and favorability of dye adsorption on the AlGC and FeGC surfaces. Successful favourable adsorption required a value of 1/n in the range of 0–1, which was achieved by the adsorption of dyes onto the AlGC and FeGC composites. The higher KF values obtained for adsorption of dyes onto the synthesized composites indicated a faster adsorption rate, demonstrating the applicability for commercial utilization.67
The isotherms, such as Langmuir and Freundlich, were inaccurate in differentiating between the types of the adsorption process, whether chemical or physical, as they assume constant adsorption potential.70 Therefore, it is necessary to include Temkin and D–R isotherms to examine the adsorption process type. The higher adsorption affinity (Qm) values obtained from fitting experimental data to these models indicated that the developed composites had a greater affinity towards removing the dyes. The values of the adsorption intensity E and B obtained from the Temkin and D–R isotherms were less than 219 J mol−1, signifying that the dye removal using the developed composites involved a physical adsorption process.37 The obtained parameters from isotherms would be beneficial for the design of large-scale applications.
To evaluate dye removal using composites and understand its underlying mechanism, it was essential to determine thermodynamic parameters, including entropy (ΔS°), enthalpy (ΔH°), and Gibbs free energy (ΔG°). Understanding these parameters is essential for designing large-scale systems and provides valuable insights into the energy changes associated with adsorption. The thermodynamic parameters can be calculated by applying van 't Hoff and Gibbs's free energy equations.37 The experimental results gathered across solution temperatures ranging from 15 to 40 °C were linearly fitted to the van 't Hoff equation (Fig. S10 and S11†), and the resulting parameters are shown in Table 7. Negative ΔH° values of −19.54 and −7.75 kJ mol−1 were observed for MO and MB removal, respectively using AlGC, while −24.25 and −11.00 kJ mol−1 were observed for MO and MB removal, respectively using FeGC. These values collectively indicated that the dye removal process using AlGC and FeGC was exothermic and followed physical adsorption. The estimated standard entropy ΔS° was negative for both dyes' adsorption on the developed composites, demonstrating the reversibility of the adsorption process and the decrease in the degree of randomization at the solid–liquid interface as temperature increased.70,71
| T (°C) | q e (mg g−1) | K c | ΔG° (kJ mol−1) | ΔS° (J mol−1 K−1) | ΔH° (kJ mol−1) | R 2 | |
|---|---|---|---|---|---|---|---|
| AlGC | |||||||
| MO | 15 | 472 | 16.85 | −7.09 | −43.23 | −19.54 | 0.67 |
| 20 | 471 | 16.24 | −6.87 | ||||
| 25 | 470 | 15.66 | −6.66 | ||||
| 30 | 468 | 14.62 | −6.44 | ||||
| 35 | 463 | 12.51 | −6.23 | ||||
| 40 | 444 | 7.928 | −6.01 | ||||
| MB | 15 | 278 | 1.25 | −0.81 | −24.11 | −7.75 | 0.89 |
| 20 | 276 | 1.23 | −0.69 | ||||
| 25 | 275 | 1.22 | −0.57 | ||||
| 30 | 263 | 1.10 | −0.45 | ||||
| 35 | 256 | 1.04 | −0.33 | ||||
| 40 | 247 | 0.97 | −0.20 | ||||
| FeGC | |||||||
| MO | 15 | 459 | 11.19 | −6.05 | −63.18 | −24.25 | 0.79 |
| 20 | 455 | 10.11 | −5.73 | ||||
| 25 | 449 | 8.80 | −542 | ||||
| 30 | 438 | 7.06 | −5.10 | ||||
| 35 | 425 | 5.66 | −4.79 | ||||
| 40 | 421 | 5.32 | −4.47 | ||||
| MB | 15 | 287 | 1.34 | −0.71 | −35.75 | −11.00 | 0.97 |
| 20 | 277 | 1.24 | −0.53 | ||||
| 25 | 269 | 1.16 | −0.35 | ||||
| 30 | 255 | 1.04 | −0.17 | ||||
| 35 | 247 | 0.97 | 0.004 | ||||
| 40 | 244 | 0.95 | 0.18 | ||||
The negative value of Gibbs free energy (ΔG°) within the temperature ranges affirming the dye adsorption process is highly favorable and spontaneous. However, with increased temperature, the adsorption process was unfavorably impacted, favoring desorption and reducing its spontaneity. This is explained by the rise in ΔG° values, and an associated reduction in equilibrium constant (KC) values.28,72 Overall, thermodynamic studies show the higher affinity of dye molecules at lower temperatures for dye adsorption utilizing the developed composites.
3.6. The plausible adsorption mechanism of dye on the composite
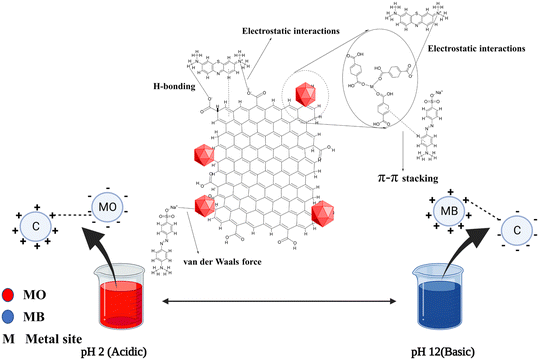
The GO–MOF composite modified by MP extract has a diverse range of functional groups (–OH, –COOH, C![[double bond, length as m-dash]](https://www.rsc.org/images/entities/char_e001.gif) O) and metal sites (uncoordinated Fe3+ and Al3+), which may facilitate the dye removal through hydrogen bonding, van der Waals force, π–π interaction, and intense interaction bond creation between the dye molecule and the composite surface.74,75 To delve deeper into understanding the adsorption mechanism, XPS analysis was employed to verify the changes in AlGC and FeGC before and after dye adsorption. After adsorption, the interactions between the dye molecules and the composite surface can be seen to have caused a modest shift in binding energy in the C 1s and O 1s peaks of the AlGC and FeGC composites, respectively (Fig. 9 and 10). The observed shifts in peak positions suggest that the chemical bonding between the dye molecules and the composite material may involve electrostatic, hydrogen bonding, and π–π interactions, potentially leading to substantial alterations.76 In addition, the data also showed a change in the N 1s peaks and the emergence of S 1s peaks, indicating the successful binding of dye molecules to the composite material. Moreover, the involvement of metallic elements in the adsorption of dye molecules was detected (Fig. 9 and 10). A noticeable change in binding energy and the appearance of new peaks associated with the metallic elements indicate alterations in the chemical states of these specific elements after dye adsorption.76 The schematic representation of probable sorption mechanisms for the adsorption of the dyes on the AlGC and FeGC surface is shown in Fig. 15. The findings from the analysis of adsorption kinetics and isotherms indicated the physical adsorption of dyes on AlGC and FeGC. Moreover, the adsorption of dyes is predominantly influenced by the solution's pH level and the composite's surface charge, which is dictated by the surface functional groups.
O) and metal sites (uncoordinated Fe3+ and Al3+), which may facilitate the dye removal through hydrogen bonding, van der Waals force, π–π interaction, and intense interaction bond creation between the dye molecule and the composite surface.74,75 To delve deeper into understanding the adsorption mechanism, XPS analysis was employed to verify the changes in AlGC and FeGC before and after dye adsorption. After adsorption, the interactions between the dye molecules and the composite surface can be seen to have caused a modest shift in binding energy in the C 1s and O 1s peaks of the AlGC and FeGC composites, respectively (Fig. 9 and 10). The observed shifts in peak positions suggest that the chemical bonding between the dye molecules and the composite material may involve electrostatic, hydrogen bonding, and π–π interactions, potentially leading to substantial alterations.76 In addition, the data also showed a change in the N 1s peaks and the emergence of S 1s peaks, indicating the successful binding of dye molecules to the composite material. Moreover, the involvement of metallic elements in the adsorption of dye molecules was detected (Fig. 9 and 10). A noticeable change in binding energy and the appearance of new peaks associated with the metallic elements indicate alterations in the chemical states of these specific elements after dye adsorption.76 The schematic representation of probable sorption mechanisms for the adsorption of the dyes on the AlGC and FeGC surface is shown in Fig. 15. The findings from the analysis of adsorption kinetics and isotherms indicated the physical adsorption of dyes on AlGC and FeGC. Moreover, the adsorption of dyes is predominantly influenced by the solution's pH level and the composite's surface charge, which is dictated by the surface functional groups.
The changes associated with the dye molecules' adsorption on the composite surface were analyzed by FTIR spectroscopy (Fig. 7 and 8). The obtained spectra after dye adsorption were compared with the recorded spectra of pure composites and some distinct changes were observed after dye adsorption. The broad and highly intense peak observed between 3600 and 3200 cm−1 before dye adsorption was changed to a less intense peak with a shift in spectral position due to the overlapping of dye molecules and participation of H-bonding in the adsorption process.77 The new peaks at 1367 cm−1 and 1600 cm−1 after MO adsorption are due to the SO3− and phenyl groups, suggesting the possible electrostatic and n–π interaction between the composite and MO.78 After MB adsorption, the slight change in intensity and frequency of the band related to –OH groups (3600–3200 cm−1) resulted from the bonding of surface hydroxyl groups present on the composite with the N atoms of the MB dye molecules. The new peak at 885 cm−1 was related to hydrogen bonding between the dye molecules and composite.79 In addition, the new peaks and changes in spectra frequencies confirmed the dye molecules' adsorption on the composite surface.77
3.7. Competitive adsorption studies
Typically, numerous dyes are present in textile industry effluents, and because dyes may compete with one another, thus the performance of developed composites might vary considerably in the presence of more than one dye. Investigating the composite's selectivity toward particular dyes present in the effluent is crucial. Among the tested dyes, the highest adsorption capacity was observed for MO, with a value of 64 ± 5 and 125.17 ± 9 mg g−1, followed by 15 ± 2.5 and 87.31 ± 6 mg g−1 for MB using AlGC and FeGC, respectively, in a binary system of MO and MB.However, a distribution coefficient (Kd) is required to comprehend the competitive adsorption between these dyes in the solution. The Kd value can be approximated by comparing the dye concentration in the solid phase to that in the equilibrium solution, which can be calculated using eqn (3).
 | (3) |
3.8. Regeneration studies
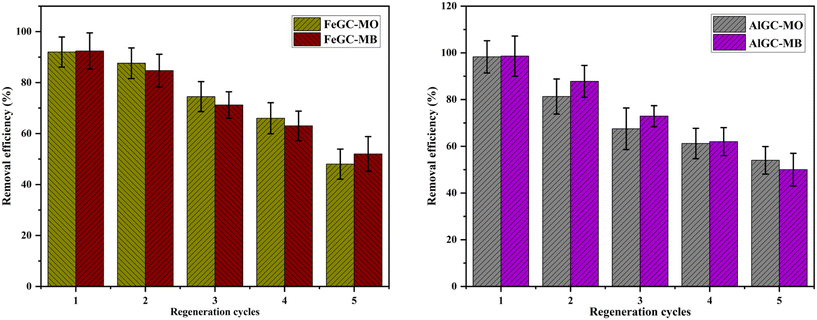
The efficacy of a composite saturated with dye molecules was evaluated through adsorption–desorption experiments using an acid–solvent mixture as a regenerating agent. Literature studies have revealed that the combination of acid and ethanol mixture effectively removes cationic and anionic dyes from the composite surface.80 The reusability of the composite was tested through five successful adsorption–desorption cycles (Fig. 16). Despite the slight drop observed in removal efficiency after the first cycle (<20%), the regenerated composite continued to display ∼50% removal efficiency towards dyes at the 5th adsorption–desorption cycle. The results from the adsorption–desorption experiments indicated that the composite could be regenerated and reused multiple times, making it an economical and promising material for industrial applications.3.9. Environmental toxicity studies
The rapid progress in composite synthesis and its release into the environment without being tested for its antimicrobial and toxic effects has led to rising environmental concerns. Therefore, it is highly relevant to determine the toxic effects of composites on various soil microbes.| Sample | E. coli cell count (CFU mL−1) | Sample | B. subtilis cell count (CFU mL−1) | ||
|---|---|---|---|---|---|
| Initial | After 12 h of treatment | Initial | After 12 h of treatment | ||
| Control | ∼27.8 × 10⁸ | ∼132 × 109 | Control | ∼51 × 107 | ∼65 × 108 |
| AlGC | ∼27.8 × 10⁸ | ∼127 × 109 | AlGC | ∼51 × 107 | ∼58 × 108 |
| FeGC | ∼27.8 × 10⁸ | ∼129 × 109 | FeGC | ∼51 × 107 | ∼68 × 107 |
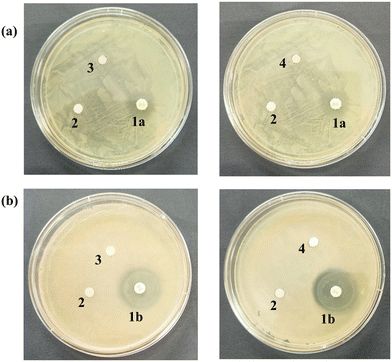
Furthermore, the assay demonstrated that, in contrast to the positive control (antibiotics) and the negative control (sterile distilled water), the examined bacterial and fungal species did not exhibit any zone of inhibition (Fig. 17). Therefore, based on the obtained results, it can be inferred that the composites had no detrimental effect on the ecologically significant soil microorganisms.28,81
The Al-MOF structure was directly retrieved from the Cambridge Crystallographic Data Centre (CCDC) with the identifier CCDC: 220475. However, for the Fe-MOF structure, it was not available in the CCDC database. Therefore, a Cr-MOF structure (CCDC: 605510) was used as a basis, and Cr atoms in the structure were replaced with Fe atoms to create the Fe-MOF model structure.
The MOF–GO composite structure was developed by combining the GO structure with the MOF structure using VESTA and Marvin (Fig. 18).82 Subsequently, the composite structures were refined using UCSF Chimera for optimization and improvement.55
AlG displayed a binding energy of −2.85 kcal mol−1 for the protein target of Bacillus subtilis–FtsZ. Table 9 displays the bonded and non-bonded interactions between residues in the active site region and the composites.
| Protein targets | Ligands | Binding energy (kcal mol−1) | Interacting residues |
|---|---|---|---|
| Bacillus subtilis-FtsZ | AlG | −2.85 | SER152, ASP167, GLU251 |
| FeG | −2.66 | ARG168, ALA252 | |
| Escherichia coli-GyraseB | AlG | −2.15 | TYR26, VAL118 |
| FeG | −2.75 | MET25, TYR26, GLY119 |
The hydrogen bonds (H-bonds) were formed between AlG and the active site regions of the protein target along with the residues of SER152, ASP167, and GLU251 with a bond length (donor–acceptor distance) of 2.87, 3.19, and 2.98 Å, respectively [Fig. 19a(i)]. Similarly, FeG exhibited a binding energy of −2.66 kcal mol−1, with observed H-bond interactions with ARG168 and ALA252 residues with a bond length of 2.77 and 2.98 Å, respectively, and possessed a binding energy of −2.66 kcal mol−1 [Fig. 19a(ii)]. The composite framework exhibited the least binding affinity with the tested protein target of Bacillus subtilis–FtsZ.
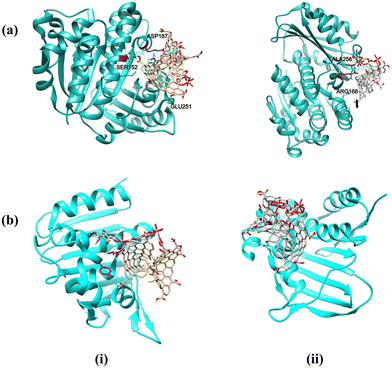 | ||
| Fig. 19 Molecular docking and visualization of (a) Bacillus subtilis-FtsZ, and (b) Escherichia coli-GyraseB with (i) AlG and (ii) FeG structure models. | ||
Similarly, in the context of the GyraseB protein target of Escherichia coli, the AlG model structure established an interaction with a binding energy of −2.15 kcal mol−1 (Table 9). The interaction involved forming H-bonds with TYR26 and VAL118 residues of the targeted protein, with bond lengths of 2.93 and 3.2 Å, respectively [Fig. 19b(i)]. On the other hand, FeG engaged with the MET25, TYR26, and GLY119 residues by forming H-bonds, with estimated bond lengths of 2.8, 3.34, and 3.5 Å, and exhibited a binding energy of −2.75 kcal mol−1 [Fig. 19b(ii)]. The atoms in the framework of AlG and FeG achieved fewer substantial interactions with the GyraseB protein target.
Overall, the comprehensive studies on antimicrobial activity and molecular docking analysis have unequivocally demonstrated that the tested composites (AlG and FeG) exerted no detrimental effect on the targeted microorganisms, i.e., Bacillus subtilis and Escherichia coli. Moreover, the interactions between these compounds and the protein target were found to be relatively weak, indicating a limited affinity. These findings emphasize that the developed composites have no detrimental effects on the soil-beneficial organisms, suggesting the environmental friendliness of the developed composites.
3.10. Comparison with other adsorbents
Table 10 compares the maximum adsorption capacity of the developed MOF–GO composites for MO and MB dyes and the status of an ecotoxicity analysis against other reported adsorbents in the literature. The results demonstrated significantly higher dye adsorption values of 577 ± 37 and 631 ± 42 mg g−1 for MO and 336 ± 13 and 387 ± 7 mg g−1 for MB using the composites AlGC and FeGC, respectively, compared to the previously reported MOF-based adsorbents. This enhancement can be attributed to surface functionalization with phytochemical extract. To the best of our knowledge, the present study evaluated for the first time the eco-friendliness of MOF-based composites by antimicrobial activity as well as molecular docking-based ecotoxicity assessment.| Adsorbent | Dye(s) | Q max (mg g−1) | Toxicity status | Ref. |
|---|---|---|---|---|
| Fe3O4@MIL-101@PPI | MO | 109 | NA | 32 |
| MB | 219 | |||
| UiO-66-NO2 | MO | 142.9 | NA | 83 |
| MB | 41.7 | |||
| MoS2–COOH@UiO-66-NH2 | MO | 16.7 | NA | 33 |
| MB | 253 | |||
| Co(II)-MOF | MO | 52.27 | NA | 84 |
| MB | 64.13 | |||
| Fe3O4@UiO-66 | MO | 244 | NA | 34 |
| MB | 205 | |||
| ZIF-67 composite | MO | 180.50 | NA | 85 |
| MB | 57.24 | |||
| Fe@Ni-MOF–2COOH | MO | 225.15 | NA | 86 |
| MB | 45.35 | |||
| Fe@Cu-MOF–2COOH | MO | 20.32 | NA | 86 |
| MB | 45.35 | |||
| Polyoxometalate/CoFe2O4/MIL-101(Cr) | MB | 200 | NA | 87 |
| AlGC | MO | 577 ± 37 | Ecofriendly | Present study |
| MB | 336 ± 13 | |||
| FeGC | MO | 631 ± 42 | Ecofriendly | Present study |
| MB | 387 ± 7 |
3.11. Cost analysis
The material costs are crucial for determining the financial implications of large-scale industrial operations. Table 11 provides the details of material costs to synthesize AlGC and FeGC composites. The cost of synthesizing 1 g of AlGC and FeGC from industrial-grade chemicals has been estimated to be INR 32.84 (0.39 USD) and INR 12.5 (0.15 USD), respectively. Interestingly, based on the maximum dye sorption capacity, the estimated cost of AlGC and FeGC to remove 1 g of dye has been estimated as INR 56.8 (0.68 USD) & INR 51.88 (0.62 USD) for MO, and INR 37.12 (0.44 USD) & INR 32.25 (0.39 USD) for MB, respectively. This cost is found to be the lowest in comparison to the other MOF-based sorbent materials commonly used in wastewater treatment.88 This lowest cost could be attributed to the possibility of using waste resources as raw materials for the synthesis of AlGC and FeGC and their higher dye adsorption capacity. Moreover, FeGC emerges as a highly effective low-cost adsorbent compared to AlGC, indicating the potential low-cost adsorbent option for removing dyes (MO & MB) from industrial effluent.| S. No. | Components | Quantity required to make 1.0 g of AlGC | Quantity required to make 1.0 g of FeGC | Unit cost (industrial grade)/g or mL (INR) | Make | Actual cost AlGC/FeGC (INR) | Total cost for making AlGC/FeGC (INR) |
|---|---|---|---|---|---|---|---|
| 1 | TPA | 1.37 g | 0.75 g | — | — | — | 32.84/12.5 |
| 2 | PET bottles | 6.87 g | 3.76 g | — | — | — | |
| 3 | NaOH | 3.44 g | 1.88 g | 0.019 | A B Enterprises, India | 0.065/0.035 | |
| 4 | DMF | 97.5 mL | 69.7 mL | 0.175 | Gayatri Industries, India | 17/12 | |
| 5 | HCl | 0.119 mL | 0.68 mL | 0.005 | Alpha Chemika, India | 0.0005/0.003 | |
| 6 | Al (NO3)3·9H2O | 2.09 g | — | — | — | — | |
| 7 | Aluminum foil | 6.98 g | — | — | — | — | |
| 8 | HCl | 69.7 mL | — | 0.005 | Alpha Chemika, India | 0.34/– | |
| 9 | HNO3 | 139.4 mL | — | 0.109 | Golden Trading Co., India | 15/– | |
| 10 | FeCl3·6H2O | — | 2.45 g | 0.034 | Sudharshan Chem | –/0.008 | |
| 11 | GO | 0.104 g | 0.123 g | — | — | — | |
| 12 | HCl | 4.93 mL | 4.93 mL | 0.005 | Alpha Chemika, India | 0.02/0.02 | |
| 13 | Graphite | 0.069 g | 0.082 g | 0.08 | Ecosense Labs India Pvt. Ltd., India | 0.005/0.006 | |
| 14 | H2SO4 | 1.36 mL | 1.75 mL | 0.01 | Surya Fine Chem, India | 0.01/0.01 | |
| 15 | NaNO3 | 0.034 g | 0.04 g | 0.053 | Vrushabh Enterprise, India | 0.001/0.002 | |
| 16 | H3PO4 | 0.153 mL | 0.17 mL | 0.12 | Meru Chem Pvt. Ltd., India | 0.018/0.02 | |
| 17 | KMnO4 | 0.209 g | 0.244 g | 0.295 | Sai Chemicals, India | 0.06/0.07 | |
| 18 | H2O2 (30% w/v) | 0.17 mL | 0.17 mL | 1.98 | ARK Chemicals, India | 0.33/0.33 |
4. Conclusions
In conclusion, Moringa oleifera leaves powder extract functionalized composites exhibited maximum adsorption capacity for MO (AlGC: 580 ± 9.8 and FeGC: 470 ± 9.7 mg g−1) and MB (AlGC: 320 ± 10.9 and FeGC: 350 ± 11.28 mg g−1) dyes in comparison to the other tested adsorbents. Composite mass and initial dye concentration were established as significant factors for the maximum adsorption of dyes by Taguchi optimization. The optimal conditions for maximizing the removal of MO dye using AlGC and FeGC composites were achieved at 30 min, 10 mg dosage, and 30 °C through Taguchi optimization. Similarly, for MB dye, the optimal parameters were 120 min, 10 mg dosage, and 30 °C. The maximum dye adsorption capacity under optimum conditions was obtained as 483.29 & 477.67 mg g−1 for MO and 294.08 and 291.84 mg g−1 for MB with AlGC and FeGC composites, respectively. The significant presence of –OH, C![[double bond, length as m-dash]](https://www.rsc.org/images/entities/char_e001.gif) O, and –COOH functional groups on functionalized composite surfaces acted as active sites for the enhanced MO and MB adsorption due to the electrostatic attraction (here, incorporate conclusion based on BET, TGA and XPS analysis before and after adsorption). Kinetic, isotherm, and thermodynamic modeling results suggested that the MO and MB adsorption on the composite surface was a physical, spontaneous, and exothermic process. The Langmuir isotherm model confirmed monolayer coverage of MO and MB over the surface of the composite. The synthesized composites showed more than ∼65% dye removal efficiency after three adsorption–desorption cycles, which indicates their applicability at large-scale operations. The antimicrobial activity and molecular docking analysis confirmed the non-toxicity of composites as they demonstrated very low affinity towards the targeted microorganisms, i.e., Bacillus subtilis and Escherichia coli, which indicates their safe use and disposal in a natural soil environment. The cost study established that FeGC outperforms AlGC as a highly efficient low-cost adsorbent, suggesting a possible low-cost adsorbent choice for the removal of dyes (MO & MB) from industrial wastewater.
O, and –COOH functional groups on functionalized composite surfaces acted as active sites for the enhanced MO and MB adsorption due to the electrostatic attraction (here, incorporate conclusion based on BET, TGA and XPS analysis before and after adsorption). Kinetic, isotherm, and thermodynamic modeling results suggested that the MO and MB adsorption on the composite surface was a physical, spontaneous, and exothermic process. The Langmuir isotherm model confirmed monolayer coverage of MO and MB over the surface of the composite. The synthesized composites showed more than ∼65% dye removal efficiency after three adsorption–desorption cycles, which indicates their applicability at large-scale operations. The antimicrobial activity and molecular docking analysis confirmed the non-toxicity of composites as they demonstrated very low affinity towards the targeted microorganisms, i.e., Bacillus subtilis and Escherichia coli, which indicates their safe use and disposal in a natural soil environment. The cost study established that FeGC outperforms AlGC as a highly efficient low-cost adsorbent, suggesting a possible low-cost adsorbent choice for the removal of dyes (MO & MB) from industrial wastewater.
Abbreviations
| q exp | Achieved/experimental adsorption capacity |
| Q m | Adsorption Affinity |
| K F | Adsorption capacity |
| q | Adsorption capacity |
| 1/n | Adsorption intensity |
| E | Adsorption intensity |
| α | Adsorption rate |
| AlGC | Al-MOF/GO composite |
| Al-MOF | Aluminium terephthalate MOF |
| Al | Aluminum |
| Al3+ | Aluminum ion with +3 oxidation state |
| Al(NO3)3 | Aluminum nitrate |
| Al(NO3)3·9H2O | Aluminum nitrate nonahydrate |
| NH2–TPA | Amino–terephthalic acid |
| AR | Analytical grade |
| ∼ | Approximation |
| BJH | Barrett–Joyner–Halenda |
| BET | Brunauer–Emmett–Teller |
| CCDC | Cambridge Crystallographic Data Centre |
| C | Carbon |
| C–H | Carbon–hydrogen bond |
C![[double bond, length as m-dash]](https://www.rsc.org/images/entities/char_e001.gif) O O | Carboxyl group |
| –COOH | Carboxylic acid |
| R 2 | Coefficient of determination |
| CFU | Colony forming unit |
| C | Concentration |
| β | Desorption rate |
| dia | Diameter |
| K d | Distribution coefficient |
| D–R | Dubinin–Radushkevich |
| EDS | Energy dispersive spectroscopy |
| K C | Equilibrium constant |
| EG | Ethylene glycol |
| FeG | Fe-MOF/GO composite |
| FESEM | Field emission scanning electron microscope |
| C f | Final concentration |
| F-test | Fisher's test |
| FTIR | Fourier-transform infrared spectroscopy |
| AlGC | Functionalized Al-MOF/GO composite |
| FeGC | Functionalized Fe-MOF/GO composite |
| g | Grams |
| GO | Graphene oxide |
| B | Heat of adsorption |
| h | Hours |
| HCl | Hydrochloric acid |
| H2O2 | Hydrogen peroxide |
| –OH | Hydroxyl groups |
| C 0 | Initial concentration |
| Fe | Iron |
| FeCl3·6H2O | Iron chloride hexahydrate |
| Fe3+ | Iron ion with +3 oxidation state |
| Fe-MOF | Iron terephthalate MOF |
| Fe–O | Iron–oxygen bond interaction |
| K | Kelvin |
| MOF | Metal organic framework |
| MO | Methyl orange |
| MB | Methylene blue |
| mcg/disc | Micrograms per disc |
| μL | Microlitre |
| mL | Milliliters |
| mg | Milligram |
| min | Minutes |
| M | Molarity |
| MP | Moringa powder |
| DMF | N,N-Dimethyl formamide |
| HNO3 | Nitric acid |
| No. | Number |
| n | Number of tests |
| OFAT | One factor at a time |
| η opt | Optimized S/N ratio's total mean |
| O | Oxygen |
| pHZPC | pH at zero-point charge |
| H3PO4 | Phosphoric acid |
| PET | Polyethylene terephthalate |
| pH | Potential of hydrogen |
| q pred | Predicted adsorption capacity |
| R opt | Predicted response |
| k 1 and k2 | Rate constants |
| P/P0 | Ratio of absolute pressure to the saturation vapor pressure |
| RPM | Rotations per minute |
(![[small eta, Greek, macron]](https://www.rsc.org/images/entities/i_char_e0c8.gif) i) i) | S/N ratio's mean at the optimum level |
| η m | S/N ratio's total mean |
| SEM | Scanning electron microscopy |
| R L | Separation constant |
| S/N | Signal-to-noise |
| NaOH | Sodium hydroxide |
| ΔH° | Standard enthalpy |
| ΔS° | Standard entropy |
| ΔG° | Standard Gibbs free energy |
| TPA | Terephthalic acid |
| y i | The individual's adsorption capacity at the ‘ith’ experiment |
| MTCC | The Microbial Type Culture Collection and Gene Bank |
| 3D | Three dimension |
| 2D | Two dimension |
| UV-vis | Ultraviolet visible spectroscopy |
| v/v | Volume/volume |
| wt% | Weight percentage |
| XRD | X-ray diffraction |
Author contributions
Anil Kumar K.: conceptualization, methodology, experimentation, investigation, data curation, writing – original document, formal analysis, reviewing, and editing. Arpit Bisoi: experimentation, data curation. Yeshwanth M.: molecular docking studies, writing. Shobham: antibacterial studies, writing. Mohan Jujaru: reviewing and editing. Jitendra Panwar: conceptualization, supervision, reviewing, and editing. Suresh Gupta: conceptualization, supervision, reviewing, and editing.Conflicts of interest
There are no conflicts to declare.Acknowledgements
The authors thank the Birla Institute of Technology and Sciences, Pilani, for providing experimental and analytical facilities.References
- E. R. Jones, M. T. H. van Vliet, M. Qadir and M. F. P. Bierkens, Earth Syst. Sci. Data, 2021, 13, 237–254 CrossRef.
- M. Bilal, J. Ali, K. Bibi, S. B. Khan, M. Saqib, R. Saeed, R. Javeria, H. Khan, K. Akhtar and E. M. Bakhsh, Ind. Crops Prod., 2022, 187, 115267 CrossRef CAS.
- R. R. Karri, M. Tanzifi, M. Tavakkoli Yaraki and J. N. Sahu, J. Environ. Manage., 2018, 223, 517–529 CrossRef CAS PubMed.
- U. Maheshwari and S. Gupta, Process Saf. Environ. Prot., 2016, 102, 547–557 CrossRef CAS.
- L. Mouni, L. Belkhiri, J.-C. Bollinger, A. Bouzaza, A. Assadi, A. Tirri, F. Dahmoune, K. Madani and H. Remini, Appl. Clay Sci., 2018, 153, 38–45 CrossRef CAS.
- M. Yadav, R. Gupta and R. K. Sharma, in Advances in Water Purification Techniques, Elsevier, 2019, pp. 355–383 Search PubMed.
- R. Bouchareb, K. Derbal, Y. Özay, Z. Bilici and N. Dizge, J. Water Process Eng., 2020, 37, 101521 CrossRef.
- J. Wu, J. Wang, Y. Du, H. Li and X. Jia, J. Nanopart. Res., 2016, 18, 191 CrossRef.
- M. M. Sabzehmeidani, S. Mahnaee, M. Ghaedi, H. Heidari and V. A. L. Roy, Mater. Adv., 2021, 2, 598–627 RSC.
- J. Shu, S. Cheng, H. Xia, L. Zhang, J. Peng, C. Li and S. Zhang, RSC Adv., 2017, 7, 14395–14405 RSC.
- S. E. Lakroun, K. Boutemak, A. Haddad, E. M. Bouchareb and R. Bouchareb, Energy Sources, Part A, 2023, 45, 3138–3153 CrossRef CAS.
- H.-C. “Joe” Zhou and S. Kitagawa, Chem. Soc. Rev., 2014, 43, 5415–5418 RSC.
- A. D. Pournara, A. Margariti, G. D. Tarlas, A. Kourtelaris, V. Petkov, C. Kokkinos, A. Economou, G. S. Papaefstathiou and M. J. Manos, J. Mater. Chem. A, 2019, 7, 15432–15443 RSC.
- R. Ettlinger, U. Lächelt, R. Gref, P. Horcajada, T. Lammers, C. Serre, P. Couvreur, R. E. Morris and S. Wuttke, Chem. Soc. Rev., 2022, 51, 464–484 RSC.
- J. Zolgharnein and S. Dermanaki Farahani, J. Chemom., 2023, 37, 6–8 Search PubMed.
- A. Aguado, L. Martínez, L. Becerra, M. Arieta-araunabeña, S. Arnaiz, A. Asueta and I. Robertson, J. Mater. Cycles Waste Manage., 2014, 16, 201–210 CrossRef CAS.
- W. Yang, R. Liu, C. Li, Y. Song and C. Hu, Waste Manage., 2021, 135, 267–274 CrossRef CAS PubMed.
- M. Lu, L. Li, S. Shen, D. Chen and W. Han, New J. Chem., 2019, 43, 1032–1037 RSC.
- T. Chowdhury, L. Zhang, J. Zhang and S. Aggarwal, Mater. Adv., 2021, 2, 3051–3059 RSC.
- G. K. Ramesha, A. Vijaya Kumara, H. B. Muralidhara and S. Sampath, J. Colloid Interface Sci., 2011, 361, 270–277 CrossRef CAS PubMed.
- U. Ciesla, D. Demuth, R. Leon, P. Petroff, G. Stucky, K. Unger and F. Schüth, J. Chem. Soc., Chem. Commun., 1994, 1387–1388 RSC.
- H. Itoh and T. Sugimoto, J. Colloid Interface Sci., 2003, 265, 283–295 CrossRef CAS PubMed.
- A. B. Chin and I. I. Yaacob, J. Mater. Process. Technol., 2007, 191, 235–237 CrossRef CAS.
- Y. Abdallah, S. O. Ogunyemi, A. Abdelazez, M. Zhang, X. Hong, E. Ibrahim, A. Hossain, H. Fouad, B. Li and J. Chen, BioMed Res. Int., 2019, 2019, 1–8 Search PubMed.
- B. K. Sharma, B. R. Mehta, V. P. Chaudhari, E. V. Shah, S. Mondal Roy and D. R. Roy, J. Cluster Sci., 2022, 33, 1667–1675 CrossRef CAS.
- R. Bouchareb, K. Derbal and A. Benalia, Water Sci. Technol., 2021, 84, 393–403 CrossRef CAS PubMed.
- R. Bouchareb, K. Derbal, A. Yelfouf, D. Ben Diaf, E. Mahfouf Bouchareb and N. Dizge, Clean: Soil, Air, Water, 2021, 49, 1–7 Search PubMed.
- A. Kumar, K. Shobham, J. Panwar and S. Gupta, Environ. Sci. Pollut. Res., 2022, 30, 61541–61561 CrossRef PubMed.
- B. R. Patra, S. Nanda, A. K. Dalai and V. Meda, Chemosphere, 2021, 285, 131531 CrossRef CAS PubMed.
- M. Nalbant, H. Gökkaya and G. Sur, Mater. Des., 2007, 28, 1379–1385 CrossRef CAS.
- A. S. Yusuff, O. A. Ajayi and L. T. Popoola, Sci. Afr., 2021, 13, e00850 CAS.
- H. S. Far, M. Hasanzadeh, M. Najafi and M. Rabbani, J. Inorg. Organomet. Polym. Mater., 2022, 32, 3848–3863 CrossRef CAS.
- K. Karami, P. Bayat, S. Javadian and M. Saraji, J. Mol. Liq., 2021, 342, 117520 CrossRef CAS.
- S. Ahmadipouya, M. Heidarian Haris, F. Ahmadijokani, A. Jarahiyan, H. Molavi, F. Matloubi Moghaddam, M. Rezakazemi and M. Arjmand, J. Mol. Liq., 2021, 322, 114910 CrossRef CAS.
- A. Kumar, K. Y. Mahesh, J. Panwar and S. Gupta, Environ. Sci. Pollut. Res., 2024, 31, 21545–21567 CrossRef PubMed.
- B. Das, R. Kundu and S. Chakravarty, Mater. Chem. Phys., 2022, 290, 126597 CrossRef CAS.
- A. Kumar, K. M. Yeshwanth, K. Kumar, B. J. Panwar and S. Gupta, J. Environ. Manage., 2022, 307, 114523 CrossRef PubMed.
- S. K. Pradhan, J. Panwar and S. Gupta, J. Environ. Chem. Eng., 2017, 5, 5801–5814 CrossRef CAS.
- H. R. Mahdipoor, R. Halladj, E. Ganji Babakhani, S. Amjad-Iranagh and J. Sadeghzadeh Ahari, RSC Adv., 2021, 11, 5192–5203 RSC.
- L.-L. Hsieh, H.-J. Kang, H.-L. Shyu and C.-Y. Chang, Water Sci. Technol., 2009, 60, 1295–1301 CrossRef CAS PubMed.
- N. Berkane, S. Meziane and S. Aziri, Sep. Sci. Technol., 2020, 55, 278–288 CrossRef CAS.
- S. Gupta and B. V. Babu, Chem. Eng. J., 2009, 150, 352–365 CrossRef CAS.
- A. Z. El-Sonbati, N. F. Omar, M. I. Abou-Dobara, M. A. Diab, M. A. El-Mogazy, S. M. Morgan, M. A. Hussien and A. A. El-Ghettany, J. Mol. Struct., 2021, 1239, 130481 CrossRef CAS.
- S. G. Nozha, S. M. Morgan, S. E. A. Ahmed, M. A. El-Mogazy, M. A. Diab, A. Z. El-Sonbati and M. I. Abou-Dobara, J. Mol. Struct., 2021, 1227, 129525 CrossRef CAS.
- CLSI, Methods for Dilution Antimicrobial Susceptibility Tests for Bacteria That Grow Aerobically; Approved Standard — Ninth Edition, CLSI document M07-A9, Wayne, Clinical and Laboratory Standard Institute, 2012, vol. 32 Search PubMed.
- A. W. Bauer, Arch. Intern. Med., 1959, 104, 208 CAS.
- N. Jain, P. Alam, I. R. Laskar and J. Panwar, RSC Adv., 2015, 5, 61983–61988 RSC.
- S. K. Pradhan, V. Pareek, J. Panwar and S. Gupta, J. Water Process Eng., 2019, 32, 100917 CrossRef.
- A. Allouche, J. Comput. Chem., 2012, 32, 174–182 CrossRef PubMed.
- S. Prasad, L. C. Malav, J. Choudhary, S. Kannojiya, M. Kundu, S. Kumar and A. N. Yadav, Current Trends in Microbial Biotechnology for Sustainable Agriculture, Springer, 2021, pp. 1–21 Search PubMed.
- A. Ortiz and E. Sansinenea, Sustainability, 2022, 14, 5358 CrossRef CAS.
- M. A. Oliva, D. Trambaiolo and J. Löwe, J. Mol. Biol., 2007, 373, 1229–1242 CrossRef CAS PubMed.
- S. Narramore, C. E. M. Stevenson, A. Maxwell, D. M. Lawson and C. W. G. Fishwick, Bioorg. Med. Chem., 2019, 27, 3546–3550 CrossRef CAS PubMed.
- N. Guex and M. C. Peitsch, Electrophoresis, 1997, 18, 2714–2723 CrossRef CAS PubMed.
- E. F. Pettersen, T. D. Goddard, C. C. Huang, G. S. Couch, D. M. Greenblatt, E. C. Meng and T. E. Ferrin, J. Comput. Chem., 2004, 25, 1605–1612 CrossRef CAS PubMed.
- W. L. DeLano, {CCP4} Newsletter On Protein Crystallography, 2002, vol. 40, pp. 1–8 Search PubMed.
- K. Zhu, Y. Liu and J. Liu, RSC Adv., 2014, 4, 42278–42284 RSC.
- F. Ahmadijokani, S. Ahmadipouya, H. Molavi and M. Arjmand, Dalton Trans., 2019, 48, 13555–13566 RSC.
- Z. Liu, W. He, Q. Zhang, H. Shapour and M. F. Bakhtari, ACS Omega, 2021, 6, 4597–4608 CrossRef CAS PubMed.
- M. Majumder, R. B. Choudhary, A. K. Thakur, A. Khodayari, M. Amiri, R. Boukherroub and S. Szunerits, Electrochim. Acta, 2020, 353, 136609 CrossRef CAS.
- J. M. Moreno, A. Velty, U. Díaz and A. Corma, Chem. Sci., 2019, 10, 2053–2066 RSC.
- Q. Xie, Y. Li, Z. Lv, H. Zhou, X. Yang, J. Chen and H. Guo, Sci. Rep., 2017, 7, 3316 CrossRef PubMed.
- J. Rouquerol, D. Avnir, C. W. Fairbridge, D. H. Everett, J. M. Haynes, N. Pernicone, J. D. F. Ramsay, K. S. W. Sing and K. K. Unger, Pure Appl. Chem., 1994, 66, 1739–1758 CrossRef CAS.
- L. Xu, J. Zhang, J. Ding, T. Liu, G. Shi, X. Li, W. Dang, Y. Cheng and R. Guo, Minerals, 2020, 10, 72 CrossRef CAS.
- S. Luo and J. Wang, Environ. Sci. Pollut. Res., 2018, 25, 5521–5528 CrossRef CAS PubMed.
- B. Boukoussa, A. Hakiki, S. Moulai, K. Chikh, D. E. Kherroub, L. Bouhadjar, D. Guedal, K. Messaoudi, F. Mokhtar and R. Hamacha, J. Mater. Sci., 2018, 53, 7372–7386 CrossRef CAS.
- P. Praipipat, P. Ngamsurach and K. Pratumkaew, Arabian J. Chem., 2023, 16, 104640 CrossRef CAS.
- R. Chikri, N. Elhadiri, M. Benchanaa and Y. El Maguana, J. Chem., 2020, 2020(1), 8813420 Search PubMed.
- N. Unlu and M. Ersoz, J. Hazard. Mater., 2006, 136, 272–280 CrossRef PubMed.
- A. Elaziouti and N. Laouedj, J. Korean Chem. Soc., 2011, 55, 208–217 CrossRef CAS.
- T. Shahzadi, S. Sanaullah, T. Riaz, M. Zaib, A. Kanwal and H. Jabeen, Environ. Dev. Sustain., 2021, 23, 17923–17941 CrossRef.
- P. Senthil Kumar, P. S. A. Fernando, R. T. Ahmed, R. Srinath, M. Priyadharshini, A. M. Vignesh and A. Thanjiappan, Chem. Eng. Commun., 2014, 201, 1526–1547 CrossRef CAS.
- A. Pourjavadi, M. Nazari, M. Kohestanian and S. H. Hosseini, Colloid Polym. Sci., 2019, 297, 917–926 CrossRef CAS.
- A. Wathukarage, I. Herath, M. C. M. Iqbal and M. Vithanage, Environ. Geochem. Health, 2019, 41, 1647–1661 CrossRef CAS PubMed.
- M. Shahnawaz Khan, M. Khalid and M. Shahid, Mater. Adv., 2020, 1, 1575–1601 RSC.
- L. Yu, Z. Luo, Y. Zhang, S. Wu, C. Yang and J. Cheng, Environ. Sci. Pollut. Res., 2019, 26, 3685–3696 CrossRef CAS PubMed.
- T. Ainane, F. Khammour, M. Talbi and M. Elkouali, Orient. J. Chem., 2014, 30, 1183–1189 CrossRef CAS.
- N. N. Bahrudin, M. A. Nawi, A. H. Jawad and S. Sabar, J. Polym. Environ., 2020, 28, 1901–1913 CrossRef CAS.
- J. M. Pérez-Morales, G. Sánchez-Galván and E. J. Olguín, Environ. Sci. Pollut. Res., 2019, 26, 5955–5970 CrossRef PubMed.
- X. Zhao, S. Liu, Z. Tang, H. Niu, Y. Cai, W. Meng, F. Wu and J. P. Giesy, Sci. Rep., 2015, 5, 11849 CrossRef PubMed.
- A. G. Femi-Adepoju, A. O. Dada, K. O. Otun, A. O. Adepoju and O. P. Fatoba, Heliyon, 2019, 5, e01543 CrossRef CAS PubMed.
- K. Momma and F. Izumi, J. Appl. Crystallogr., 2011, 44, 1272–1276 CrossRef CAS.
- H. T. Dinh, N. T. Tran and D. X. Trinh, J. Anal. Methods Chem., 2021, 2021, 1–10 Search PubMed.
- H. A. M. Saleh, I. Mantasha, K. M. A. Qasem, M. Shahid, M. N. Akhtar, M. A. AlDamen and M. Ahmad, Inorg. Chim. Acta, 2020, 512, 119900 CrossRef CAS.
- M. A. Nazir, N. A. Khan, C. Cheng, S. S. A. Shah, T. Najam, M. Arshad, A. Sharif, S. Akhtar and A. ur Rehman, Appl. Clay Sci., 2020, 190, 105564 CrossRef CAS.
- M. N. Ahamad, M. S. Khan, M. Shahid and M. Ahmad, Dalton Trans., 2020, 49, 14690–14705 RSC.
- A. Jarrah and S. Farhadi, RSC Adv., 2020, 10, 39881–39893 RSC.
- L. Biswal, J. E. Goodwill, C. Janiak and S. Chatterjee, Sep. Purif. Rev., 2022, 51, 408–426 CrossRef CAS.
Footnote |
| † Electronic supplementary information (ESI) available. See DOI: https://doi.org/10.1039/d4ew00185k |
| This journal is © The Royal Society of Chemistry 2024 |

