“Synergistic effect” based novel and ultrasensitive approach for the detection of serotonin using DEM-modulated bimetallic nanosheets†
Deepak
Dabur
a,
Nallin
Sharma
 b and
Hui-Fen
Wu
 *abcde
aInternational PhD Program for Science, National Sun Yat-Sen University, Kaohsiung, 80424, Taiwan. E-mail: hwu@faculty.nsysu.edu.tw; Fax: +886-7-5253909; Tel: +886-7-5252000-3955
bDepartment of Chemistry, National Sun Yat-Sen University, Kaohsiung, 70, Lien-Hai Road, Kaohsiung, 80424, Taiwan
cSchool of Pharmacy, College of Pharmacy, Kaohsiung Medical University, Kaohsiung, 807, Taiwan
dInstitute of Medical Science and Technology, College of Medicine, National Sun Yat-Sen University, Kaohsiung, 80424, Taiwan
eInstitute of Precision Medicine, College of Medicine, National Sun Yat-Sen University, Kaohsiung, 80424, Taiwan
First published on 9th May 2023
Abstract
Neurotransmitters have been of immense scientific interest due to their importance as human-health biomarkers. Several reports suggest necessary improvisations in the sensing capabilities of these neurotransmitters. Herein, the authors report a novel synthesis methodology for bimetallic aluminum–tungsten (Al–W) nanosheets, with the hybrid nanostructure showing high specificity toward serotonin neurotransmitters. The inspiration to design hybrid metallic nanosheets depends on the inherited optical properties of the parent precursors. The interstate conversion (ISC) between Al–W nanosheets promoted photoluminescent behavior with serotonin. The PL study shows that serotonin drastically enhanced λem at 335 nm. The importance of emission below the visible spectrum is to modulate any possible aggregation-induced emissions, which earlier troubled analytical chemists. The understanding of the selective detection of serotonin from a group of similar neurotransmitters is discussed with nanomolar quantification. The quantified detection limit using Al–W nanosheets is 0.05 nm with high linearity (R2 = 0.9906). Furthermore, real-world quantification studies have been performed on human urine and serum samples with R2 of 0.9938 and 0.9801, respectively.
Introduction
Our physiology is altered by hormones and neurotransmitters, which also control our behavior, hormone levels, sleep, and body temperature. The disruption of the circadian clock could have a major negative impact on our health and mental state.1,2 Serotonin (5-hydroxytryptamine, ST) is a neurotransmitter that is produced in the raphe nuclei of the brainstem and transported to various parts of the brain, playing an important role as a biomarker in several diseases such as depression.3,4 Alzheimer's5 is regarded as the most distinct biomarker for carcinoid tumors,6 atherosclerotic cardiovascular diseases (ASCVD), and chronic heart failure (CHF).7 Abnormal levels of ST also affect sleep patterns, aggression, and appetite control. Numerous mental and neural illnesses, diabetes, vascular problems, and post-traumatic stress disorder,8,9 are triggered by excessive serotonin levels. Thus, the accurate detection of ST is urgently required to research of all diseases related to ST levels. Serotonin is related to tryptophan and melatonin; it acts as a precursor to melatonin, which is a hormone that controls insulin signaling, circadian rhythm, and energy balance.10 Hamon & Glowinski explained the chemistry of tryptophan in the year 1974, which is subsequently converted into serotonin.11 For these reasons, we have tried to detect tryptophan and melatonin also, but satisfactory results were not obtained.To date, serotonin levels were determined using HPLC,12 immunoassays,5,13 chemiluminescence,14,45 machine learning15 radioimmunoassays,16 fluorescence detection,17–21 microdialysis, and fast-scan cyclic voltammetry22,23,46 methods. The risk, diagnostics, pharmacological response, and therapeutic aim of 5-HT levels in cardiac disorders were measured using the HPLC method by Shimokawa's group in 2017.24 In recent years, electrochemical sensing has also been explored to detect serotonin with different types of nanomaterials;6,25 however, the main disadvantage of using electrochemical sensors23 is lack of reusability and reproductively. Although some of the above techniques have shown great selectivity and sensitivity for ST detection, they need complex preparations, are time consuming, and destroy the analytes. At the same time, some require dyes such as labels and molecular frameworks for fluorescent detection. Most of the techniques need very expensive instruments. Therefore, fluorescence sensors are gaining significant attention in biosensing as they are simple and economical sensors with high sensitivity and selectivity.
Utilizing organic precursors for preparing nanomaterials can help in the molecular mixing of metals, prevent the loss of metal salts, and improve the homogeneity of solutions. In addition, this technique can enhance the morphology and texture of nanostructures. To create a symmetrical nanomaterial with high purity and reactivity, metals need more active sites, which are provided by organic precursors,26 this opening new opportunities for the synthesis of bimetallic nanosheets. Diethylmalonate is a nontoxic and convenient natural product that is used in many organic syntheses as it provides mono and disubstitution and leads to a symmetrical and stable structure. It also acts as an intermediate in the synthesis of vitamins, drugs, and agrochemicals.27,28 Thus, considering the aforementioned factors, diethylmalonate (DEM) was used as an organic precursor to prepare the 2D nanosheets.
Therefore, a label-free, cost-effective, and fast operational method is needed for ST detection. Herein, we propose a novel strategy for serotonin detection by the generation of fluorescence-induced “synergistic effect” with the reaction of nonfluorescent nanosheets. We prepared the Al–W bimetallic nanosheets for the detection of ST using the “turn-on fluorescence” method, wherein stronger fluorescent property in serotonin was obtained with simple chemical modifications by the reaction with our novel and cost-effective bimetallic nanosheets. The ultrasonication method was used to synthesize the Al–W nanosheets. We derivatized serotonin with our Al–W nanosheets, which led to drastically enhanced optical properties as compared to earlier reports.47 The synergistic effect can be seen selectively with serotonin, where serotonin reacted with Al–W nanosheets in basic medium (0.1 N NaOH and certain amount of PBS) and produced blue fluorescence at λem 335 nm on λex 300 nm excitation, and an enhancement in fluorescence intensity was observed with increasing ST concentration. The detection limit for the proposed serotonin detection methodology was calculated to be 0.05 nM. We also determined serotonin in other biological fluids such as human urine and blood serum. The selectivity experiment was performed and it was found that serotonin has high selectivity over other amines and neurotransmitters.
Materials and methods
Reagents
Tungsten chloride (WCl4) and aluminum chloride (AlCl3) were purchased from Alfa Aesar, USA. Diethylmalonate (DEM) (99%) was purchased from Lancaster Eastgate, Morecambe, England. All monoamines including serotonin, tryptophan, N-epinephrine, cysteamine, melatonin, lomefloxacin, and dopamine were purchased from Sigma Aldrich, USA.Instrumentation
The optical properties were observed using an EVOLUTION 201 (Thermo SCIENTIFIC, USA) UV-Vis absorption spectrophotometer, while the fluorescence spectra were recorded using a Hitachi Fluorescence Spectrophotometer F-2700 (Hitachi, Japan). The structural characteristics of the nanomaterials were studied using a JEOL (Japan) JEM2100 transmission electron microscope (TEM) and high-angle annular dark-field scanning transmission electron microscopy (HAADF-STEM) imaging. The particle size was determined using an ELSZ-2000 (Otsuka Electronic, Japan) dynamic light scattering (DLS) instrument, and the crystallinity of the material was examined by X-ray diffraction (XRD, Bruker D8 Advance, Philips, Netherlands). Raman measurements were performed by depositing the as-prepared self-assembled samples on a glass substrate using the setup λ = 633 nm laser (JOBIN-YVON T64000, USA), while XPS was performed using an Auger electron spectrometer (JEOL, Japan).Synthesis of bimetallic nanosheets
20 mg WCl4 and 20 mg AlCl3 (1![[thin space (1/6-em)]](https://www.rsc.org/images/entities/char_2009.gif) :
:![[thin space (1/6-em)]](https://www.rsc.org/images/entities/char_2009.gif) 3 moles of W
3 moles of W![[thin space (1/6-em)]](https://www.rsc.org/images/entities/char_2009.gif) :
:![[thin space (1/6-em)]](https://www.rsc.org/images/entities/char_2009.gif) Al) were added into 10 mL DEM and placed for probe sonication for 15 min. The mixture was kept for incubation for further 2 h, and bimetallic nanosheets were then obtained, as shown in Fig. 1. Further, this solution was characterized and used for sensing applications.
Al) were added into 10 mL DEM and placed for probe sonication for 15 min. The mixture was kept for incubation for further 2 h, and bimetallic nanosheets were then obtained, as shown in Fig. 1. Further, this solution was characterized and used for sensing applications.
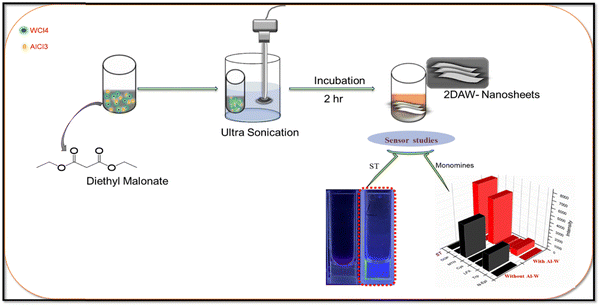 | ||
| Fig. 1 Schematic presentation to show the reaction procedures for the preparation of Al–W nanosheets and sensor studies for the detection of serotonin with the selectivity 3D graph. | ||
Detection of serotonin
Firstly, the initial 10 mM stock solution of serotonin was prepared in 0.1 N NaOH. Afterward, increasing concentration (10 nM–1 mM) of ST from the stock solution was added with 30 μL Al–W Ns, and the solution was diluted with PBS (pH 7.4) to a final volume of 1 mL. Then, the fluorescence emission spectra of the abovementioned solution was recorded at 300 nm excitation wavelength. All the experiments were done three times in parallel to ensure the recorded emission values.Selectivity
To observe the selectivity of the current biosensor toward serotonin, we performed an array of experiment with other biological monoamines neurotransmitters (chemical structures are shown in Fig. S1, ESI†) such as tryptophan, N-epinephrine, cysteamine, melatonin, lomefloxacin, and dopamine with the same concentration in PBS solution as that of serotonin. The fluorescence emission readings were recorded at 300 nm excitation wavelength.Real sample preparation
Again, a stock solution of serotonin was prepared in fresh filtered urine, and then four different concentrations (500 nM, 1 μM, 5 μM, 10 μM) of ST from the above stock solution (in urine) were added into 30 μL Al–W nanosheets. The solution was diluted with PBS to a final volume of 1 mL. The emission readings were recorded at 300 nm excitation. The same experiment was also performed with blood serum sample instead of urine.Results and discussion
Characterization of the bimetallic nanosheets
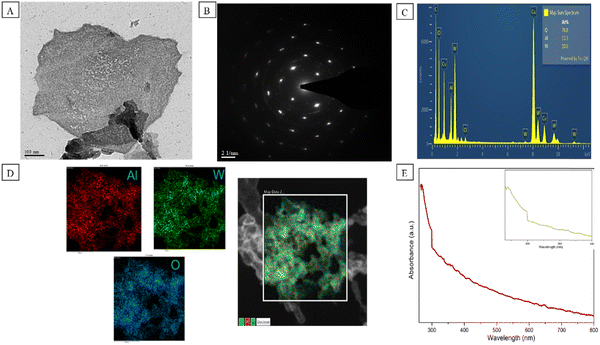
Many structural techniques were used for the characterization of Al–W nanosheets. First, we studied the TEM and HAADF-STEM images to confirm the morphology and size of Al–W nanosheets, as shown in Fig. 2A. Fig. 2A displays the sheet-like structure on a 100 nm scale. The crystalline nature of the nanosheets is evident in Fig. 2B, which confirms the nonhexagonal lattice with the planes (011) and (021) obtained from the SAED pattern. The elements of the nanosheets were confirmed by EDAX (Fig. 2C) with the Al![[thin space (1/6-em)]](https://www.rsc.org/images/entities/char_2009.gif) :
:![[thin space (1/6-em)]](https://www.rsc.org/images/entities/char_2009.gif) W
W![[thin space (1/6-em)]](https://www.rsc.org/images/entities/char_2009.gif) :
:![[thin space (1/6-em)]](https://www.rsc.org/images/entities/char_2009.gif) O ratio of 1.33
O ratio of 1.33![[thin space (1/6-em)]](https://www.rsc.org/images/entities/char_2009.gif) :
:![[thin space (1/6-em)]](https://www.rsc.org/images/entities/char_2009.gif) 1
1![[thin space (1/6-em)]](https://www.rsc.org/images/entities/char_2009.gif) :
:![[thin space (1/6-em)]](https://www.rsc.org/images/entities/char_2009.gif) 7.68. The HAADF-STEM image in Fig. 2D shows the elemental analysis of Al–W nanosheets, where red color is for Al metal, green color for W, and blue color for O. Furthermore, the UV-absorbance peaks are shown for Al–W nanosheets in Fig. 2E, and the spectra shows an intense peak at about 270 nm (inset), indicating the presence of Al29,30 and a small hump at 300 nm, showing the presence of W in bimetallic nanosheets.31 Some controlled experiments were also performed for pure Al and W nanosheets, with W and Al with different 1
7.68. The HAADF-STEM image in Fig. 2D shows the elemental analysis of Al–W nanosheets, where red color is for Al metal, green color for W, and blue color for O. Furthermore, the UV-absorbance peaks are shown for Al–W nanosheets in Fig. 2E, and the spectra shows an intense peak at about 270 nm (inset), indicating the presence of Al29,30 and a small hump at 300 nm, showing the presence of W in bimetallic nanosheets.31 Some controlled experiments were also performed for pure Al and W nanosheets, with W and Al with different 1![[thin space (1/6-em)]](https://www.rsc.org/images/entities/char_2009.gif) :
:![[thin space (1/6-em)]](https://www.rsc.org/images/entities/char_2009.gif) 1 of moles in DEM. The UV absorbance analyses for W and Al separately synthesized in DEM are shown in Fig. S2A and S2B (ESI†) before and after the addition of ST. The fluorescence investigations between W (DEM) and Al (DEM) with and without ST are shown in Fig. S2D and S2E (ESI†). We found that there were no discernible changes in color or intensity even after the addition of ST at a very high concentration (10 mM). From all the control experiments, we found out that a perfect mole ratio of W and Al was required to synthesize the Al–W nanosheets, and the average size of Al–W nanosheets was measured to be 200 nm by DLS, which is shown in Fig. S3 (ESI†).
1 of moles in DEM. The UV absorbance analyses for W and Al separately synthesized in DEM are shown in Fig. S2A and S2B (ESI†) before and after the addition of ST. The fluorescence investigations between W (DEM) and Al (DEM) with and without ST are shown in Fig. S2D and S2E (ESI†). We found that there were no discernible changes in color or intensity even after the addition of ST at a very high concentration (10 mM). From all the control experiments, we found out that a perfect mole ratio of W and Al was required to synthesize the Al–W nanosheets, and the average size of Al–W nanosheets was measured to be 200 nm by DLS, which is shown in Fig. S3 (ESI†).
Next, the μ-Raman spectra of Al–W nanosheets synthesized in DEM were recorded, as shown in Fig. 3A. Four major peaks were observed for Al–W nanosheets. The peaks at 1570 (G band) and 1339 cm−1 are attributed to Al32,33 peaks at 803 and 685 cm−1, showing the Al–W ratio in the nanostructure; we also conducted Raman spectroscopy for the different Al![[thin space (1/6-em)]](https://www.rsc.org/images/entities/char_2009.gif) :
:![[thin space (1/6-em)]](https://www.rsc.org/images/entities/char_2009.gif) W (1
W (1![[thin space (1/6-em)]](https://www.rsc.org/images/entities/char_2009.gif) :
:![[thin space (1/6-em)]](https://www.rsc.org/images/entities/char_2009.gif) 1) ratio. However, as can be seen in Fig. S4 (ESI†), there was no such sign of the presence of W and Al in the nanostructure. In Fig. 3B and Fig. 3C, we carried out X-ray photoelectron spectroscopy (XPS) of Al–W nanosheets. As shown in Fig. 3B and C, the X-ray photoelectron spectroscopy (XPS) study reveals the bonding of oxygen with tungsten and aluminum. The XPS results of W can be fit into three peaks; the two dominating peaks centered at 34.069 and 36.19 eV corresponding to typical binding energies of W 4f with +6 valence state (W 4f7/2 and W 4f5/2, respectively), a small peak at 40.0 eV, confirm the presence of the W 4f in the 5+ state. The presence of W in the +5 state shows the existence of oxygen vacancies, which can be filled by Al.34–37 In Fig. 3C, the XPS peaks of Al 2p are presented. Two shoulders are observed in this spectrum at 72.7 and 73.4 eV binding energies. The major peak at 73.4 eV refers to Al2O3; beside that, a small broadening peak at 72.7 eV is related to Al-metal bonds.38–40 Two peaks for O 1s are shown in Fig. 3D, which clearly featured the presence of asymmetric O 1s in Al–W nanosheets. The most intensive and broad peak at 530.8 eV is related to oxygen present in the lattice (O2−) of W, and the small hump at 528.8 eV also corresponds to metal-oxide, which may refer to Al–O bonds.36,41,42 The survey scan is shown in Fig. S5 (ESI†).
1) ratio. However, as can be seen in Fig. S4 (ESI†), there was no such sign of the presence of W and Al in the nanostructure. In Fig. 3B and Fig. 3C, we carried out X-ray photoelectron spectroscopy (XPS) of Al–W nanosheets. As shown in Fig. 3B and C, the X-ray photoelectron spectroscopy (XPS) study reveals the bonding of oxygen with tungsten and aluminum. The XPS results of W can be fit into three peaks; the two dominating peaks centered at 34.069 and 36.19 eV corresponding to typical binding energies of W 4f with +6 valence state (W 4f7/2 and W 4f5/2, respectively), a small peak at 40.0 eV, confirm the presence of the W 4f in the 5+ state. The presence of W in the +5 state shows the existence of oxygen vacancies, which can be filled by Al.34–37 In Fig. 3C, the XPS peaks of Al 2p are presented. Two shoulders are observed in this spectrum at 72.7 and 73.4 eV binding energies. The major peak at 73.4 eV refers to Al2O3; beside that, a small broadening peak at 72.7 eV is related to Al-metal bonds.38–40 Two peaks for O 1s are shown in Fig. 3D, which clearly featured the presence of asymmetric O 1s in Al–W nanosheets. The most intensive and broad peak at 530.8 eV is related to oxygen present in the lattice (O2−) of W, and the small hump at 528.8 eV also corresponds to metal-oxide, which may refer to Al–O bonds.36,41,42 The survey scan is shown in Fig. S5 (ESI†).
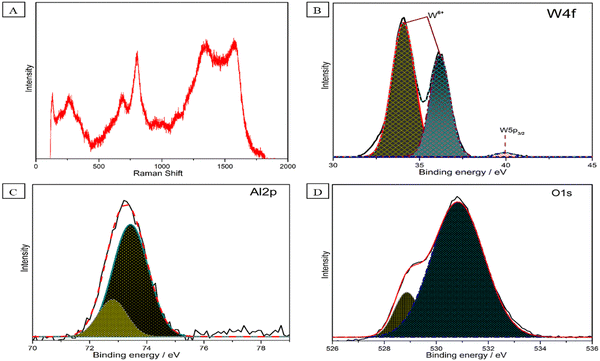 | ||
| Fig. 3 (A) Raman spectra of Al–W nanosheets. XPS spectra fitting of (B) W 4f, (C) Al 2p, and (D) O 1s for Al–W nanosheets. | ||
Sensor performance
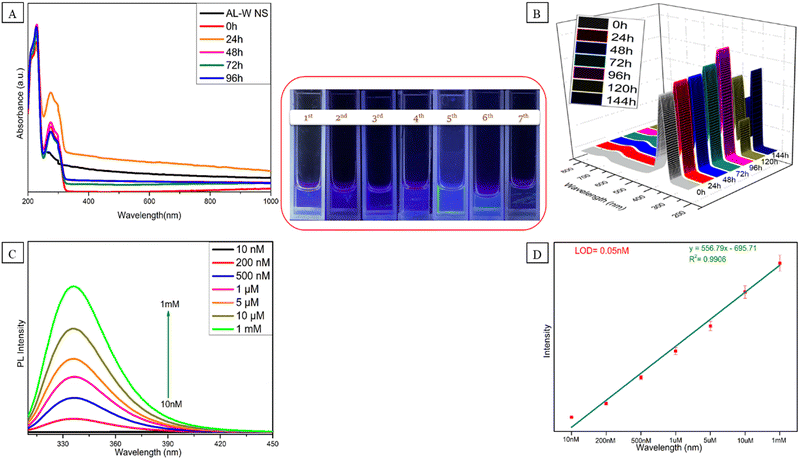
The distinctive characteristics of the Al–W nanosheets after the interaction with serotonin and the interaction of Al–W nanosheets with serotonin was evaluated by UV-Vis absorbance spectroscopy, as shown in Fig. 4A. Fig. 4A shows three broad bands at 209 nm and 230 nm and a peak at 272 nm. First, the absorption peak increase from 200 nm to 250 nm is due to serotonin43,44 and the peak is observed at 272 nm for Al–W nanosheets with a small shift. The presence of ST causes the “turn-on” blue fluorescence emission effect at 335 nm after excitation at 300 nm within a few minutes (Fig. 4B). To check the stability of the sensor with ST, we carried out time-dependent fluorescence studies. As shown in Fig. 4B, the luminescent intensity gradually increases until the 5th day but from the 6th day, it started decreasing, which also can be observed in images under a UV lamp, shown in Fig. 4 inset. To demonstrate the significance of Al–W nanosheets for the generation of fluorescence characteristics in the system, a control experiment for serotonin was also conducted simply using DEM solvent (Fig. S6, ESI†). To investigate the sensitivity of the sensor, we carried out the fluorescence titration experiment by adding different concentrations of serotonin into Al–W nanosheets. We took a broad range of serotonin concentration varying from 10 nanomolar to 1 milimolar. As shown in Fig. 4C, with the increasing addition of ST concentration (10 nM to 1 mM), the fluorescence intensity of solution (Al–W + ST) at 335 nm increased on 300 nm excitation with a linear correlation value (R2) of 0.9906. There is also a strong linear relationship between ST concentration (10 nM−1 mM) and intensity ratio (Fig. 4D). The limit of detection for ST was calculated to be 0.05 nM. We compared the LOD with some previous literature and found out that the LOD of ST in this work is improved up to 10–20 times compared to other reported sensors (Table S1, ESI†). The interaction between Al–W and ST is experimentally proved by the zeta potential results, as shown in Fig. S7 (ESI†). The presence of extremely electron-rich metals causes the zeta potential of Al–W in the buffer solution (PBS) to be −49.72 mV, which induces a general negative charge on the material. However, the measured zeta potential for the Al–W + ST solution is −9.31 mV.Real sample analysis
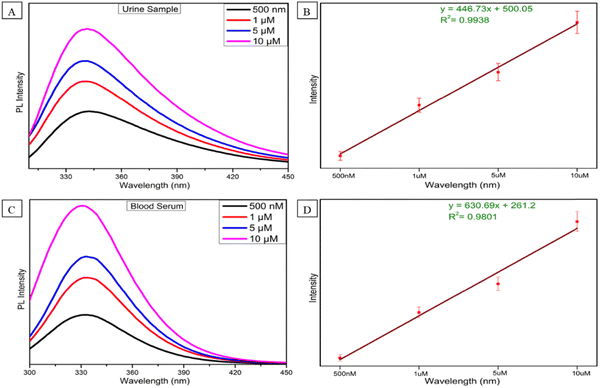
As serotonin is a very important neurotransmitter in human body, after realizing the significance of ST levels in human body and how the alteration of ST level can affect the diagnosis of many critical carcinoid diseases, we further assessed the feasibility of the sensor in human urine and blood serum. Keeping this in mind, we prepared four concentrations (500 nM, 1, 5 and 10 μM) of ST in human urine and blood serum. The emission spectra were recorded in the same way as the above method (Fig. 4C). As shown in Fig. 5A and C, increasing fluorescence response was evaluated by an increase in the concentration from 500 nM to 10 μM in human urine and blood serum samples. In a wide range of serotonin concentrations (500 nM–10 μM), the emission intensity rises linearly with increasing serotonin concentration. The linear regression equation between the concentration of serotonin and intensity for the urine and blood serum samples is also expressed with R2 = 0.9938 and R2 = 0.9801 in Fig. 5B and C, respectively. The recovery results for urine and blood serum samples were also calculated, as shown in Fig. S9 (ESI†). To prove the sensor ability, the developed sensor was compared with the reported sensor based on different methods with their LOD, range, and results, as shown in Table S2 (ESI†). From the previous reported work, it can be concluded that we have developed an ultrasensitive sensor for the detection of serotonin in biological fluids as well and which may be due to the synergistic effect that occurs between Al–W nanosheets and serotonin.To ensure the selectivity of the fluorescence sensor for ST in biological systems, the fluorescence response behavior of the sensor toward several neurotransmitters and biological drugs (norepinephrine, tryptophan, lomefloxacin, cysteamine, melatonin, dopamine, and serotonin) was tested under the experimental conditions. Fluorescence results were taken without and with Al–W nanosheets (grey bar-without Al–W and purple bar-with Al–W), as shown in Fig. 6; only ST showed the obvious results. The reaction with ST instantly showed the turn-on fluorescence effect with a great increase in fluorescence intensity.
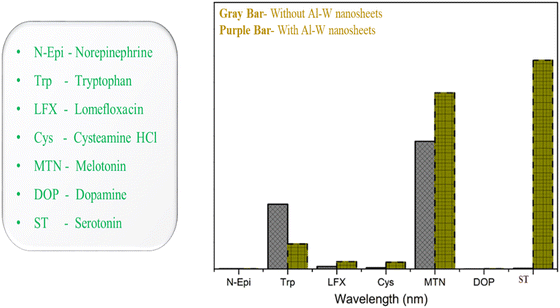 | ||
| Fig. 6 Fluorescence response of the Al–W nanosheets toward ST and a variety of interfering substances (gray bar-without nanosheets, purple bar-with nanosheets). | ||
However, there were no significant changes with other neurotransmitters and PL emission spectra, and the images related to each monoamine taken under UV lamp are shown in Fig. S8 (ESI†). Melatonin caused a slight increase in fluorescence after reaction with the analyte (Al–W nanosheets). Thus, the developed method showed satisfactory results only for ST and confirmed the selectivity for ST. From the above results, the Al–W nanosheets showed the greatest affinity and ultrasensitivity toward serotonin in comparison with the literature (Table S1 and S2, ESI†).
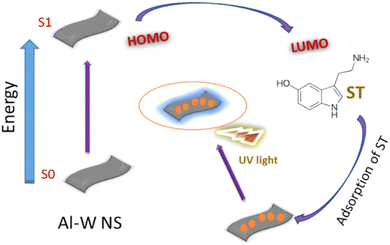
After concluding all the results, the possible mechanism for luminescence can be attributed to the synergistic effect. By looking at the UV spectra and zeta potential results before and after the addition of ST in Al–W nanosheets, it is possible that because of the presence of highly rich electrons metals such as W and Al in a certain ratio mentioned above, the spin state of W can lead to the delocalization of the spin states of Al, which may increase the Al electron density and improve the adsorption behavior of the Al–W nanosheets. Thus, these electrons can be transferred from the Al–W nanosheets to the LUMO of ST, and serotonin's intrinsic fluorescence, which comes from its indole moiety, can be used to analyze it. Finally, the turn on fluorescence effect occurs with high emission intensity (Fig. 7).
Conclusion and future road
As highlighted in this article, the clinical significance of serotonin is very crucial and important for the diagnosis and treatment of the expanding range of diseases and disorders. For this purpose, a simple turn on fluorescence method was developed by introducing the novel Al–W nanosheets with serotonin. Time-saving ultrasonication method was used for the first time to synthesize Al–W nanosheets. We also introduced Al and W metals for the first time together. Owing to the synergistic effect of Al–W nanosheets and ST, extraordinary performance was observed with a detection limit of 0.05 nM in a wide linear range from 10 nM to 1 mM. The developed sensor was also tested in biological fluids such as human urine and blood serum for the quantitative analysis of ST, and the calculated results were excellent with a recovery of more than 100% in urine and blood serum samples. Therefore, from the above results and observation, we successfully developed a new ultrasensitive sensor for the detection of ST, which includes simple sample preparation and cost-effective methods. In the future, the integration of health with time can be resolved with such excellent ultrasensitive biosensors, which can offer new therapeutic opportunities by delivering a thorough understanding of receptor functions.Author contributions
Deepak Dabur: proposed and designed the methodology and carried out all the experiments, data management, and wrote the manuscript. Nallin Sharma: review and revised the manuscript. Hui Fen-Wu: principal investigator and getting funding support, supervising all experiments, checking all data on group meeting weekly and expert guidance to the model and work plan, and revision/proof on the paper.Conflicts of interest
There are no conflicts to declare.Acknowledgements
We thank financial support from the National Science and Technology Council (NSTC) is greatly acknowledged for the grant number: NSTC 111-2113-M-110-016. Prof. Hui-Fen Wu and Dr. Nallin Sharma sincerely thank President Shou-Hui Kuo Tsai and Mr. Andrew Chi-Chang Tsai for the industry financial support of post-doc funding to Nallin Sharma at National Sun Yat-Sen University with the project no. 10Q21129 supported by the Jeenn Chwanq Enterprise Co. Ltd, Kaohsiung, Taiwan.References
- T. Eckle, Health impact and management of a disrupted circadian rhythm and sleep in critical illnesses, Curr. Pharm. Des., 2015, 21(24), 3428 CrossRef CAS PubMed
.
- R. Castaldo, M. J. Chappell, H. Byrne, P. Innominato, S. Hughes, A. Pescapè and L. Pecchia, Detection of melatonin-onset in real settings via wearable sensors and artificial intelligence. A pilot study, Biomed. Signal Process. Control, 2021, 65, 102386 CrossRef
.
- N. Liu, Z. Xu, A. Morrin and X. Luo, Low fouling strategies for electrochemical biosensors targeting disease biomarkers, Anal. Methods, 2019, 11(6), 702–711 RSC
.
- M. S. Al-Nimer, T. A. M. Mohammad and R. A. Alsakeni, Serum levels of serotonin as a biomarker of newly diagnosed fibromyalgia in women: Its relation to the platelet indices, J. Res. Med. Sci., 2018, 23, 71 CrossRef PubMed
.
- Z. Liu, M. Jin, J. Cao, R. Niu, P. Li, G. Zhou, Y. Yu, A. van den Berg and L. Shui, Electrochemical sensor integrated microfluidic device for sensitive and simultaneous quantification of dopamine and 5-hydroxytryptamine, Sens. Actuators, B, 2018, 273, 873–883 CrossRef CAS
.
- K. Khoshnevisan, E. Honarvarfard, F. Torabi, H. Maleki, H. Baharifar, F. Faridbod, B. Larijani and M. R. Khorramizadeh, Electrochemical detection of serotonin: a new approach, Clin. Chim. Acta, 2020, 501, 112–119 CrossRef CAS PubMed
.
- K. Hara, Y. Hirowatari, Y. Shimura and H. Takahashi, Serotonin levels in platelet-poor plasma and whole blood in people with type 2 diabetes with chronic kidney disease, Diabetes Res. Clin. Pract., 2011, 94(2), 167–171 CrossRef CAS PubMed
.
- F. F. De-Miguel and J. G. Nicholls, Release of chemical transmitters from cell bodies and dendrites of nerve cells, Philos. Trans. R. Soc., B, 2015, 370, 20140181 CrossRef PubMed
.
- E. Quentin, A. Belmer and L. Maroteaux, Somato-dendritic regulation of raphe serotonin neurons; a key to antidepressant action, Front. Neurosci., 2018, 12, 982 CrossRef PubMed
.
- J. Cipolla-Neto, F. Amaral, S. C. Afeche, D. Tan and R. Reiter, Melatonin, energy metabolism, and obesity: a review, J. Pineal Res., 2014, 56(4), 371–381 CrossRef CAS PubMed
.
- M. Hamon and J. Glowinski, Regulation of serotonin synthesis, Life Sci., 1974, 15(9), 1533–1548 CrossRef CAS PubMed
.
- N. Wei, X.-E. Zhao, S. Zhu, Y. He, L. Zheng, G. Chen, J. You, S. Liu and Z. Liu, Determination of dopamine, serotonin, biosynthesis precursors and metabolites in rat brain microdialysates by ultrasonic-assisted in situ derivatization–dispersive liquid–liquid microextraction coupled with UHPLC-MS/MS, Talanta, 2016, 161, 253–264 CrossRef CAS PubMed
.
- J. Zhang, D. Wang and Y. Li, Ratiometric electrochemical sensors associated with self-cleaning electrodes for simultaneous detection of adrenaline, serotonin, and tryptophan, ACS Appl. Mater. Interfaces, 2019, 11(14), 13557–13563 CrossRef CAS PubMed
.
- M. Tsunoda, K. Takezawa, T. Santa and K. Imai, Simultaneous automatic determination of catecholamines and their 3-O-methyl metabolites in rat plasma by high-performance liquid chromatography using peroxyoxalate chemiluminescence reaction, Anal. Biochem., 1999, 269(2), 386–392 CrossRef CAS PubMed
.
- E. K. Unger, J. P. Keller, M. Altermatt, R. Liang, A. Matsui, C. Dong, O. J. Hon, Z. Yao, J. Sun and S. Banala, Directed evolution of a selective and sensitive serotonin sensor via machine learning, Cell, 2020, 183(7), 1986–2002. e1926 CrossRef CAS PubMed
.
- H.-K. Jeon, H. Nohta and Y. Ohkura, High-performance liquid chromatographic determination of catecholamines and their precursor and metabolites in human urine and plasma by postcolumn derivatization involving chemical oxidation followed by fluorescence reaction, Anal. Biochem., 1992, 200(2), 332–338 CrossRef CAS PubMed
.
- Z. Wang, Y. Zhang, B. Zhang and X. Lu, Mn2+ doped ZnS QDs modified fluorescence sensor based on molecularly imprinted polymer/sol-gel chemistry for detection of Serotonin, Talanta, 2018, 190, 1–8 CrossRef CAS PubMed
.
- Q. Jin, L. Shan, J. Yue and X. Wang, Spectrophotometric determination of total serotonin derivatives in the safflower seeds with Ehrlich's reagent and the underlying color reaction mechanism, Food Chem., 2008, 108(2), 779–783 CrossRef CAS PubMed
.
- M. Mumtaz, N. Narasimhachari, R. Friedel, G. Pandey and J. Davis, Evaluation of fluorometric assay methods for serotonin in platelets. Plasma and whole blood samples by comparison with GC-MS-SIM Technique, Res. Commun. Chem. Pathol. Pharmacol., 1982, 36(1), 45–60 CAS
.
- J. Thompson, C. A. Spezia and M. Angulo, Fluorometric detection of serotonin using o-phthaldialdehyde: an improvement, Experientia, 1970, 26, 327–329 CrossRef CAS PubMed
.
- T. Kato, A. Tokiyoshi, Y. Kashiwada, K. Miyachi, K. Moriyama, S. Morimoto, M. Asano, T. Yamaguchi and Y. Fujita, Simple and highly sensitive fluorometric determination of serotonin using propylene glycol, Bunseki Kagaku, 2011, 60, 685–689 CrossRef
.
- A. Abdalla, C. W. Atcherley, P. Pathirathna, S. Samaranayake, B. Qiang, E. Peña, S. L. Morgan, M. L. Heien and P. Hashemi, In vivo ambient serotonin measurements at carbon-fiber microelectrodes, Anal. Chem., 2017, 89(18), 9703–9711 CrossRef CAS PubMed
.
- A. Jaquins-Gerstl and A. C. Michael, A review of the effects of FSCV and microdialysis measurements on dopamine release in the surrounding tissue, Analyst, 2015, 140(11), 3696–3708 RSC
.
- Y. Odaka, J. Takahashi, R. Tsuburaya, K. Nishimiya, K. Hao, Y. Matsumoto, K. Ito, Y. Sakata, S. Miyata and D. Manita, Plasma concentration of serotonin is a novel biomarker for coronary microvascular dysfunction in patients with suspected angina and unobstructive coronary arteries, Eur. Heart J., 2017, 38(7), 489–496 CAS
.
- Z. Fredj, M. Ali, B. Singh and E. Dempsey, Simultaneous voltammetric detection of 5-hydroxyindole-3-acetic acid and 5-hydroxytryptamine using a glassy carbon electrode modified with conducting polymer and platinised carbon nanofibers, Microchim. Acta, 2018, 185, 1–10 CrossRef CAS PubMed
.
-
J. Livage; F. Babonneau and C. Sanchez, Sol-gel chemistry for optical materials, Sol-gel optics: processing and applications, 1994, pp. 39–58 Search PubMed
.
- J. G. Semmes, S. L. Bevans, C. H. Mullins and K. H. Shaughnessy, Arylation of diethyl malonate and ethyl cyanoacetate catalyzed by palladium/di-tert-butylneopentylphosphine, Tetrahedron Lett., 2015, 56(23), 3447–3450 CrossRef CAS
.
- P. Ramesh, B. Shalini and N. W. Fadnavis, Knoevenagel condensation of diethylmalonate with aldehydes catalyzed by immobilized bovine serum albumin (BSA), RSC Adv., 2014, 4(15), 7368–7373 RSC
.
- R. Singh and R. Soni, Laser synthesis of aluminium nanoparticles in biocompatible polymer solutions, Appl. Phys. A: Mater. Sci. Process., 2014, 116, 689–701 CrossRef CAS
.
- X. Chen, Q. Wang, L. Qin, X. Liu, S.-Z. Kang, T. Zhang and X. Li, Aluminum sheet-induced porous zinc oxide nanosheets decorated with silver nanoparticles for ultrasensitive SERS sensing of crystal violet, Mater. Adv., 2022, 3(5), 2583–2590 RSC
.
- M. Schieder, T. Lunkenbein, T. Martin, W. Milius, G. Auffermann and J. Breu, Hierarchically porous tungsten oxide nanotubes with crystalline walls made of the metastable orthorhombic polymorph, J. Mater. Chem. A, 2013, 1(2), 381–387 RSC
.
- S. Revo, S. Hamamda, K. Ivanenko, O. Boshko, A. Djarri and A. Boubertakh, Thermal analysis of Al+ 0.1% CNT ribbon, Nanoscale Res. Lett., 2015, 10(1), 1–7 CrossRef CAS PubMed
.
- D. Poirier, R. Gauvin and R. A. Drew, Structural characterization of a mechanically milled carbon nanotube/aluminum mixture, Composites, Part A, 2009, 40(9), 1482–1489 CrossRef
.
- M. E. Pam, Y. Shi, J. Hu, X. Zhao, J. Dan, X. Gong, S. Huang, D. Geng, S. Pennycook and L. K. Ang, Effects of precursor pre-treatment on the vapor deposition of WS 2 monolayers, Nanoscale Adv., 2019, 1(3), 953–960 RSC
.
- S. Rahimnejad, J. H. He, F. Pan, W. Chen, K. Wu and G. Q. Xu, Enhancement of the photocatalytic efficiency of WO3 nanoparticles via hydrogen plasma treatment, Mater. Res. Express, 2014, 1(4), 045044 CrossRef
.
- J. Li, Y. Liu, Z. Zhu, G. Zhang, T. Zou, Z. Zou, S. Zhang, D. Zeng and C. Xie, A full-sunlight-driven photocatalyst with super long-persistent energy storage ability, Sci. Rep., 2013, 3(1), 2409 CrossRef PubMed
.
- G. Leftheriotis, S. Papaefthimiou, P. Yianoulis and A. Siokou, Effect of the tungsten oxidation states in the thermal coloration and bleaching of amorphous WO3 films, Thin Solid Films, 2001, 384(2), 298–306 CrossRef CAS
.
- S. Tsunekawa, K. Asami, S. Ito, M. Yashima and T. Sugimoto, XPS study of the phase transition in pure zirconium oxide nanocrystallites, Appl. Surf. Sci., 2005, 252(5), 1651–1656 CrossRef CAS
.
- J. T. Kloprogge, L. V. Duong, B. J. Wood and R. L. Frost, XPS study of the major minerals in bauxite: Gibbsite, bayerite and (pseudo-) boehmite, J. Colloid Interface Sci., 2006, 296(2), 572–576 CrossRef CAS PubMed
.
- J. Zähr, S. Ostwald, M. Türpe, H. Ullrich and U. Füssel, Characterisation of oxide and hydroxide layers on technical aluminum materials using XPS, Vacuum, 2012, 86(9), 1216–1219 CrossRef
.
- A. Shpak, A. Korduban, M. Medvedskij and V. Kandyba, XPS studies of active elements surface of gas sensors based on WO3− x nanoparticles, J. Electron Spectrosc. Relat. Phenom., 2007, 156, 172–175 CrossRef
.
- I. M. Szilágyi, B. Fórizs, O. Rosseler, Á. Szegedi, P. Németh, P. Király, G. Tárkányi, B. Vajna, K. Varga-Josepovits and K. László, WO3 photocatalysts: Influence of structure and composition, J. Catal., 2012, 294, 119–127 CrossRef
.
- G. A. Hernández-Mendoza, D. Aguirre-Olivas, M. González-Gutiérrez, H. J. Leal, N. Qureshi, C. G. Treviño-Palacios, J. Peón and F. F. De-Miguel, Fluorescence of serotonin in the visible spectrum upon multiphotonic photoconversion, Biomed. Opt. Express, 2020, 11(3), 1432–1448 CrossRef PubMed
.
- R. F. Chen, Fluorescence of protonated excited-state forms of 5-hydroxytryptamine (serotonin) and related indoles, Proc. Natl. Acad. Sci. U. S. A., 1968, 60(2), 598–605 CrossRef CAS PubMed
.
- M. Dinarvand, E. Neubert, D. Meyer, G. Selvaggio, F. A. Mann, L. Erpenbeck and S. Kruss, Near-infrared imaging of serotonin release from cells with fluorescent nanosensors, Nano Lett., 2019, 19(9), 6604–6611 CrossRef CAS PubMed
.
- M. M. V. Ramos, J. H. Carvalho, P. R. de Oliveira and B. C. Janegitz, Determination of serotonin by using a thin film containing graphite, nanodiamonds and gold nanoparticles anchored in casein, Measurement, 2020, 149, 106979 CrossRef
.
- G. A. Vibisha, M. G. Daher, S. H. Rahman, Z. Jaroszewicz, K. B. Rajesh and R. Jha, Sensitivity Enhancement of Surface Plasmon Resonance-based Biosensor using Aluminium-Cobalt-Tungsten Disulfide-Graphene Heterostructure, J. Environ. Nanotechnol., 2022, 11(4), 05–13 CrossRef CAS
.
Footnote |
| † Electronic supplementary information (ESI) available. See DOI: https://doi.org/10.1039/d3tb00572k |
| This journal is © The Royal Society of Chemistry 2023 |

