Co-activation of methane and nitrogen to acetonitrile over MoCx/Al2O3 catalysts†
Korawich
Trangwachirachai
 a,
I-Ting
Kao
a,
Wei-Hsiang
Huang
b,
Chi-Liang
Chen
a,
I-Ting
Kao
a,
Wei-Hsiang
Huang
b,
Chi-Liang
Chen
 b and
Yu-Chuan
Lin
 *a
*a
aDepartment of Chemical Engineering, National Cheng Kung University, Tainan 70101, Taiwan. E-mail: yclin768@mail.ncku.edu.tw
bNational Synchrotron Radiation Research Center, Hsinchu 30076, Taiwan
First published on 4th August 2023
Abstract
Methane and nitrogen are regarded as the most abundant sources of hydrocarbons and nitrogen, respectively. Both compounds exhibit high stability due to the presence of daunting C–H and N![[triple bond, length as m-dash]](https://www.rsc.org/images/entities/char_e002.gif) N bond energies of 439 and 945 kJ mol−1, respectively, leading to their abundance. This study investigates the co-activation of methane and nitrogen using Al2O3-supported MoCx catalysts (1, 5, and 10 wt%) to produce acetonitrile (ACN) at ambient pressure. It was found that the optimum methane conversion (26.1%) and turnover frequency (TOF) of ACN (15.3 h−1) were achieved at 750 °C using 1 wt% Mo loading. To alleviate catalyst deactivation resulting from coking, H2 co-feeding was implemented and found to effectively sustain the on-stream activity for 50 hours. A plausible mechanism for ACN production, which occurs on the MoC-like surface, was proposed.
N bond energies of 439 and 945 kJ mol−1, respectively, leading to their abundance. This study investigates the co-activation of methane and nitrogen using Al2O3-supported MoCx catalysts (1, 5, and 10 wt%) to produce acetonitrile (ACN) at ambient pressure. It was found that the optimum methane conversion (26.1%) and turnover frequency (TOF) of ACN (15.3 h−1) were achieved at 750 °C using 1 wt% Mo loading. To alleviate catalyst deactivation resulting from coking, H2 co-feeding was implemented and found to effectively sustain the on-stream activity for 50 hours. A plausible mechanism for ACN production, which occurs on the MoC-like surface, was proposed.
Introduction
Methane (CH4), the major component of natural gas, shale gas, and biogas, has long been used as a heat resource by combustion.1 Because of its abundance, CH4 is considered an important building block in the production of value-added chemicals.2,3 For example, CH4 can be converted to syngas (CO and H2) by steam or dry reforming4–7 and further converted to hydrocarbons by Fischer–Tropsch synthesis.8,9 CH4 can also be converted to olefins, aromatics, or oxygenated compounds (e.g., formaldehyde and methanol) by non-oxidative pyrolysis, dehydroaromatization, or selective partial oxidation.9–11 However, the chemical inertness and high C–H bond dissociation energy of CH4 hinder its conversion to chemicals.9Fig. 1 shows the existing routes for catalytic CH4 conversion, including CH4 to olefins, aromatics, and hydrogen (MTO, MTA, and MTOAH), oxidative coupling (OCM), and dehydroaromatization (MDA).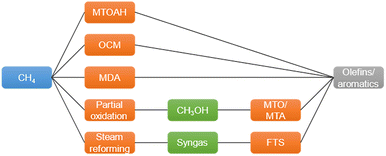 | ||
| Fig. 1 Existing routes of CH4 conversion to chemicals.2 | ||
Besides the conventional reforming processes (e.g., steam and dry reforming), limited studies have been dedicated to the direct conversion of CH4 to chemicals through non-oxidative routes. McFarland et al. reported the production of H2 and solid carbon derived from CH4 catalyzed by molten metal alloys.12 The catalysts were prepared by dissolving active metals (Ni, Pd, and Pt) in low-melting-temperature metal solvents (Sn, Pb, Bi, In, and Ga) at temperatures below 1000 °C. 27 mol% Ni in Bi was the most active catalyst, achieving a 1.7 × 10⁻⁸ molH2 cm−2 s−1 hydrogen production rate with more than 95% selectivity at 950 °C. The Kopyscinski group studied silica-supported GaN prepared by ammonia nitridation for CH4 conversion to ethylene.13 They found that CH4 can be converted to ethylene at above 700 °C. Our group recently discovered that GaN made by co-pyrolyzing gallium nitrate and organic nitrogen compounds (e.g., melamine, melem, and g-C3N4) could convert CH4 to acetonitrile (ACN).14,15 The impact of particle size of GaN and residual CN species (including C![[double bond, length as m-dash]](https://www.rsc.org/images/entities/char_e001.gif) N and C
N and C![[triple bond, length as m-dash]](https://www.rsc.org/images/entities/char_e002.gif) N) on the enhancement of ACN production was found to be significant. However, it is worth noting that the residual CN species cannot be regenerated during the conversion process and gradually get depleted.
N) on the enhancement of ACN production was found to be significant. However, it is worth noting that the residual CN species cannot be regenerated during the conversion process and gradually get depleted.
Currently, ACN is obtained primarily as a by-product (approximately 2–4%) from acrylonitrile synthesis known as the Sohio process.16 This results in a comparatively low ACN output that may not meet the escalating demand for ACN. In 2021, the global ACN market was valued at USD 264 million and is expected to grow at an annual rate of 5.5%.17 Therefore, exploring alternative routes for ACN synthesis to meet the growing demand is needed. The advent of the shale gas revolution has led to a significant increase in natural gas production and a subsequent decline in CH4 prices.18,19 In 2017, the price of ACN in the United States was approximately nine times higher than that of CH4.20 Accordingly, the conversion of CH4 to ACN should be worth exploring.
Taking the Mars–van Krevelen redox cycle (Fig. 2) as an example,21 the oxide catalyst delivers its mobile oxygen to partially oxidize the reactant to form an O-containing product, leaving the reduced catalyst in the first half of the cycle. Then, the reduced catalyst is re-oxidized by gaseous oxygen, fulfilling the redox cycle.
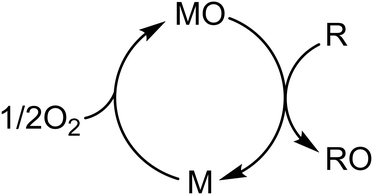 | ||
| Fig. 2 Schematic illustration of the Mars–van Krevelen redox cycle, where MO is a metal oxide, M is the reduced form, R is a reactant, and RO is an O-containing product. | ||
For the production of ACN via CH4 conversion over supported GaN catalysts, only the first half of the redox cycle is completed. The addition of ammonia as a co-feed was expected to facilitate the remaining half of the cycle. However, the production of ACN was significantly reduced with even small amounts of co-fed NH3 due to the in situ formed H2 from NH3 decomposition.14 Therefore, using N2 as a nitrogen source for ACN synthesis seems to be the most promising approach. In other words, a highly effective CH4 conversion catalyst for ACN production must be capable of activating CH4 and N2 simultaneously. Tiwari et al. reported that CH4 and N2 could be activated simultaneously over a K-doped Ru catalyst to co-produce ammonia and ethylene.22 The in situ H2 produced from CH4 conversion was used as a hydrogen source for ammonia synthesis. However, coke is formed in parallel with hydrogen production, resulting in discontinuous ammonia productivity. Nevertheless, this study introduces the possibility of converting two inert compounds into value-added chemicals.
The crucial step in N2 activation is the cleavage of the N![[triple bond, length as m-dash]](https://www.rsc.org/images/entities/char_e002.gif) N bond. Mo2C has been demonstrated to be active in ammonia synthesis.23 As predicted by the d-band model, transition metal carbides with vacant d orbitals exhibit comparable adsorption behavior towards electron-rich adsorbates.24 In addition, the sp bands of transition metals in metal carbides would hybridize with the d bands from the transition metals and with the s bands from the carbon.25 The extra hybridized orbitals provide more opportunities for back-donation to the π orbitals of the adsorbates, making Mo2C a promising N2 activation active site. Moreover, Mo2C was found as an active site in CH4 dehydroaromatization.26–28 Accordingly, the Mo2C catalyst should have strong potential for simultaneous activation of CH4 (C–H) and N2 (N
N bond. Mo2C has been demonstrated to be active in ammonia synthesis.23 As predicted by the d-band model, transition metal carbides with vacant d orbitals exhibit comparable adsorption behavior towards electron-rich adsorbates.24 In addition, the sp bands of transition metals in metal carbides would hybridize with the d bands from the transition metals and with the s bands from the carbon.25 The extra hybridized orbitals provide more opportunities for back-donation to the π orbitals of the adsorbates, making Mo2C a promising N2 activation active site. Moreover, Mo2C was found as an active site in CH4 dehydroaromatization.26–28 Accordingly, the Mo2C catalyst should have strong potential for simultaneous activation of CH4 (C–H) and N2 (N![[triple bond, length as m-dash]](https://www.rsc.org/images/entities/char_e002.gif) N) to synthesize ACN.
N) to synthesize ACN.
In this study, the catalytic conversion of CH4 and N2 to ACN using Al2O3-supported MoCx catalysts was investigated. We found that the catalyst could simultaneously convert both CH4 and N2 to produce ACN. The optimum operating temperature and Mo loading were investigated. Catalyst deactivation was suppressed by introducing H2 into the reaction stream, allowing the catalytic activity to be maintained for 50 h. In addition, a plausible mechanism for ACN formation was proposed to occur via the Mo-terminated MoC-like surface structure, which facilitates the reaction between CH4 and N2. Kinetics analysis was performed to support the proposed mechanism, in which the surface reaction was suggested to be rate-limiting. The goal of this research is to validate the feasibility of converting two inert compounds (CH4 and N2) into a valuable chemical (ACN).
Experimental section
Chemicals
Alumina (Al2O3, 99.5%), ammonium heptamolybdate ((NH4)6Mo7O24, 99.95%), molybdenum oxide (MoO3, 99.95%), and commercially available molybdenum carbide (com-Mo2C, 99.5%) were obtained from Merck, J. T. Baker, Alfa Aesar, and Sigma-Aldrich, respectively. CH4 (99.999%), argon (Ar, 99.999%), nitrogen (N2, 99.999%), and hydrogen (H2, 99.999%) were purchased from Air Products. Al2O3 was calcined at 750 °C before being used as a support. All chemicals were used as received.Catalyst preparation
Al2O3-supported MoCx catalysts were prepared by incipient-wetness impregnation followed by carbonization. Briefly, a designated amount of ammonium heptamolybdate solution (0.5 M) was added dropwise onto the Al2O3 support to obtain xMo/Al2O3 (x = 1, 5, or 10 wt%). The impregnated catalyst was dried at 110 °C overnight and was then calcined at 750 °C (5 °C min−1) for 5 h. Afterward, the calcined catalyst was sieved and crushed into 40–80 mesh particles. The carbonization treatment was performed before activity evaluation.Characterization
An inductively coupled plasma mass spectrometer (ICP-MS, THERMOELEMENT XR) was utilized to quantify the Mo content. X-ray diffraction (XRD) patterns were recorded at 40 mA and 4 kV using a diffractometer (Rigaku D/Max-IIB) equipped with Ni-filtered Cu Kα (λ = 1.5406 Å) radiation. A transmission electron microscope (TEM, JEOL JEM-2010) equipped with an energy dispersive X-ray spectrometer (EDS) was used to analyze the morphology of MoCx particles. N2 sorption isotherms were analyzed using an automated physisorption analyzer (ASAP 2020 Plus, Micromeritics). The surface area was evaluated by applying the Brunauer–Emmett–Teller (BET) method at a relative pressure of 0.01–0.1.X-ray absorption spectroscopy (XAS) at the Mo K-edge was performed at the Taiwan Photon Source (TPS) 44A beamline of the National Synchrotron Radiation Research Center (NSRRC), Taiwan. Mo-foil was used for energy calibration. The XAS spectra were analyzed by using the Athena and Artemis software ver. 0.9.26 included in the Demeter package.29
The CO pulse titration technique was conducted at 196 K to determine the dispersion of MoCx particles using a chemisorption analyzer (AutoChem II, Micromeritics) and the signals were recorded using a thermal conductivity detector (TCD). Ammonia and nitrogen temperature-programmed desorption (NH3- and N2-TPD) were conducted to determine the acidity and the N2 desorption temperature, respectively, using the chemisorption analyzer. In a typical run, 0.2 g of catalyst was placed in a U-tube quartz reactor. The catalyst was then pretreated at 750 °C (10 °C min−1) for 30 min in a flow of Ar for dehydrating and outgassing. After cooling to 30 °C, the adsorbate (NH3 or N2) was charged into the system for 1 h. After that, the sample was purged with He at 30 °C for 1 h to remove the excess gas. TPD was performed in a helium flow from 30 to 700 °C (10 °C min−1). In situ Fourier transform infrared (FTIR) spectra were recorded by using a Thermo Scientific Nicolet iS50 spectrometer equipped with a diffuse reflectance infrared Fourier transform spectroscopy cell (DRIFTS, Praying Mantis, Harrick Scientific). X-ray photoelectron spectroscopy (XPS) spectra were evaluated by using a PHI 5000 VersaProbe spectrometer equipped with a monochromatized aluminum source with a wavelength of 1486.6 eV. The tested samples were placed in a transport chamber from a glove box to the XPS chamber for quasi-in situ analysis to avoid air exposure. The C 1s binding energy of adventitious carbon at 285.0 eV was used to calibrate the energy shift.
Catalytic activity testing
Activity tests were conducted in a horizontal fixed-bed flow reactor. In a typical run, 0.18 g of tested catalyst (no diluent) was sandwiched with quartz wool in the middle of a quartz tube reactor (13 mm OD × 10 mm ID × 220 mm long). The catalyst was pretreated with an Ar stream (20 mL min−1) at 750 °C (10 C min−1) for 30 min to remove moisture. The catalyst was then carbonized at 750 °C using a 10% Ar/CH4 stream (20 mL min−1) for 15 min to transform MoO3 into MoCx. The carbonized catalysts were denoted as xMoCx/Al2O3. After carbonization, 10 mL min−1 of mixed gases, including 45% CH4, 45% N2, and 10% Ar (the internal standard), were admitted to the system and allowed to react for 6 h. The outlet products were separated and analyzed using an online gas chromatograph (GC, SRI 8610C) equipped with a flame ionization detector (FID) and a thermal conductivity detector (TCD) for quantification. A PoraPLOT Q-HT capillary column (25 m × 0.53 mm × 20 μm) was used for separation. The CH4 conversion (%) and turnover frequency of each product (TOF, h−1) were calculated based on the observable products by using the following equations: | (1) |
 | (2) |
“C atoms in product” is the carbon number of each product. Fproduct is the molar flow rate (μmol h−1) of the product at the outlet stream. Fmethane is the molar flow rate of CH4 (μmol h−1) at the inlet stream.
Results and discussion
Characterization
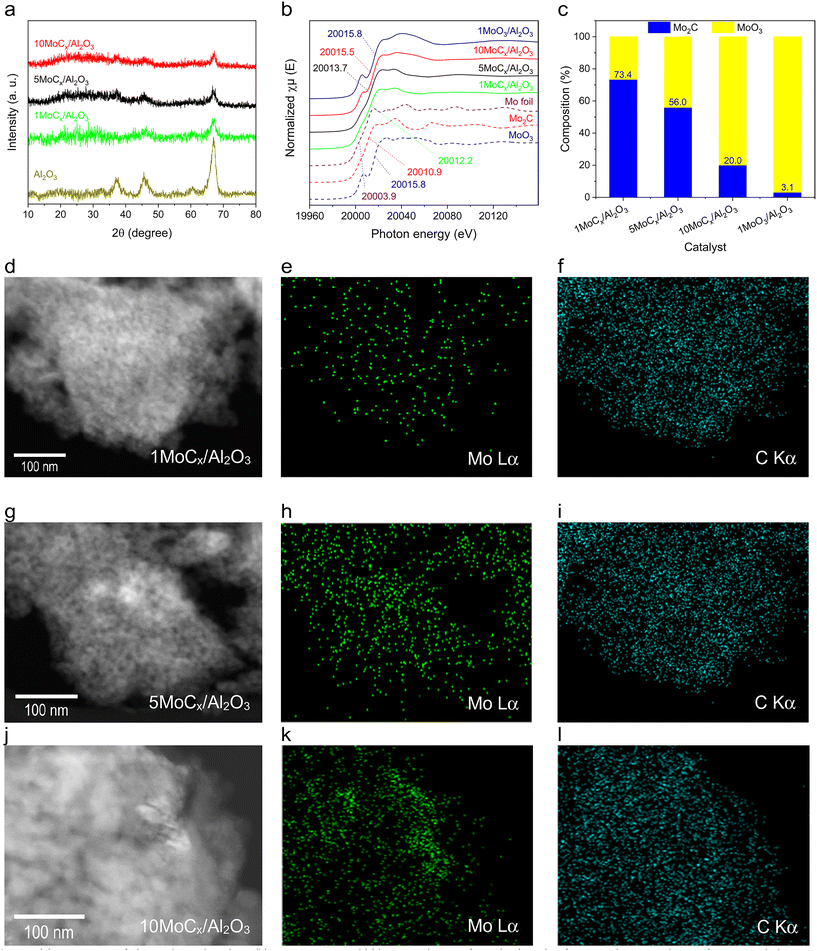
The bulk structure of the catalysts was determined by XRD, XAS at the Mo K-edge, and TEM, as shown in Fig. 3. The diffraction patterns of all Al2O3-supported MoCx catalysts were similar to that of the pristine Al2O3 (Fig. 3a), indicating the presence of well-dispersed Mo2C or Mo2C crystals that are undetectable by XRD. Unsupported Mo2C prepared by carbonization had similar diffraction to that of com-Mo2C (Fig. S1†), confirming that the Mo2C phase is successfully synthesized. Fig. 3b shows the Mo K-edge XAS spectra of the tested catalysts. Mo foil, Mo2C, MoO3, and 1MoO3/Al2O3 were included for reference. The absorption edge shows an increasing trend as follows: Mo foil (20![[thin space (1/6-em)]](https://www.rsc.org/images/entities/char_2009.gif) 003.9 eV) < Mo2C (20
003.9 eV) < Mo2C (20![[thin space (1/6-em)]](https://www.rsc.org/images/entities/char_2009.gif) 010.9 eV) < 1MoCx/Al2O3 (20
010.9 eV) < 1MoCx/Al2O3 (20![[thin space (1/6-em)]](https://www.rsc.org/images/entities/char_2009.gif) 012.2 eV) < 5MoCx/Al2O3 (20
012.2 eV) < 5MoCx/Al2O3 (20![[thin space (1/6-em)]](https://www.rsc.org/images/entities/char_2009.gif) 013.7 eV) < 10MoCx/Al2O3 (20
013.7 eV) < 10MoCx/Al2O3 (20![[thin space (1/6-em)]](https://www.rsc.org/images/entities/char_2009.gif) 015.5 eV) < 1MoO3/Al2O3 (20
015.5 eV) < 1MoO3/Al2O3 (20![[thin space (1/6-em)]](https://www.rsc.org/images/entities/char_2009.gif) 015.8 eV) = MoO3 (20
015.8 eV) = MoO3 (20![[thin space (1/6-em)]](https://www.rsc.org/images/entities/char_2009.gif) 015.8 eV), indicating the increasing oxidation state of Mo species. Moreover, the linear combination result of each XAS spectrum (see Fig. 3c) by using Mo2C and MoO3 as representatives showed that the composition of Mo2C decreased following the order 1MoCx/Al2O3 (73.4%) > 5MoCx/Al2O3 (56.0%) > 10MoCx/Al2O3 (20.0%). This fitted result suggested that the Mo2C phase is formed after carbonization and is dominant in 1MoCx/Al2O3.
015.8 eV), indicating the increasing oxidation state of Mo species. Moreover, the linear combination result of each XAS spectrum (see Fig. 3c) by using Mo2C and MoO3 as representatives showed that the composition of Mo2C decreased following the order 1MoCx/Al2O3 (73.4%) > 5MoCx/Al2O3 (56.0%) > 10MoCx/Al2O3 (20.0%). This fitted result suggested that the Mo2C phase is formed after carbonization and is dominant in 1MoCx/Al2O3.
The dark-field TEM images (Fig. 3d, g, and j) do not reveal any distinct Mo particles, likely because of the presence of small and evenly dispersed Mo particles. The Mo Lα mapping images (Fig. 3e, h, and k) confirm that Mo is uniformly distributed. Notably, even for 10MoCx/Al2O3, no aggregated Mo clusters were observed. Moreover, the C Kα images (Fig. 3f, i, and l) indicated a higher concentration of carbon species than that of Mo in each catalyst, suggesting the coexistence of deposited carbon species with carbides.
The physicochemical properties of Al2O3-supported MoCx catalysts are listed in Table 1. The Mo content of each catalyst is close to its designated value. The N2 isotherms of all catalysts showed a type IV isotherm and H1 hysteresis loop, indicating the presence of a mesoporous structure (Fig. S2†).30,31 The surface areas of the tested catalysts varied in the range of 39 to 139 m2 g−1 and they exhibited a pore volume of 0.22–0.32 cm3 g−1. The surface area and pore volume decreased with increasing Mo loading. This is likely due to the occupation of accessible pores by Mo species, making gas adsorption difficult.32 Hence, a higher Mo loading would lead to more available pores being occupied, resulting in a reduced gas adsorption capacity.
| Catalyst | Mo loadinga (%) | Surface areab (m2 g−1) | Pore volumec (cm3 g−1) | Dispersiond (%) | Aciditye (μmol g−1) |
|---|---|---|---|---|---|
| a Determined by ICP-MS. b Estimated by the BET method. c Calculated by the BJH method. d Obtained by CO pulse titration. e Evaluated by the NH3-TPD technique. | |||||
| 1MoCx/Al2O3 | 1.01 | 139 | 0.32 | 17.8 | 469 |
| 5MoCx/Al2O3 | 4.74 | 95 | 0.24 | 8.5 | 393 |
| 10MoCx/Al2O3 | 9.99 | 39 | 0.22 | 2.1 | 172 |
The dispersion of MoCx decreased with increasing Mo loading. As seen from the TEM images, the Mo2C particle size was increased with increasing Mo loading. The increased particle size indicated a higher degree of Mo2C agglomeration, which reduced the surface-to-volume ratio of Mo2C. Therefore, the surface availability of Mo2C at a high Mo content is suppressed. The total acidity of the Al2O3-supported Mo2C catalysts also decreased when the Mo loading was increased (Fig. S3†). Al2O3 exhibits Lewis acidity, whereas Mo2C has Lewis basic sites.33 By adjusting the Mo loading, it becomes possible to occupy the acidic sites of Al2O3, leading to a decrease in acidity. The coverage of acid sites increases with higher Mo loading.
Catalytic evaluation
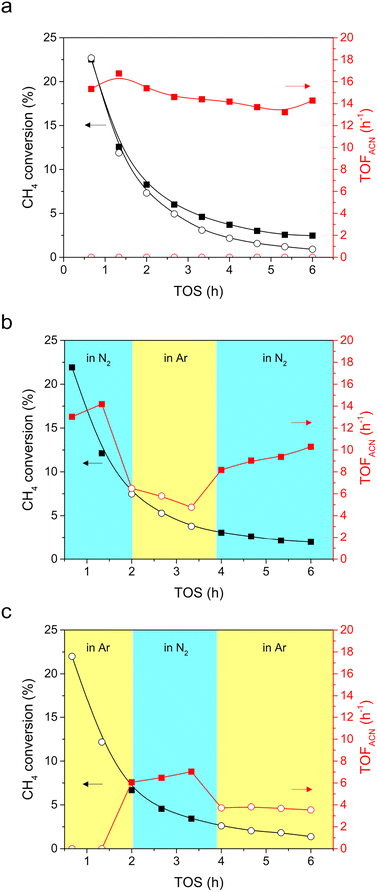
CH4 conversion was tested in either a N2 or Ar stream to verify that gaseous N2 is activated and reacted with CH4 to form ACN. Similar profiles of CH4 conversion and TOF of hydrocarbons (ethylene, ethane, benzene, and toluene) were observed in both N2 (closed squares) and Ar (open circles) streams (Fig. 4a and S4†). This indicated that the N2 and Ar atmospheres had little influence on the transformation of CH4 into hydrocarbons. Moreover, it can be seen that the CH4 conversion and TOF of hydrocarbons decreased synchronously with time, indicating that the active sites for hydrocarbon formation are deactivated, likely due to coke accumulation.34Note that ACN production was solely observed when CH4 was converted in N2 (Fig. 4a). That is, N2 activation and N-insertion took place in CH4 conversion. Since gaseous N2 is the sole N-containing reagent, the formation of ACN could be attributed to gaseous N2 activation. To further clarify that ACN can be produced in the presence of N2, N2–Ar–N2 (Fig. 4b) and Ar–N2–Ar (Fig. 4c) switching tests were conducted. Again, operating in varying streams has a negligible impact on the CH4 conversion (black scatters in Fig. 4b and c). In the N2–Ar–N2 switching test (Fig. 4b), the TOF of ACN was initially high (13.0 h−1) when operating under N2 (red closed squares). After switching to Ar (red open circles), the TOF of ACN decreased sharply, indicating that ACN cannot be produced in Ar. When the reaction stream was switched back to N2, the TOF recovered to 8.2 h−1 (red closed squares), underlining that ACN is produced by feeding N2. Comparatively, in the Ar–N2–Ar switching test (Fig. 4c), there was no ACN produced at the beginning of the test when feeding Ar (red open circles). After switching the feed to N2, a significant increase in the TOF of ACN was observed (6.1 h−1, red closed squares), emphasizing that N2 activation occurs, which can react with CH4 to form ACN. However, ACN could still be produced when N2 was replaced by Ar (red open circles). Presumably, there is deposited carbon on the MoCx surface during the first cycle in Ar. After purging N2, the converted N2 could also react with the MoCx surface, forming a carbonitride-like structure.35 This structure is proposed to act as a N-source for ACN synthesis. It can be concluded at this stage that Al2O3-supported MoCx is active for the co-activation of CH4 and N2, and ACN can be produced merely in N2.
The effects of operating temperature (650, 700, 750, and 800 °C) and Mo loading (1, 5, and 10 wt%) were evaluated for the conversion of CH4 using the MoCx/Al2O3 catalysts (Table 2, entries 1–4 and Fig. S5†). Mo2C and MoO3 were tested, and both showed negligible activities. The CH4 conversion is increased with temperature from 9.3% (650 °C) to 25.0% (800 °C). The TOFs of C2 species and coke also increased with reaction temperature. However, aromatics reached the highest TOF at 750 °C and then declined. This is likely caused by the over-oligomerization of aromatics to form coke. The TOF of ACN also increased with reaction temperature, suggesting the progressively enhanced extent of C–H bond and N![[triple bond, length as m-dash]](https://www.rsc.org/images/entities/char_e002.gif) N bond cleavages. At 800 °C, the TOF of ACN was high at the beginning of the reaction, but showed a rapidly decreasing trend. Hence, a temperature of 750 °C was selected for further investigations.
N bond cleavages. At 800 °C, the TOF of ACN was high at the beginning of the reaction, but showed a rapidly decreasing trend. Hence, a temperature of 750 °C was selected for further investigations.
| Entry | Catalyst | Temp. (°C) | CH4 conversiona (%) | TOFa (h−1) | ||||
|---|---|---|---|---|---|---|---|---|
| C2 | Aromatics | ACN | HCN | Cokeb | ||||
| a Data were taken from the TOS profiles at 40 min and 6 h (shown in brackets). b Average coke formation rate, determined by TGA. | ||||||||
| 1 | 1MoCx/Al2O3 | 650 | 9.3 (5.5) | 8.6 (5.1) | 65.0 (23.3) | 1.1 (6.3) | N/D | 23.2 |
| 2 | 700 | 17.2 (6.0) | 16.6 (9.6) | 123.7 (14.7) | 5.1 (9.5) | N/D | 26.7 | |
| 3 | 750 | 26.1 (6.0) | 30.7 (8.4) | 168.8 (1.0) | 15.3 (14.3) | N/D | 33.6 | |
| 4 | 800 | 25.0 (8.4) | 38.6 (11.9) | 109.5 (0.5) | 20.8 (5.5) | N/D | 58.2 | |
| 5 | 5MoCx/Al2O3 | 750 | 26.5 (5.9) | 13.5 (2.3) | 72.2 (0.1) | 7.8 (4.6) | 1.2 (0) | 18.1 |
| 6 | 10MoCx/Al2O3 | 15.4 (3.0) | 15.2 (3.1) | 80.3 (0.0) | 13.2 (5.9) | 2.1 (0) | 15.3 | |
In addition to determining the effect of reaction temperature, CH4-TPSR experiments were also conducted, as shown in Fig. S6.† CH4 (m/z = 16) started to be converted at 640 °C with a maximum conversion rate at 730 °C. The onset temperatures of major products, including ACN (m/z = 41), C2 species (m/z = 29), and benzene (m/z = 78), were approximately 650 °C. Therefore, it could be suggested that the formation reactions of ACN and hydrocarbons proceed in parallel.
The effect of Mo loading (Table 2, entries 3, 5, and 6 and Fig. S7†) was tested at a 750 °C. The CH4 conversion and TOF of C2 and aromatics decreased with increasing Mo loading. This is likely due to the suppressed acidity at a high Mo loading since C–H activation is promoted by acidic sites.36,37 The TOF of ACN had negligible change with respect to the Mo loading. However, a small amount of HCN could be observed when the Mo loading is higher than 5%. Moreover, 1MoCx/Al2O3 exhibited the most stable TOF of ACN during the 6 h testing. Accordingly, 1MoCx/Al2O3 was further investigated.
In comparison, the equilibrium conversion of CH4 and N2 to ACN (2CH4 + 0.5N2 ↔ CH3CN + 2.5H2) was performed from 300 °C to 1000 °C using ThermoSolver. The obtained parameters are presented in Table S1.† It can be seen that the equilibrium constant (Keq) increases with increasing temperature, indicating the endothermic nature of CH4 conversion to ACN. However, the values of Keq at all tested temperatures are very small. That is, the reaction is highly unpreferable, in which low CH4 and N2 conversions and a low ACN yield were expected. The equilibrium CH4 conversion as a function of temperature is illustrated in Fig. S8.† At 750 °C, only 0.55% of CH4 is converted in the equilibrium state. Note that using a MoCx-based catalyst resulted in approximately 1.5% CH4 conversion, suggesting the effectiveness of Mo2C in the cleavage of C–H and N![[triple bond, length as m-dash]](https://www.rsc.org/images/entities/char_e002.gif) N bonds.
N bonds.
The above activity results showed that the major products were aromatics and coke, possibly due to the strong interaction between Mo2C nanoparticles and CH4.38 Moreover, a parallel reaction pathway to produce ACN and hydrocarbons was suggested by the similar onset temperature from CH4-TPSR. One way to suppress aromatization and coke is through co-feeding hydrogen in the reactant stream.39 Hence, the effect of co-feeding H2 (10, 20, 25, and 33% v/v) was investigated at 750 °C by using 1MoCx/Al2O3 (see Fig. 5 and S9†). Co-feeding H2 varies the concentration of CH4 which can affect reactivity. Accordingly, using Ar as a diluent with the same concentration as that of H2 was also investigated to validate that the activity is not only affected by the low CH4 concentration.
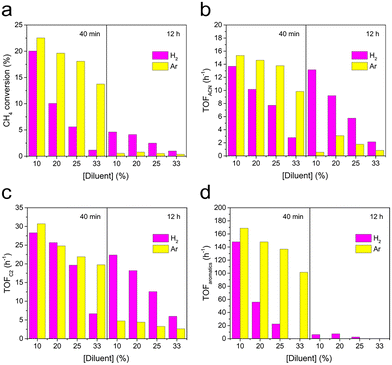 | ||
| Fig. 5 Effects of H2 co-feeding and Ar dilution on (a) CH4 conversion and TOF of (b) ACN, (c) C2, and (d) aromatics by using 1MoCx/Al2O3. | ||
The initial CH4 conversion and TOFs of hydrocarbons (C2 and aromatics) and ACN decreased with increasing concentration of diluent. In addition, the initial CH4 conversion and TOFs under the H2 stream (magenta bars) were more strongly influenced than those tested in the Ar stream (yellow bars), in which aromatics are the most affected species (see Fig. 5d). In other words, H2 co-feeding does not only dilute the concentration of CH4 but also dampens the aromatization activity. Moreover, after 12 h on stream, the CH4 conversion decreased severely in the Ar stream (22.5%, 19.6%, 18.1%, and 13.7% declined to 0.6%, 0.8%, 0.5%, and 0.4% at 10, 20, 25, and 33% Ar concentration, respectively), compared to those in the H2 co-fed stream (20.0%, 10.1%, 5.6%, and 1.2% decreased to 4.6%, 4.1%, 2.5%, and 1.0% at 10, 20, 25, and 33% H2 concentration, respectively). This implied that the reactivity is more stable when H2 is present.
As seen by the TOFs at 12 h on stream (Fig. 5b–d), the products were still producible in the H2 atmosphere, while there were almost no products formed under the Ar stream at the 12th hour. Accordingly, it could be claimed that gaseous H2 also reduces the amount of carbon deposits on the catalyst surface, resulting in a steadier reactivity.39
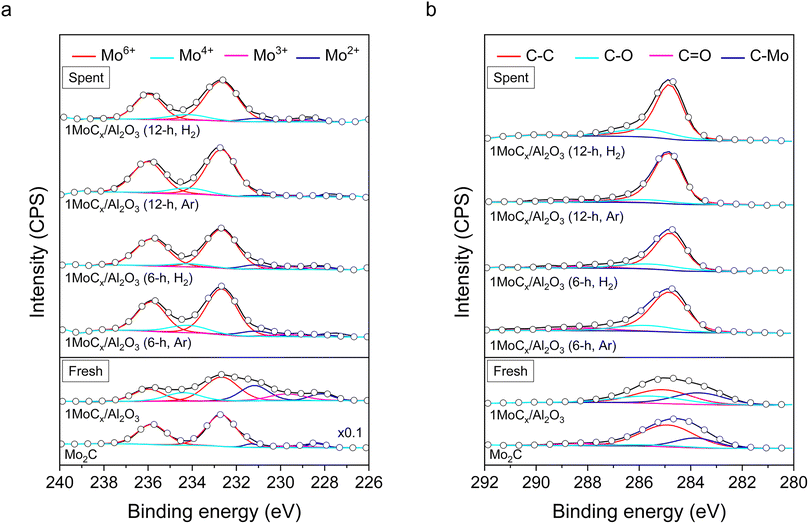
XPS spectra of the Mo2C and 1MoCx/Al2O3 catalysts are illustrated in Fig. 6. The photoline of Mo2C at Mo 3d (Fig. 6a) could be deconvoluted into five responses. The responses at 235.8 and 232.7 eV are attributed to Mo6+ (red);40 229.5 eV, Mo3+ (magenta);41 231.3 and 228.4 eV, Mo2+ (blue).42 The presence of Mo2+ signals indicated the existence of Mo2C species, while Mo6+ and Mo3+ could be assigned as MoO3 and Mo2O3, respectively. The existence of oxidic species could be attributed to the oxidation of the Mo2C surface.43,44 The spectrum of 1MoCx/Al2O3 also contained these signals. In addition, another response at 234.4 eV assigned to Mo4+ species45 (cyan) was observed over the 1MoCx/Al2O3 catalyst, which could be referred to the presence of MoC species, likely due to the over-carbonization of small Mo2C particles. Oxidic molybdenum species were observed, even though the catalyst was in situ carbonized prior to the reaction without exposure to the atmosphere. Therefore, it could be stated that the active phase is composed of carbidic molybdenum species.
The C 1s spectra (Fig. 6b) of both Mo2C and 1MoCx/Al2O3 could be deconvoluted into four species, including adventitious carbon (C–C, red) at 285.0 eV, C–O (cyan) at 285.6 eV,46 C![[double bond, length as m-dash]](https://www.rsc.org/images/entities/char_e001.gif) O (magenta) at 288.0 eV,47 and C–Mo (blue) at 283.7 eV,48 respectively. According to the characterization results, it can be concluded that the active sites of the catalysts are predominantly made of the carbide phase.
O (magenta) at 288.0 eV,47 and C–Mo (blue) at 283.7 eV,48 respectively. According to the characterization results, it can be concluded that the active sites of the catalysts are predominantly made of the carbide phase.
Table S2† shows the percentage of each Mo and C species obtained from the aforementioned XPS results. 1MoCx/Al2O3 contained 28.1% Mo2C (Mo2+) phase. Additionally, by including all carbide species (MoC, Mo4+), the relative composition of MoCx for 1MoCx/Al2O3 is 43.7%, which is much higher than that of its unsupported counterpart (7.4%). This is presumably due to the presence of smaller molybdenum particles that lead to a more rapid and complete carbonization. After the reaction, the C–Mo signals were not observed. The percentage of C–C increased together with the appearance of sharper C 1s signals over the spent catalysts. This suggested the formation of graphitic carbon that dominates the signals at a similar region.49
It can be seen in Table S2† that the surface C/Mo ratios of fresh, 6 h spent (Ar), 6 h spent (H2), 12 h spent (Ar), and 12 h spent (H2) 1MoCx/Al2O3 are 1.04, 5.66, 5.56, 11.23, and 6.78, respectively. It has been reported that the reactivity of molybdenum carbides depends on the C/Mo ratio, in which the catalyst with a lower C/Mo ratio is more reactive.38 In this case, the C/Mo ratio rapidly increased when the reaction was performed in the Ar atmosphere (from 1.04 (fresh) to 5.66 (6 h, Ar) to 11.23 (12 h, Ar)), while it was more stable in the H2 stream (from 1.04 (fresh) to 5.56 (6 h, H2) to 6.78 (12 h, H2)). Accordingly, the enhanced stability of CH4 conversion and TOF is likely related to the more consistent surface C/Mo ratio achieved when H2 is present.
The TOF of ACN and C2 was more stable when co-feeding H2. Additionally, it can be seen that the TOF of aromatics is suppressed by ∼87% at 25% H2. When the concentration of H2 is further increased to 33%, no aromatics can be initially found. Note that the CH4 conversion under these conditions is almost negligible, which explains the disappearance of aromatics. Therefore, 25% H2 was selected for 50 h stability testing.
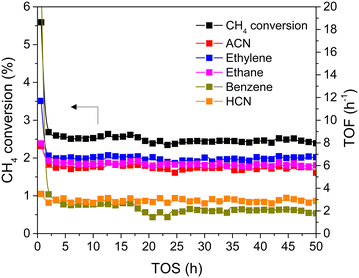
Fig. 7 shows that the on-stream activity was nearly unchanged in the 50 h duration test, underlining the stability of the reaction process. The CH4 conversion was maintained at approximately 2.5%. Moreover, three major products, including ACN, ethylene, and ethane, were also sustainably produced at a TOF of approximately 6.5 h−1. Aromatics and HCN were observed as by-products at a TOF of ∼2.5 h−1. Therefore, the presence of 25% H2 can not only suppress CH4 aromatization but also enhance the stability of the catalyst during the 50 h durability test.
Proposed mechanism
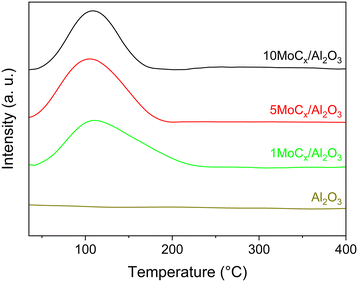
Our earlier work claimed that ACN is formed via surface CN species over GaN catalysts. The surface CN species are formed by reacting CH4 with mobile-N of GaN at the surface.50 Therefore, CN species may also form over the MoCx surface by N2 cleavage. Hence, in situ DRIFTS experiments were performed under a N2 atmosphere, as shown in Fig. S10.† Regrettably, no CN vibrational band (∼2220 cm−1) could be observed. This might be attributed to (i) the high instability of evolved intermediates or (ii) no interaction being formed between N2 and surface carbon of MoCx. The latter could be clarified by performing N2–H2 co-feeding experiments. In the N2–H2 co-feeding test, HCN should be generated if N2 and surface carbon react since the surface carbon of MoCx acts similarly to surface oxygen in the Mars–van Krevelen mechanism.51,52 However, no HCN could be generated (not shown), indicating that the surface carbon has no interaction with gaseous N2. Nevertheless, the aforementioned results showed that ACN could be generated in which the only N-source is N2. That is, the N![[triple bond, length as m-dash]](https://www.rsc.org/images/entities/char_e002.gif) N triple bond of N2 is activated. We conducted N2-TPD to further confirm that N2 can be adsorbed on the Al2O3-supported MoCx. As shown in Fig. 8, the desorption peak of N2 over the Al2O3-supported MoCx catalysts is located at approximately 107 °C, while no N2 desorption can be observed over bare Al2O3. This implies that N2 should be firstly adsorbed on the MoCx surface and then desorbed. Considering no interaction between N2 and surface carbon (C sites) of MoCx, it can be inferred that N2 adsorption occurs on metal (Mo) sites.53–56
N triple bond of N2 is activated. We conducted N2-TPD to further confirm that N2 can be adsorbed on the Al2O3-supported MoCx. As shown in Fig. 8, the desorption peak of N2 over the Al2O3-supported MoCx catalysts is located at approximately 107 °C, while no N2 desorption can be observed over bare Al2O3. This implies that N2 should be firstly adsorbed on the MoCx surface and then desorbed. Considering no interaction between N2 and surface carbon (C sites) of MoCx, it can be inferred that N2 adsorption occurs on metal (Mo) sites.53–56
To clarify, the CO and N2 uptakes were compared since CO is stoichiometrically adsorbed on Mo sites.57 As shown in Table S3,† the CO and N2 uptakes were nearly identical for the tested catalysts. This indicated that the adsorption behaviors of CO and N2 are similar. Accordingly, it can be concluded that the adsorption of N2 takes place at the Mo sites.
Although N2 activation by MoCx was elucidated, the formation of the C![[triple bond, length as m-dash]](https://www.rsc.org/images/entities/char_e002.gif) N bond and ACN is still unclear. A previous study revealed that CH4 tends to be completely dissociated on Mo sites exposed on the MoCx surface.58 The MoCx surface could be further carburized by the dissociated carbon adatoms diffusing into the subsurface layer, forming a MoC-like surface structure. The MoC-like surface could facilitate CH* coupling to form
N bond and ACN is still unclear. A previous study revealed that CH4 tends to be completely dissociated on Mo sites exposed on the MoCx surface.58 The MoCx surface could be further carburized by the dissociated carbon adatoms diffusing into the subsurface layer, forming a MoC-like surface structure. The MoC-like surface could facilitate CH* coupling to form  as a potential intermediate.58,59 The 1MoCx/Al2O3 had its C/Mo ratio estimated by XPS analysis close to unity (Table S2†), similar to that of MoC. That is, the surface of 1MoCx/Al2O3 should have an MoC-like structure. Thus, we propose that the formation of ACN occurs over the Mo sites exposed on the surface of the MoC-like structure, as shown in Fig. 9.
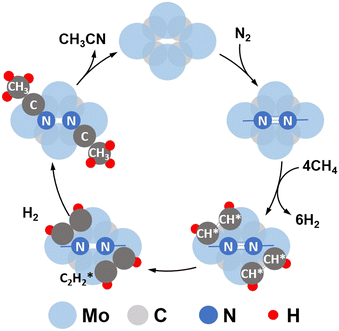 | ||
| Fig. 9 Proposed co-activation of CH4 and N2 to ACN over the MoCx catalyst (top view of the catalyst surface). | ||
N2 could be dissociatively adsorbed on the Mo-terminated surface. Then, CH4 would be activated and dehydrogenated over the adjacent Mo sites, forming CH* species. The CH* species could couple with  species that further react with N adatoms, forming ACN. The produced ACN could desorb from the surface, which fulfills the catalytic cycle.
To support this claim, kinetic analysis based on the Langmuir–Hinshelwood (LH) formalism of the proposed mechanism was performed, which is presented in the ESI.† The six possible reactions were grouped into four steps, including N2 adsorption, CH4 adsorption, surface reaction, and ACN desorption. The rate expression is derived by assuming that one of the above steps is rate-limiting while the remaining steps are all in equilibrium. The rate expression was fitted to the experimental data (see Table S4†) by nonlinear regression subject to minimizing the residual sum of squares to recover the values of the parameters (see Table S5†). By resorting to the fitted parameters and the parity plot (Fig. S11†), the surface reaction step is the most likely to occur. This result is supported by previous studies showing that the dissociative adsorption of N2 and the C–H bond cleavage of CH4 on the MoC surface are facile and unlikely to be rate-limiting.59,60
Conclusions
In this article, two high-stability compounds (CH4 and N2) were simultaneously converted to form ACN over Al2O3-supported MoCx catalysts. ACN could only be produced in the presence of N2, confirming the activation of the N![[triple bond, length as m-dash]](https://www.rsc.org/images/entities/char_e002.gif) N bond. Due to the strong interaction between MoCx and CH4, aromatization and coking were significant, resulting in catalyst deactivation. The aromatization could be diminished by co-feeding H2, in which the catalytic activity and TOF could be maintained for 50 h. The MoC-like surface structure of MoCx was proposed to be an active center for ACN synthesis. Kinetic analysis suggested that the surface reaction of adsorbed N2 and
N bond. Due to the strong interaction between MoCx and CH4, aromatization and coking were significant, resulting in catalyst deactivation. The aromatization could be diminished by co-feeding H2, in which the catalytic activity and TOF could be maintained for 50 h. The MoC-like surface structure of MoCx was proposed to be an active center for ACN synthesis. Kinetic analysis suggested that the surface reaction of adsorbed N2 and  species is possibly the rate-determining step.
Author contributions
Korawich Trangwachirachai: investigation, formal analysis, validation, and writing – original draft. I-Ting Kao: investigation and formal analysis. Wei-Hsiang Huang: XAS data collection and analysis. Chi-Liang Chen: XAS data collection and analysis. Yu-Chuan Lin: supervision, project administration, resources, and writing – review & editing.Conflicts of interest
The authors declare that they have no competing financial interests.Acknowledgements
This work was supported by the National Science and Technology Council (projects 109-2628-E-006-011-MY3, 110-2221-E-006-165-MY3, 110-2923-E-006-005-MY3, and 110-2927-I-006-506) and by the Higher Education Sprout Project, Ministry of Education to the Headquarters of University Advancement at National Cheng Kung University (NCKU). The authors gratefully acknowledge the use of XPS (ESCA003700) and TEM (EM000800) of NSTC 112-2740-M-006-001 belonging to the Core Facility Center of NCKU.References
- W. Jiang, J. Low, K. Mao, D. Duan, S. Chen, W. Liu, C. W. Pao, J. Ma, S. Sang, C. Shu, X. Zhan, Z. Qi, H. Zhang, Z. Liu, X. Wu, R. Long, L. Song and Y. Xiong, J. Am. Chem. Soc., 2021, 143, 269–278 CrossRef CAS PubMed.
- P. Schwach, X. Pan and X. Bao, Chem. Rev., 2017, 117, 8497–8520 CrossRef CAS PubMed.
- Z. Zhu, W. Guo, Y. Zhang, C. Pan, J. Xu, Y. Zhu and Y. Lou, Carbon Energy, 2021, 3, 519–540 CrossRef CAS.
- S. M. Kim, P. M. Abdala, D. Hosseini, A. Armutlulu, T. Margossian, C. Copéret and C. Müller, Catal. Sci. Technol., 2019, 9, 5745–5756 RSC.
- M. A. A. Aziz, A. A. Jalil, S. Wongsakulphasatch and D.-V. N. Vo, Catal. Sci. Technol., 2020, 10, 35–45 RSC.
- J. Niu, Y. Wang, Y. Qi, A. H. Dam, H. Wang, Y.-A. Zhu, A. Holmen, J. Ran and D. Chen, Fuel, 2020, 266, 117143 CrossRef CAS.
- B. C. Ekeoma, M. Yusuf, K. Johari and B. Abdullah, Int. J. Hydrogen Energy, 2022, 47, 41596–41620 CrossRef CAS.
- J. K. Dahl, A. W. Weimer, A. Lewandowski, C. Bingham, F. Bruetsch and A. Steinfeld, Ind. Eng. Chem. Res., 2004, 43, 5489–5495 CrossRef CAS.
- Y.-R. Luo, Comprehensive Handbook of Chemical Bond Energies, CRC Press, 2007, p. 1688, DOI:10.1201/9781420007282.
- W. Taifan and J. Baltrusaitis, Appl. Catal., B, 2016, 198, 525–547 CrossRef CAS.
- L. Sun, Y. Wang, N. Guan and L. Li, Energy Technol., 2019, 8, 1900826 CrossRef.
- D. C. Upham, V. Agarwal, A. Khechfe, Z. R. Snodgrass, M. J. Gordon, H. Metiu and E. W. McFarland, Science, 2017, 358, 917–921 CrossRef CAS PubMed.
- K. Dutta, V. Chaudhari, C.-J. Li and J. Kopyscinski, Appl. Catal., A, 2020, 595, 117430 CrossRef.
- K. Trangwachirachai, C.-H. Chen and Y.-C. Lin, Mol. Catal., 2021, 516, 111961 CrossRef CAS.
- K. Trangwachirachai, C.-H. Chen, A.-L. Huang, J.-F. Lee, C.-L. Chen and Y.-C. Lin, Catal. Sci. Technol., 2022, 12, 320–331 RSC.
- Z. Yuan, X. Zhang, Q. Yao, Y. Zhang and Y. Fu, J. Anal. Appl. Pyrolysis, 2019, 140, 376–384 CrossRef CAS.
- Future Market Insights, Acetonitrile Market, https://www.futuremarketinsights.com/reports/acetonitrile-market, 2023.
- A. Sieminski, US Energy Information Administration, 2015 Search PubMed.
- J. J. Sattler, J. Ruiz-Martinez, E. Santillan-Jimenez and B. M. Weckhuysen, Chem. Rev., 2014, 114, 10613–10653 CrossRef CAS PubMed.
- K. Trangwachirachai and Y.-C. Lin, Dalton Trans., 2023, 52, 6211–6225 RSC.
- A. Daisley and J. S. J. Hargreaves, Catal. Today, 2023, 423, 113874 CrossRef CAS.
- S. Tiwari, T. S. Khan, P. Tavadze and J. Hu, Chem. Eng. J., 2021, 413, 127501 CrossRef CAS.
- R. Kojima and K.-I. Aika, Appl. Catal., A, 2001, 219, 141–147 CrossRef CAS.
- R. Michalsky, Y.-J. Zhang, A. J. Medford and A. A. Peterson, J. Phys. Chem. C, 2014, 118, 13026–13034 CrossRef CAS.
- H. Cheng, L.-X. Ding, G.-F. Chen, L. Zhang, J. Xue and H. Wang, Adv. Mater., 2018, 30, 1803694 CrossRef PubMed.
- J. Gao, Y. Zheng, G. B. Fitzgerald, J. de Joannis, Y. Tang, I. E. Wachs and S. G. Podkolzin, J. Phys. Chem. C, 2014, 118, 4670–4679 CrossRef CAS.
- J. Jeong, A. Hwang, Y. T. Kim, D.-Y. Hong and M.-J. Park, Catal. Today, 2020, 352, 140–147 CrossRef.
- B. Cook, D. Mousko, W. Hoelderich and R. Zennaro, Appl. Catal., A, 2009, 365, 34–41 CrossRef CAS.
- B. Ravel and M. Newville, J. Synchrotron Radiat., 2005, 12, 537–541 CrossRef CAS PubMed.
- S. Paganelli, R. Tassini, V. D. Rathod, B. Onida, S. Fiorilli and O. Piccolo, Catal. Lett., 2021, 151, 1508–1521 CrossRef CAS.
- K. S. W. Sing and R. T. Williams, Adsorpt. Sci. Technol., 2004, 22, 773–782 CrossRef CAS.
- M. J. Ramos, A. Casas, L. Rodríguez, R. Romero and Á. Pérez, Appl. Catal., A, 2008, 346, 79–85 CrossRef CAS.
- S. K. Bej, C. A. Bennett and L. T. Thompson, Appl. Catal., A, 2003, 250, 197–208 CrossRef CAS.
- C. H. L. Tempelman and E. J. M. Hensen, Appl. Catal., B, 2015, 176–177, 731–739 CrossRef CAS.
- P. K. Roy and S. Kumar, ACS Appl. Energy Mater., 2020, 3, 7167–7179 CrossRef CAS.
- R. Gounder and E. Iglesia, J. Am. Chem. Soc., 2009, 131, 1958–1971 CrossRef CAS PubMed.
- M. C. Cholewinski, M. Dixit and G. Mpourmpakis, ACS Omega, 2018, 3, 18242–18250 CrossRef CAS PubMed.
- M. Figueras, R. A. Gutiérrez, H. Prats, F. Viñes, P. J. Ramírez, F. Illas and J. A. Rodriguez, Phys. Chem. Chem. Phys., 2020, 22, 7110–7118 RSC.
- H. Ma, R. Kojima, S. Kikuchi and M. Ichikawa, Catal. Lett., 2005, 104, 63–66 CrossRef CAS.
- C. Wu and J. Li, ACS Appl. Mater. Interfaces, 2017, 9, 41314–41322 CrossRef CAS PubMed.
- Y. N. Regmi, C. Wan, K. D. Duffee and B. M. Leonard, ChemCatChem, 2015, 7, 3911–3915 CrossRef CAS.
- X. Kong, S. Chen, Y. Zou, S. Lyu, X. She, Y. Lu, J. Sun, H. Zhang and D. Yang, Int. J. Hydrogen Energy, 2018, 43, 13720–13726 CrossRef CAS.
- H. Vrubel and X. Hu, Angew. Chem., Int. Ed., 2012, 51, 12703–12706 CrossRef CAS PubMed.
- J. Li, C. Zhou, J. Mu, E.-C. Yang and X.-J. Zhao, RSC Adv., 2018, 8, 17202–17208 RSC.
- H. Wei, Q. Xi, X. A. Chen, D. Guo, F. Ding, Z. Yang, S. Wang, J. Li and S. Huang, Adv. Sci., 2018, 5, 1700733 CrossRef PubMed.
- L. Diao, J. Qin, N. Zhao, C. Shi, E. Liu, F. He, L. Ma, J. Li and C. He, J. Mater. Chem. A, 2018, 6, 6054–6064 RSC.
- Y. Lei, Y. Yang, Y. Liu, Y. Zhu, M. Jia, Y. Zhang, K. Zhang, A. Yu, J. Liu and J. Zhai, Nanoscale Res. Lett., 2019, 14, 329 CrossRef PubMed.
- D. Wang, J. Wang, X. Luo, Z. Wu and L. Ye, ACS Sustainable Chem. Eng., 2018, 6, 983–990 CrossRef CAS.
- P. Xiao, X. Ge, H. Wang, Z. Liu, A. Fisher and X. Wang, Adv. Funct. Mater., 2015, 25, 1520–1526 CrossRef CAS.
- K. Trangwachirachai, A. L. Huang, H. K. Chen, C. L. Chen, J. F. Lee, H. K. Tian and Y. C. Lin, Mater. Today Chem., 2023, 30, 101500 CrossRef CAS.
- I. Vollmer, B. van der Linden, S. Ould-Chikh, A. Aguilar-Tapia, I. Yarulina, E. Abou-Hamad, Y. G. Sneider, A. I. O. Suarez, J.-L. Hazemann, F. Kapteijn and J. Gascon, Chem. Sci., 2018, 9, 4801–4807 RSC.
- G. Li, I. Vollmer, C. Liu, J. Gascon and E. A. Pidko, ACS Catal., 2019, 9, 8731–8737 CrossRef CAS.
- M. Grunze, M. Golze, W. Hirschwald, H. J. Freund, H. Pulm, U. Seip, M. C. Tsai, G. Ertl and J. Küppers, Phys. Rev. Lett., 1984, 53, 850–853 CrossRef CAS.
- S. Dahl, A. Logadottir, R. C. Egeberg, J. H. Larsen, I. Chorkendorff, E. Törnqvist and J. K. Nørskov, Phys. Rev. Lett., 1999, 83, 1814–1817 CrossRef.
- J. J. Mortensen, L. B. Hansen, B. Hammer and J. K. Nørskov, J. Catal., 1999, 182, 479–488 CrossRef CAS.
- W. Liao, L. Qi, Y. Wang, J. Qin, G. Liu, S. Liang, H. He and L. Jiang, Adv. Funct. Mater., 2021, 31, 2009151 CrossRef CAS.
- J. S. Lee, K. H. Lee and J. Y. Lee, J. Phys. Chem., 1992, 96, 362–366 CrossRef CAS.
- T. Zhang, X. Yang and Q. Ge, Catal. Today, 2021, 368, 140–147 CrossRef CAS.
- T. Zhang, X. Yang and Q. Ge, Catal. Today, 2020, 339, 54–61 CrossRef CAS.
- I. Matanovic and F. H. Garzon, Phys. Chem. Chem. Phys., 2018, 20, 14679–14687 RSC.
Footnote |
| † Electronic supplementary information (ESI) available: Time on stream (TOS) profiles and N2 adsorption/desorption isotherms. See DOI: https://doi.org/10.1039/d3cy00585b |
| This journal is © The Royal Society of Chemistry 2023 |

