 Open Access Article
Creative Commons Attribution 3.0 Unported Licence
Toward a new definition of surface energy for late transition metals†
Alexandre
Boucher
a,
Glenn
Jones
b and
Alberto
Roldan
 *a
*a
aCardiff Catalysis Institute, School of Chemistry, Cardiff University, Main Building, Park Place, Cardiff, CF10 3AT, Wales, UK. E-mail: roldanmartineza@cardiff.ac.uk
bJohnson Matthey Technology Center, Blounts Ct Rd, Sonning Common, Reading, RG4 9NH, UK
First published on 12th December 2022
Abstract
Surface energy is a top-importance stability descriptor of transition metal-based catalysts. Here, we combined density functional theory (DFT) calculations and a tiling scheme measuring surface areas of metal structures to develop a simple computational model predicting the average surface energy of metal structures independently of their shape. The metals considered are W, Ru, Co, Ir, Ni, Pd, Pt, Cu, Ag and Au. Lorentzian trends derived from the DFT data proved effective at predicting the surface energy of metallic surfaces but not for metal clusters. We used machine-learning protocols to build an algorithm that improves the Lorentzian trend's accuracy and is able to predict the surface energies of metal surfaces of any crystal structure, i.e., face-centred cubic, hexagonal close-packed, and body-centred cubic, but also of nanostructures and sub-nanometer clusters. The machine-learning neural network takes easy-to-compute geometric features to predict metallic moieties surface energies with a mean absolute error of 0.091 J m−2 and an R2 score of 0.97.
1. Introduction
Catalysis is of crucial importance to the economy and for a sustainable future. Since its discovery in the 1800s,1 heterogeneous catalysis has played a significant role in the chemical industry and, more recently, in applications such as fuel cells2–4 and environmental control.5 Supported metal nanoparticles (NPs) are common heterogeneous catalysts that may exhibit completely different properties from bulk metals.6–8 Quantifying the stability of a given nanocatalyst has always been challenging as it is affected by the environment, the nature of the support and its shape and size.2,9–11Building on the Gibbs–Thomson relationship between the chemical potential (μ) and surface energy (γ), C. T. Campbell et al. developed a kinetic model to predict the growth of NPs as a function of time, which also depends on the NPs’ adhesion energy to the support (Eadh).12–14 Campbell's equation was successfully applied to predict the growth of multiple supported transition metals such as Ni,15,16 Ag17 and Cu at different temperatures.18 These specific descriptors, i.e., γ and Eadh, are crucial for understanding the NPs’ stability and resistance to sintering, a phenomenon commonly leading to the loss of catalytic activity.19–22
The surface energy measures the energy difference per unit area between a given surface and its bulk material.23 Experimental measurements of this property remain challenging and have mostly been limited to extrapolations from the liquid-state surface tensions, which provide only the average energy over the metal's surfaces.24,25 Nowadays, computational methods such as the density functional theory (DFT) predict the energy excess associated with specific surfaces and symmetric structures.23,26 However, metal-based NPs, especially sub-nanometre clusters, are irregular and present a collection of low and high-index facets, edges and corners, all of them having different properties.27,28 Therefore, predicting the local surface energy at the atomic scale would promote an intelligent design of nanocatalysts with high robustness.29,30
In the present work, we introduce an innovative model predicting accurate surface energies and surface areas using electron-independent descriptors such as the coordination number (CN). The CN is an accessible parameter easy to calculate by finding the number of closest neighbours around a given surface atom. We used machine learning neural network techniques to build a model able to predict accurate surface energies of any metallic structure independently of their size and shape. The neural network was trained with a multi-layer perceptron (MLP) algorithm fed with geometrical descriptors (features) and DFT-derived surface energies (targets) of slabs, closed-shell NPs (also known as magic number clusters), and small metal moieties with morphologies taken from the literature.31–34
2. Methodology
Computational details
All DFT calculations related to structure optimisation and energies were carried out using spin-polarised DFT as implemented in the Vienna Ab Initio Simulation Package (VASP).35–37 The revised PBE functional from Perdew, Burke and Ernzerhof38,39 was used to calculate the exchange-correlation energy and the projector-augmented wave (PAW) pseudo-potentials to describe the core electrons.37,40 The effect of considering all-electron potentials in these calculations has been observed as negligible and certainly does not affect the derived trends.41,42 Dispersion corrections were accounted for through Grimme's empirical dispersion correction, DFT-D3.43 The plane-wave kinetic cut-off and the electronic convergence threshold were set to 600 and 10−5 eV, respectively, thus ensuring accurate and consistent results. The ionic relaxations had a convergence criterion of 0.01 eV Å−1. All the bulk and slabs were calculated with a k-grid of 0.2 Å−1.Metallic structures of W, Ru, Co, Ir, Ni, Pd, Pt, Cu, Ag and Au were built from the fully optimised bulk. Transition metal slabs were simulated by a 5 × 5 × 5 supercell, with 10 Å of vacuum along the z-axis, guaranteeing no electronic interactions between periodic images. All slabs were formed with 5 atomic layers in thickness, being the uppermost 2 layers completely unconstrained during the relaxation process. Dipole corrections were applied perpendicular to the slabs.
Transition metal nanoparticles and clusters were modelled at the centre of a simulation cell with at least 10 Å of vacuum between periodic images and using a single k-point, the Γ-point. All atoms were relaxed upon geometry optimisation with the same criteria as the surfaces, i.e. a convergence threshold of 0.01 eV Å−1.
Surface energy prediction
The first step toward a model predicting the surface energy of a given surface was to design a set of slabs exposing atoms with different environments, including extended and punctual defects such as steps, vacancies, and adatoms. The surface energy definition is expressed in eqn (1):| γbot·Abot + γtop·Atop = Eslab − n·Ebulk | (1) |
 | (2) |
 | (3) |
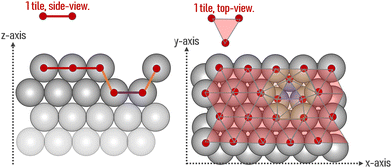
The area of a slab is commonly derived from the cell axis, i.e. A = a·b, as described in Fig. 1. However, this approach is only valid for low-index surfaces such as (111) and (001) of fcc metals, which are completely flat. In order to accurately compute the area of flat, stepped, and defective surfaces, and by extension, of NPs of any morphology, we developed a tiling scheme in which each atom is linked to its two closest neighbours also in contact between them, forming a triangular tile. This tiling scheme allows us to sample a surface more efficiently than using the a·b approximation. In practice, the smaller the tiles, the more accurate the approximation. Tiles enable one to describe corrugated and defective surfaces (in addition to flat surfaces) and associate local contributions of atomically resolved geometries with surface energy changes. The tiling scheme, thus, leads to a more flexible definition of the surface energy than the standard approach of projecting the excess energy into a 2D plane. We identified each triangular tile corner with the atomic position, as illustrated in Fig. 2.
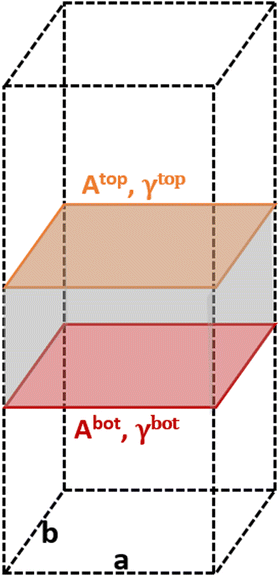 | ||
| Fig. 1 Illustration of the metal slabs; a and b indicate the periodic cell lattice of the x- and y-axis, and A and γ are the area and surface energies of the top and bottom sides of the slab. | ||
From a set of slabs exposing atoms with different coordination numbers (CN), the total top area, Atop is the sum of the areas of each atom, ACNi, with coordination i in the range [3, 11]. CNs 1 and 2 are not accessible without compromising the physical meaning of the slab model, as no stable surface presents these CNs. Note that we considered atomic coordination as the number of first neighbours at close distance, although, strictly, coordination implies the interaction coordinating atoms’ electronic structure. We adopted this approach based on the metallic behaviour of the large systems and the electron-rich orbitals of the selected transition metals. Therefore, for fcc and hcp crystal structures, the bulk presents a coordination of 12, whereas, for the bcc metals, the bulk presents a maximum CN of 8, and realistic slabs allow defining from CN = 3 to CN = 7. ACNi can be calculated by solving a system of equations in the form of eqn (4):
 | (4) |
 | (5) |
Similar to slabs, the surface energies of metal clusters were computed using the following eqn (6):
 | (6) |
The multi-layer perceptron (MLP) developed during this work was built using Python's SciKit-Learn and Keras libraries.44,45 The dataset employed to train the MLP contains targets (surface energies calculated from eqn (6)) and features in the form of a vector with multiple geometrical descriptors. Several descriptors were tested, including the individual ratio of atoms from CN = 2 to CN = 11, but also the groups CN(2, 3), CN(4, 5), CN(6, 7), CN(8, 9), CN(10, 11), the kinetic radius, the surface atomic density, the average CN on the surface, and the average Generalised Coordination Number (GCN). We calculated the different CN ratios from eqn (7):
 | (7) |
 | (8) |
 | (9) |
The kinetic radius was taken as the furthest distance between two atoms in a cluster and arbitrarily set to 0.000 Å for metal slabs. Other class variables included in the features vector were the element and the nature of the system: Slab, particle or sub-nanometer cluster. These class variables were turned into numerical values using a one-hot-encoder pre-processor.
Numerical descriptors were selected depending on their variance and correlation to the target, i.e., the surface energy. The optimum set of parameters forming an input vector for the MLP was the following: Atom type, nature of the system, kinetic radius, average CN, average GCN, surface atomic density, and the ratio of atoms with CN(4, 5), CN(6, 7), CN(8, 9) and CN(10, 11). The dataset was split in an 80![[thin space (1/6-em)]](https://www.rsc.org/images/entities/char_2009.gif) :
:![[thin space (1/6-em)]](https://www.rsc.org/images/entities/char_2009.gif) 20 ratio between the training and test sets. It means that the MLP was trained with 80% of the data, and 20% was kept aside to evaluate its performance. During the training phase, cross-validation was employed using a shuffle split scheme, splitting the training set into 5 distinct subsets (Table 1).
20 ratio between the training and test sets. It means that the MLP was trained with 80% of the data, and 20% was kept aside to evaluate its performance. During the training phase, cross-validation was employed using a shuffle split scheme, splitting the training set into 5 distinct subsets (Table 1).
| Metal surface | Supercell size | A tiling, Å2 | A flat, Å2 | Difference, % |
|---|---|---|---|---|
| Pd(111) | 5 × 5 | 167.11 | 167.11 | 0.00 |
| Pd(100) | 5 × 5 | 192.96 | 192.96 | 0.00 |
| Pd(110) | 3 × 3 | 118.84 | 98.24 | 17.33 |
| Pt(111) | 5 × 5 | 167.92 | 167.92 | 0.00 |
| Pt(100) | 5 × 5 | 193.90 | 193.90 | 0.00 |
| Pt(110) | 5 × 5 | 323.41 | 274.21 | 15.21 |
| Ir(111) | 5 × 5 | 159.84 | 159.84 | 0.00 |
| Ir(100) | 5 × 5 | 184.57 | 184.57 | 0.00 |
| Ir(110) | 5 × 5 | 309.29 | 261.02 | 15.61 |
3. Results and discussion
Tiling scheme validation
Predicted areas of fcc metals with low Miller indexes, i.e., (100), (111) and (110), were used to validate the described tiling scheme and compare the results with areas calculated as a flat parallelogram, Aflat, formed by the unit cell vectors a and b in eqn (10): | (10) |
The two methods perfectly match the (111) and (100) as these surfaces are flat. However, the (110) areas measured from the tiling scheme are between 15 and 17% higher than the ones calculated with the flat approximation. Note that the difference between metals is due to the surface relaxation; all (110) surface areas are slightly less than the 18.35% predicted by an idealised bulk terminated surface. Nevertheless, The extent of the (110) surface area measured with the tiling scheme is consistent with experimental scanning-tunnelling-microscopy (STM) and atomic-force-microscopy (AFM) observations,48–50 and with computational methods reporting the presence of steps on this particular surface of fcc metals.51,52 The agreement between atomic-resolution experimental techniques observations and the computational tiling scheme highlights the relevance of the method. Fig. 4 illustrates multiple Pd surfaces, including a step, an adatom, and a vacancy, and the areas calculated using the tiling scheme and the flat area approximation.
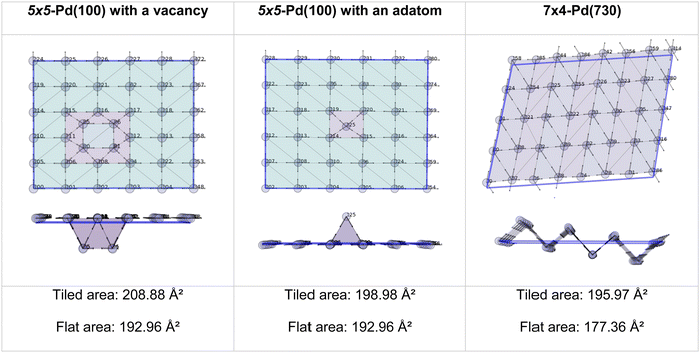 | ||
| Fig. 4 Top and side view of 3 Pd-surface representations with a vacancy (left), an adatom (middle), and a step (right). | ||
Prediction of the surface energy
Solving the system of equations with the form given in eqn (4) and (5) for the different atomic coordination allows one to build mathematical functions describing the atomic areas and the surface energies. For all transition metals tested, these functions took the form of a Lorentzian trend described by eqn (11): | (11) |
The parameters a, b, c and d were determined using function-fitting tools available in the SciPy library53 and are given in Table S1 of the ESI.† The trends for atomic areas, A, and their surface energies, γ, are presented in Fig. 5. The trends in the area prediction are very close to being linear for Ag, Pd and Au, while for Ru, Pt, Ir and Cu, these are curved along the CN axis. The calculated Pearson coefficient (R2) describing the correlation between the DFT-derived and computed areas is in the range [0.82, 0.98], corresponding to fcc-Ru and Pd, respectively, with most of them being well above 0.90, i.e., strongly correlated. The values for bulk coordination were not considered for the area prediction. The trends on the γ-prediction as a function of CN are inversely proportional to the areas, showing that the orbitals in undercoordinated atoms tend to rearrange and contract to stabilise the surface, as observed on the γ-plateau at low atomic coordination, especially for hcp-Ru, Au, W and Pd.
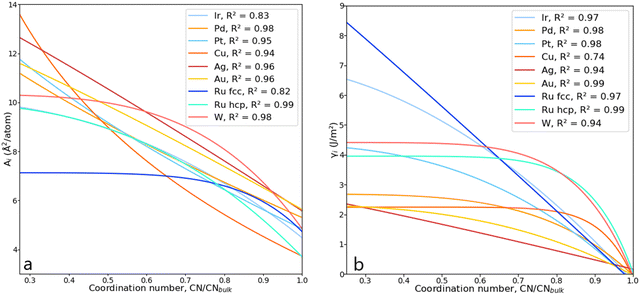 | ||
| Fig. 5 (a) Lorentzian trends expressing the areas, Ai, as a function of CN for various metals. (b) Lorentzian trends expressing the surface energy, γi, as a function of CN. | ||
A validation set of multiple slabs (including low-indexes, high-indexes, and defective surfaces) was built for each metal studied. For Pt, Ir, Au, Ag and Cu, a standard validation set containing 7 slabs was designed. Pd was selected for an extended set with 14 slabs (more details in Table S2 in the ESI†). For Ru, whose typical crystal structure is hcp, we built 6 surfaces with the hcp character and 6 with the fcc character. Then, we investigated two approaches to validate the predicting model: The discrete method and the average method. The first one expresses the area, Ad, as well as the surface energy, γd, as a sum of all atomic contributions as described in eqn (12):
 | (12) |
 | (13) |
Comparing the mean absolute error (MAE) of the average and the discrete methods against the calculated tile scheme and DFT surface energies reveals that the average method is slightly more accurate than the discrete one, as shown in Fig. 6. The largest error (0.300 J m−2) with the average method is obtained for the unique bcc metal included in this work, W, whereas for fcc metals, γa shows excellent results (MAE around 0.100 J m−2 or lower, except for Ir). The discrete method outperforms the average one only for Ru-hcp, which discrete MAE is 0.090 J m−2 lower than the average method.
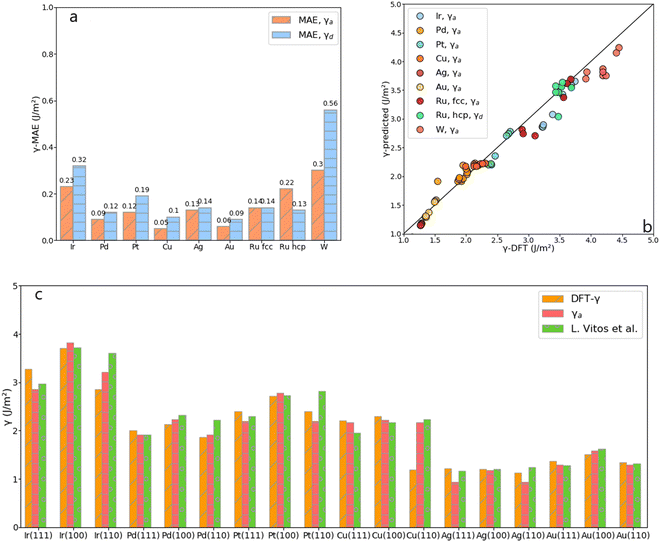 | ||
| Fig. 6 (a) MAE obtained from the average, γa, and the discrete, γd, approach for each metal. (b) DFT-γ against γ-predicted (γa and γd in the legend) for each metal. (c) Comparison between the DFT-γ calculated in this work using the tiling scheme (Orange), with γa (Pink), and values calculated by L. Vitos et al. (Green).26 | ||
Fig. 6 also compares the predicted and DFT-derived surface energies of low-index fcc surfaces against the values provided by L. Vitos et al.,26 (details given in Table S3 in the ESI†). It shows that for both DFT-γ and γa, the fcc (111) and (110) surfaces are very similar between them. Indeed, The fcc (110) surface atoms have an average CN = 9 distributed over a sizeable non-flat area.
Multi-layer perceptron (MLP)
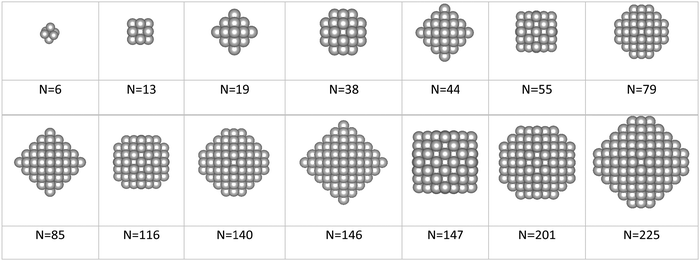
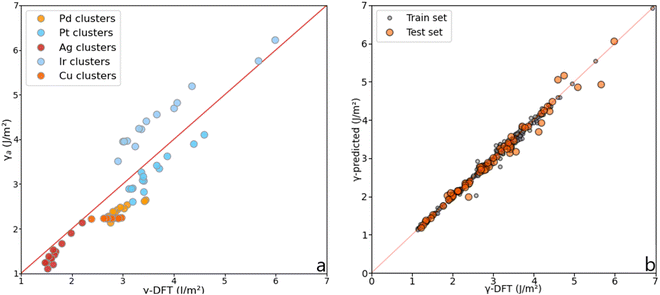
Although the Lorentzian trends accurately predict the surface energy of metal slabs, they are inconsistent with the surface energy of metal clusters. Fig. 7 shows the MAEs obtained for magic clusters, which are in the range of 0.2–0.7 J m−2, higher than the MAEs obtained for metal slabs. This result can be explained by the fact that NPs, contrarily to slabs, are isolated, non-periodic objects with a high ratio between surface and bulk atoms.The initial dataset containing 245 metal slabs and magic clusters (Pd, Pt, Ir, Cu, Ag, Au, Ru(hcp) and W(bcc)) was extended with 14 Co(fcc), 16 Co(hcp), 14 Ru(fcc) slabs, 10 Ru closed-shell NPs, 12 Ir,34 and 26 Pd sub-nanometer clusters,33 leading to a dataset of 337 structures. On a training set containing 68 features randomly selected from the dataset, the MLP scored R2 = 0.97 with a mean absolute error (MAE) of 0.091 J m−2, which is better than the Lorentzian equations developed for slabs. Also, the MLP scored a very low median absolute error of 0.052 J m−2, meaning that half of the test set population's MAE is below this value. These results are summarised in Fig. 8. The learning curve shows that the score on the test set from 180 structures in the training set remains consistent. Namely, adding more data to the dataset is unlikely to improve the MLP performance.
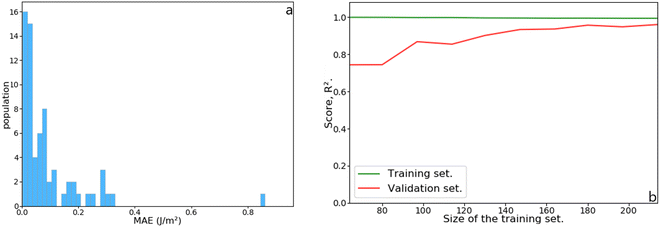 | ||
| Fig. 8 (a) Histogram of the mean absolute error (MAE) as a function of the population in the test set. (b) Learning curve as a function of increasing training set size. | ||
Surface energies and Wulff construction
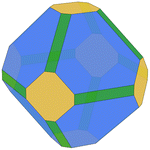
We predicted the morphology of large gas-phase NPs from the surface energies obtained from Vitos et al.,26 DFT and MLP derived using the Wulffpack Python package.54 There are substantial experimental evidence that fcc-NPs tend to exhibit (111) and (100) facets rather than (110),55,56 as shown by the Wulff representation from Vitos’ data illustrated in Table 2. The morphologies derived from DFT-γ and MLP-γ, however, present large deviations. The (110) surface energy is very close to (111) due to the extra area described with the tiles scheme.The deviation from the DFT-γ and MLP-γ models arises because the (110) facet is not considered a flat surface and presents two very distinctive atomic coordination, CN = 7 and CN = 11. However, atoms with CN = 11 are not easily accessible, and the most external atoms with CN = 7 determine the surface growth.57,58 Furthermore, Wulff's theory is also limited to predictions on large NPs that exhibit defined facets,59–61 primarily low-index due to their superior stability, for which one can assume that these facets are 2-dimensional.62 Namely, in order to use the energies predicted by the tiling scheme, they would also need to be projected into the 2D plane.63 We computed the Pd(110) surface energy on a flat surface, DFT-flat-γ = 2.192 J m−2, resulting in a much larger value than the DFT-γ (1.863 J m−2), and used it to construct the Wulff morphology of a 5000 atom gas-phase NP, Table 2. The ratio between the different facets is much closer to those predicted using Vitos et al. surface energies.
Small particles, e.g., sub-nanometre clusters less than 40 atoms in size, do not exhibit any particular facets,64–66 and therefore, the Wulff construction fails to predict their shape. Herein, we have presented a way to compute the surface energy of such particles by computing their excess energy from DFT combined with the tiling scheme's prediction to calculate their surface energies and train a MLP model. Predicting the surface energy of sub-nanometer clusters is a step forward toward better predicting their stability through a more accurate forecast of the chemical potential.20
4. Conclusion
In this work, we successfully developed a tiling scheme to accurately measure the surface area of slabs and clusters independently of their size and shape, providing a robust method to evaluate surface energies. We used the areas and the DFT calculated surface energies to build systems of equations resulting in a series of Lorentzian functions predicting the surface energy per metal atom as a function of its CN. We showed that for fcc metals, the low index surface energy increases as follows, (111) < (110) < (100), in contradiction with some results in the bibliography. We utilise the Lorentzian trends to predict surface energies following two protocols, the average and the discrete methods. From the results obtained on the slabs validation set, we figured out that better predictions are obtained from the average method, although none of them extrapolates successfully to small NPs. We successfully overcame the extra complexity by incorporating metal clusters into the dataset and training a MLP model capable of predicting the surface energy of closed-shell NPs, and small gas-phase clusters. The MLP only requires accessible geometric features of the structure, such as average CN, average GCN, kinetic radius, surface atomic density and ratio of atoms with CN = 4–5, 6–7, 8–9 and 10–11. The trained MLP performs exceptionally well on slabs and metal clusters, independently of their size and shape, reaching the score of R2 = 0.97 with a mean absolute error of 0.091 J m−2.The model presented here to predict surface energies fails to generate correct Wulff construction because it does not consider low-index surfaces as flat but corrugated surfaces. Projecting surface energies into 2D planes remains accurate when considering large nanoparticles. The approach developed in this work applies to sub-nanometer particles and allows the prediction their surface energies. The robust model presented aims at improving the understanding of metal atoms’ site stability, as the surface energy has been identified as a key descriptor of the catalytic reactivity and, therefore, for the design of durable catalysts.
Conflicts of interest
There are no conflicts to declare.Acknowledgements
A. B. acknowledges the contribution of Johnson Matthey for sponsoring his PhD scholarship. Via our membership of the UK's HEC Materials Chemistry Consortium, funded by EPSRC (EP/R029431), this work used the United Kingdom Materials and Molecular Modelling Hub for computational resources, MMM Hub, which is partially funded by EPSRC (EP/T02213). We also acknowledge Supercomputing Wales for access to the Hawk HPC facility, part-funded by the European Regional Development Fund via the Welsh Government.References
- S. M. George, Introduction: Heterogeneous catalysis, Chem. Rev., 1995, 95, 475–476 CrossRef CAS.
- C.-H. Cui and S.-H. Yu, Engineering interface and surface of noble metal nanoparticle nanotubes toward enhanced catalytic activity for fuel cell applications, Acc. Chem. Res., 2013, 46(7), 1427–1437 CrossRef CAS PubMed.
- Z. Yin, L. Lin and D. Ma, Construction of Pd-based nanocatalyst for fuel cells: Opportunities and challenges, Catal. Sci. Technol., 2014, 4, 4116 RSC.
- E. Antolini, Palladium in fuel cell catalysis, Energy Environ. Sci., 2009, 2, 915–931 RSC.
- W.-H. Wang, Y. Himeda, J. T. Muckerman, G. F. Manbeck and E. Fujita, CO2 hydrogenation to format and methanol as an alternative to photo-and electrochemical CO2 reduction, Chem. Rev., 2015, 115, 12936–12973 CrossRef CAS PubMed.
- Y. Lu and W. Chen, Sub-nanometre size metal clusters: From synthetic challenges to unique property discoveries, Chem. Soc. Rev., 2012, 41, 3594–3623 RSC.
- R. Jin and T. Higaki, Open questions on the transition between nanoscale and bulk properties of metals, Commun. Chem., 2021, 4, 28 CrossRef CAS.
- S. H. Yau, O. Varnavski and T. Goodson, An ultrafast look at Au nanoclusers, Acc. Chem. Res., 2012, 45(7), 1506–1516 CrossRef.
- F. F. Schweinberg, M. J. Berr, M. Doblinger, C. Wolff, K. E. Sanwald, A. S. Crampton, C. J. Ridge, F. Jackel, J. Feldman, M. Tschurl and U. Heinz, Cluster size effect in the photocatalytic hydrogen evolution reaction, J. Am. Chem. Soc., 2013, 135, 13262–13265 CrossRef PubMed.
- A. Nakhaei Pour and M. Housaindokht, Fisher-Tropsch, synthesis over CNT supported Cobalt catalyst: Role of metal nanoparticle size on catalyst activity and products selectivity, Catal. Lett., 2013, 143(12), 1328–1338 CrossRef CAS.
- Y. Zhang, D. J. A. Michel Ligthart, X.-Y. Quek, L. Gao and E. M. J. Hensen, Influence of Rh nanoparticle size and composition on the photocatalytic water splitting performance of Rh/graphitic carbon nitride, Int. J. Hydrogen Energy, 2014, 39, 11537–11546 CrossRef CAS.
- C. A. Johnson, Generalization of the Gibbs-Thomson relation, Surf. Sci., 1965, 3, 429–444 CrossRef.
- C. T. Campbell, S. C. Parker and D. E. Starr, The effect of size-dependent nanoparticle energetics on catalyst sintering, Science, 2002, 298(5594), 811–814 CrossRef CAS PubMed.
- S. C. Parker and C. T. Campbell, Kinetic model for sintering of supported metal particles with improved size-dependence energetics and applications to Au on TiO2(110), Phys. Rev. B: Condens. Matter Mater. Phys., 2007, 75, 035430 CrossRef.
- Z. Mao and C. T. Campbell, Predicting a key catalyst-performance descriptor for supported metal nanoparticles: Metal chemical potential, ACS Catal., 2021, 11, 8284–8291 CrossRef CAS.
- Z. Mao, W. Zhao, Z.-A. Al-Mualem and C.-T. Campbell, Energetics and structure of Nickel atoms and nanoparticles on MgO(100), J. Phys. Chem. C, 2020, 124, 1485–1495 Search PubMed.
- Z. Mao, J. R. Rumptz and C. T. Campbell, Energetics of Ag adsorption on and adhesion to Rutile TiO2(100) studied by microcalorimetry, J. Phys. Chem. C, 2021, 125, 3036–3046 CrossRef CAS.
- T. E. James, S. L. Hemmingson and C. T. Campbell, Energy of supported metal catalyst: From single atoms to large metal nanoparticle, ACS Catal., 2015, 5, 5673–5678 CrossRef CAS.
- C. T. Campbell, Energy of supported metal catalyst: From single atoms to large metal nanoparticle, Acc. Chem. Res., 2013, 46(8), 1712–1719 CrossRef CAS PubMed.
- Y. Dai, P. Lu, Z. Cao, C. T. Campbell and Y. Xia, The physical chemistry behind sinter-resistant catalysts, Chem. Soc. Rev., 2018, 47, 4314 RSC.
- C. T. Campbell and J. R. V. Sellers, Anchored metal nanoparticles: Effects on support and size on their energy, sintering resistance and reactivity, Faraday Discuss., 2013, 162, 9–30 RSC.
- X. Zhou, W. Xu, G. Liu, D. Panda and P. Chen, Size-dependent catalytic activity and dynamics of Gold nanoparticles at the single-molecule level, J. Am. Chem. Soc., 2010, 132, 138–146 CrossRef CAS PubMed.
- J.-Y. Lee, M. P. J. Punkkinen, S. Schönecker, Z. Nabi, K. Kàdas, V. Zòlomi, Y. M. Koo, Q.-M. Hu, R. Ahuja, B. Johansson, J. Kollar, L. Vitos and S. K. Kwon, The surface energy and stress of metals, Surf. Sci., 2018, 674, 51–68 CrossRef CAS.
- W. R. Tyson and W. A. Miller, Surface free energies of solid metals: Estimation from liquid surface tension measurements, Surf. Sci., 1977, 62, 267–276 CrossRef CAS.
- F. R. de Boer, R. Boom, W. C. M. Mattens, A. R. Miedema and A. K. Niessen, Cohesion in metals, Amsterdam 1988 Search PubMed.
- L. Vitos, A. V. Ruban, H. L. Skriver and J. Kollár, The surface energy of metals, Surf. Sci., 1998, 411, 186–202 CrossRef CAS.
- T. Jiang, D. J. Mowbray, S. Dobrin, H. Falsig, B. Hvolbæk, T. Bligaard and J. K. Norskov, Trends in CO oxidation rates for metal nanoparticles and closed-packet, stepped and kinked surfaces, J. Phys. Chem. C, 2009, 113, 10548–10553 CrossRef CAS.
- M. A. Petersen, J.-A. van den Berg, I. M. Ciobica and P. van Helden, Revisiting CO activation on Co catalyst: Impact of step and kink sites from DFT, ACS Catal., 2017, 7, 1984–2002 CrossRef CAS.
- C. M. Friend and B. Xu, Heterogeneous catalysis: A central science for a sustainable future, Acc. Chem. Res., 2017, 50, 517–521 CrossRef CAS PubMed.
- E. D. Goodman, J. A. Schwalbe and M. Cargnello, Mechanistic understanding and the rational design of sinter-resistant heterogeneous catalyst, ACS Catal., 2017, 7, 7156–7173 CrossRef CAS.
- S. F. Li, X. J. Zhao, X. S. Xu, Y. F. Gao and Z. Zhang, Stacking principle and magic sizes of transition metal nanoclusters based on generalized Wulff construction, Phys. Rev. Lett., 2013, 111, 115501 CrossRef CAS PubMed.
- J. P. K. Doye and D. J. Wales, Magic numbers and growth sequences of small face-centred-cubic and decahedral clusters, Chem. Phys. Lett., 1995, 247, 339–347 CAS.
- P. Nava, M. Sierka and R. Alhrichs, Density functional theory study of Palladium clusters, Phys. Chem. Chem. Phys., 2003, 5, 3372–3381 RSC.
- J. B. A. Davis, A. Shayeghi, S. L. Horswell and R. L. Johnston, The Birmingham parallel genetic algorithm and its application to the direct DFT global optimisation of IrN (N = 10-20) clusters, Nanoscale, 2015, 7, 14032–14038 RSC.
- G. Kresse and J. Hafner, Ab initio molecular dynamics for liquid metals, Phys. Rev. B: Condens. Matter Mater. Phys., 1993, 47(1), 558–561 CrossRef CAS PubMed.
- G. Kresse and J. Furthmüller, Efficient iterative schemes for ab initio total-energy calculations using a plane-wave basis set, Phys. Rev. B: Condens. Matter Mater. Phys., 1996, 54(16), 11169–11186 CrossRef CAS PubMed.
- G. Kresse and D. Joubert, From ultrasoft pseudopotentials to the projector augmented wave method, Phys. Rev. B: Condens. Matter Mater. Phys., 1999, 59(3), 1758–1775 CrossRef CAS.
- J. P. Perdew, K. Burke and M. Ernzerhof, Generalized Gradient Approximation made simple, Phys. Rev. Lett., 1996, 77, 3865–3868 CrossRef CAS PubMed.
- Y. Zhang and W. Yang, Comment on ‘Generalized Gradient Approximation made simple’, Phys. Rev. Lett., 1998, 80(4), 890 CrossRef CAS.
- P. E. Blochl, Projector augmented-wave method, Phys. Rev. B: Condens. Matter Mater. Phys., 1994, 50(24), 17953–17979 CrossRef PubMed.
- A. Kiejna, G. Kresse, J. Rogal, A. De Sarkar, K. Reuter and M. Scheffler, Comparison of the full-potential and frozen-core approximation approaches to density-functional calculations of surfaces, Phys. Rev. B: Condens. Matter Mater. Phys., 2006, 035404 CrossRef.
- J. L. F. da Silva, C. Stampfl and M. Scheffler, Converged properties of clean metal surfaces by all-electrons first-principles calculations, Surf. Sci., 2006, 600, 703–715 CrossRef CAS.
- S. Grimme, J. Antony, S. Ehrlich and H. Krieg, A consistent and accurate ab initio parametrization of density functional dispersion correction (DFT-D) for the 94 elements H-Pu, J. Chem. Phys., 2010, 132, 154104 CrossRef PubMed.
- Pedregosa et al. , Sci-Kit Learn v.1.1.1, JMLR 12, Scikit-Learn: Machine learning in Python, 2011, 2825–2830 Search PubMed.
- F. Chollet et al. , Keras github, 2015, available at: https://github.com/fchollet/keras Search PubMed.
- Z. Zhao, Z. Chen, X. Zhang and G. Lu, Generalized surface coordination number as a descriptor for CO2 reduction on Cu surfaces, J. Phys. Chem. C, 2016, 120, 28125–28130 CrossRef CAS.
- Y. Nanba and M. Kyoama, An element-based generalized coordination number for predicting the oxygen binding energy on Pt3M (M = Co, Ni or Cu) alloy nanoparticles, ACS Omega, 2021, 3218–3226 CrossRef CAS PubMed.
- M. Doering, H.-P. Rust, B. G. Briner and A. M. Bradshaw, Imaging benzene on Nickel and Copper {110} surfaces with low temperature STM: The adsorption site, Surf. Sci., 1998, 410, L736–L740 CrossRef CAS.
- V. Caciuc, H. Hölscher, D. Weiner, H. Fusch and A. Schirmeisen, Noncontact atomic force microscopy imaging mechanism on Ag(110): Experiment and first-principle theory, Phys. Rev. B: Condens. Matter Mater. Phys., 2008, 77, 045411 CrossRef.
- G. Doyen, D. Drakova, J. V. Barth, R. Schuster, T. Gritsch, R. J. Behm and G. Ertl, Scanning-tunnelling-microscope imaging of a clean and alkali-covered Cu(110) and Au(110) surfaces, Phys. Rev. B: Condens. Matter Mater. Phys., 1993, 48(3), 1738–1749 CrossRef CAS PubMed.
- M. L. Viana, D. D. dos Reis, E. A. Soares, M. A. Van Hove, W. Moritz and V. E. de Carvalho, Novel genetic algorithm search procedure for LEED surface structure determination, J. Phys.: Condens. Matter, 2014, 26, 225005 CrossRef CAS PubMed.
- H. Ness and F. Gautier, The electronic structure of transition metal interacting tip and sample and atomic force microscopy – part II, J. Phys.: Condens. Matter, 1995, 7, 6641–6661 CrossRef CAS.
- SciPy, v. 1.8.1, 05/2022, available online at: https://scipy.org/ Search PubMed.
- J. M. Rahm and P. Erhart, Wulffpack: A python package for Wullf construction, J. Open Source Software, 2020, 5, 1944 CrossRef.
- A. R. Poerwoprajitno, L. Gloag, S. Cheong, J. J. Gooding and R. D. Tilley, Synthesis of low- and high-index faceted metals (Pd, Pt, Ru, Ir, Rh) nanoparticles for improved activity and stability in electrocatalysis, Nanoscale, 2019, 11, 18995 RSC.
- P. Li, J. Liu, N. Nag and P. A. Crozier, Atomic-scale study of in-situ metal nanoparticles synthesis in a Ni/TiO2 system, J. Phys. Chem. B, 2005, 109, 13883–13890 CrossRef CAS PubMed.
- E. S. Menkah, N. Y. Dzade, R. Tia, E. Adei and N. H. de Leeuw, Hydrazine adsorption on perfect and defective fcc Nickel (100), (110) and (111) surfaces: A dispersion corrected DFT-D2 study, Appl. Surf. Sci., 2019, 480, 1014–1024 CrossRef CAS.
- A. Mohsenzadeh, K. Bolton and T. Richards, DFT study of the adsorption and dissociation of water on Ni(111), Ni(100) and Ni(110) surfaces, Surf. Sci., 2014, 627, 1–10 CrossRef CAS.
- H. Iddir, V. Komanicky, S. Ogut, H. You and P. Zapol, Shape of Platinum nanoparticles supported on SrTiO3: Experiment and theory, J. Phys. Chem. C, 2007, 111, 14782–14789 CrossRef CAS.
- M. Duan, J. Yu, J. Meng, B. Zhu, Y. Wang and Y. Gao, Reconstruction of supported metal nanoparticles in reaction condition, Angew. Chem., Int. Ed., 2018, 130, 6574–6579 CrossRef.
- B. Zhu, J. Meng, W. Yuan, X. Zhang, H. Yang, Y. Wang and Y. Gao, Reshaping of metal nanoparticles under reaction condition, Angew. Chem., Int. Ed., 2020, 59, 2171–2180 CrossRef CAS PubMed.
- C. A. Johnson and G. D. Chakerian, On the proof of the uniqueness of Wulff's construction of the shape of minimum surface free energy, J. Math. Phys., 1965, 6, 9 CrossRef.
- G. Wulff, Zur Frage der Geschwindigkeit des Wachstums und der Auflösung der Krystallflagen, Z. Kristallogr. – Cryst. Mater., 1901, 34, 459–530 Search PubMed.
- W. Zhang, L. Xiao, Y. Hirata, T. Pawluck and L. Wang, The simple cubic structure of Ir clusters and the element effect on cluster structure, Chem. Phys. Lett., 2004, 383, 67–71 CrossRef CAS.
- E. Fernàndez and M. Boronat, Sub nanometer clusters in catalysis, J. Phys.: Condens. Matter, 2019, 31, 013002 CrossRef.
- P. L. Rodrìgez-Kessler, A. R. Rodrìguez-Domìnguez, P. Alonso-Dàvila, P. Navarro-Santos and A. Muñoz-Casto, Structural and electronic properties for Be-doped Ptn (n = 1-12) clusters obtained by DFT calculations, Phys. Chem. Chem. Phys., 2022, 24, 7856 RSC.
Footnote |
| † Electronic supplementary information (ESI) available. See DOI: https://doi.org/10.1039/d2cp04024g |
| This journal is © the Owner Societies 2023 |

