 Open Access Article
Thermoelectric properties and lattice dynamics of tetragonal topological semimetal Ba3Si4
Romain
Viennois
 *a,
Michael Marek
Koza
b,
Adrien
Moll
 ac and
Mickael
Beaudhuin
 a
a
aICGM, Univ Montpellier, CNRS, ENSCM, Montpellier, France. E-mail: romain.viennois@umontpellier.fr
bInstitut Laue Langevin, 71 avenue des Martyrs, F-38042 Grenoble, France
cICMMO, CNRS, UMR 8182, Université Paris Saclay, F-91405 Orsay, France
First published on 6th December 2022
Abstract
We report the lattice dynamics and thermoelectric properties of topological semimetal Ba3Si4. The lattice dynamics has been studied by Raman and inelastic neutron scattering experiments. Good agreement has been found with first-principles calculations. The presence of low-energy optical modes at about 7 meV mainly due to the heavy mass of the Ba atoms suggests a propensity to low thermal conductivity, which is favorable for thermoelectric applications. Our density functional theory calculations indicate that the semimetallic nature of Ba3Si4 is the origin for the rather large thermopower. Ba3Si4 shows high potential for a thermoelectric material with a Seebeck coefficient as large as −120 μV K−1 for 0.2 electrons/formula units through the substitution of Ba by appropriate cations, such as Y.
Introduction
Thermoelectricity is one of the material properties harvested for renewable energy production over recent years. The potential of a material for thermoelectric (TE) applications can be determined through the dimensionless figure of merit ZT = α2σT/κ where α is the Seebeck coefficient, σ is the electrical conductivity, T is the absolute temperature and κ is the thermal conductivity.1Doped semiconductors and semimetals meet the electronic prerequisite for optimum power factors PF = α2σ. The best standard thermoelectric materials are alloys based on Bi2Te3, PbTe or Si1−xGex with a ZT of about 1. There are as well promising antimonides and chalcogenides which have been found during the last few decades.1–3 However, most of these materials are made of toxic and rare chemical elements, hence the intense search for new TE compounds is based on abundant and nontoxic elements.Alkaline-earth silicides form a class of promising TE materials which have been studied for their large variety of crystal structures and electronic ground states. Several types of semiconductors such as orthorhombic BaSi2, A2Si (A = Ca, Sr, Ba), Ca3Si4 and Ca14Si19 have attracted attention for photovoltaic and thermoelectric applications.4–9 Type I clathrates A8Si46 (A = Ba, Sr) and type IX clathrates are cage compounds that can be synthesized at high-pressure and high temperature with superconducting ground states and interesting dynamic properties of the guest atom A.10 When Si atoms are substituted by Ga or Al atoms, the thermoelectric properties increase strongly with a ZT reaching 0.87 at 870 K for BaGa16Si30.11,12
Recently, first-principles calculations have shown that Ba3Si413 and cubic SrSi214 as well as cubic CoSi15 are topological semimetals with many potential applications such as in the thermoelectric field. This was indeed confirmed for SrSi2 with the best ZT obtained at room temperature among the silicide alloys.16 In particular, in the absence of spin–orbit coupling (SOC), there are three types of topological elements in Ba3Si4 generated by the crossings of three bands: a nodal-chain network, intersecting nodal rings and triple points linked by a nodal line.13 In the presence of SOC, the intersecting nodal rings are gapped and the triple points split into two Dirac points because of band splitting with one of the crossing points gapped.13 As these splitting energies are small, it has been suggested that these topological features can be observed experimentally.13 In more recent DFT studies of topological materials, Zhang et al. found that Ba3Si4 belongs to the general class of high symmetry point semimetals when the spin–orbit coupling is not taken into account. The topological points are split during SOC.17,18 Tang et al. also predicted some band crossing in the semimetal Ba3Si419 whereas Vergniory et al. found that Ba3Si4 has an integer linear combination of elementary band representations that could be compatible with either fragile or trivial topology but without a fragile band in this case.20–23
Ba3Si4 crystallizes in the tetragonal space group P42/mnm (no. 136). It has a complex crystal structure with the inclusion of quasi-isolated butterfly-shaped Si46− Zintl anions. They are formed by two three-fold bonded Si(1) atoms, two two-fold bonded Si(2) atoms and heavy Ba atoms24–26 (see the crystal structure in Fig. 1). This structural complexity makes it a good candidate for a low thermal conductivity material. Ba3Si4 can be seen as a Zintl compound such as (Ba2+)3Si46−, but as indicated above, it is semimetallic and not semiconducting. Hydrogenation of Ba3Si4 could transform these butterfly Si46− anions into tetrahedron-shaped Si44− polyanions with hydrogen atoms in interstitial sites.27 To date, the physical properties of Ba3Si4 have been hardly studied.26 In the present work, we report the electronic and thermoelectric properties of Ba3Si4 computed using density functional theory (DFT) and Boltzmann transport theory, and its lattice dynamics studied via inelastic neutron scattering (INS) experiments and DFT methods, which we refer to as DFT-LD hereafter.
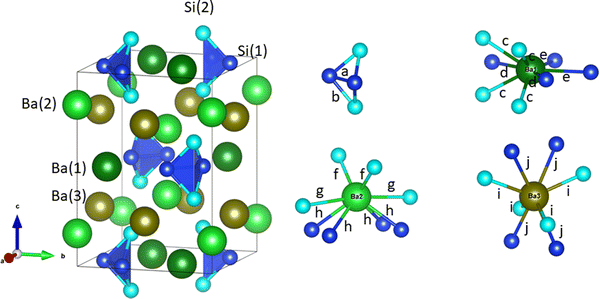 | ||
| Fig. 1 Left: the crystal structure of tetragonal Ba3Si4 from the experimental data of ref. 26. Small and large spheres represent Si and Ba atoms, respectively. Different Wyckoff positions are labeled and disclosed by different colors; light blue and dark blue for Si and Si–Si bonds, respectively, and varying green colors for Ba sites.28 Right: the four different local structural motifs forming the Ba3Si4 compound. The same color scheme is applied. Interatomic distances are labeled a–j and correspond to a = 2.4183 Å, b = 2.4254 Å, c = 3.5761 Å, d = 3.7061 Å, e = 3.7163 Å, f = 3.2584 Å, g = 3.6177 Å, h = 3.3598 Å, i = 3.3088 Å and j = 3.5174 Å. | ||
Computation and experimental details
DFT calculations were based on projector augmented wave (PAW) pseudopotentials and the Perdew-Burke-Ernzerhof (PBE) exchange–correlation functional using the Vienna ab initio Simulation Package (VASP).29–31 For all calculations, an energy cut-off of 350 eV was applied. The force convergence was 10−3 eV Å−1 with an energy convergence of 10−10 eV. We applied a grid of 11 × 11 × 11 k points for this calculation. The calculated tetragonal lattice parameters are a = 8.5829 Å and c = 11.9549 Å and slightly larger than the experimental values a = 8.5233 Å and c = 11.8322 Å.26 The calculated atom fractional coordinates listed in Table 1 agree very well with the experimental data.26| Atom | Site | x | y | z | U iso (Å2) | |
|---|---|---|---|---|---|---|
| Ba(1) | 4f | 0.33598 | x | 0 | 0.01639 | DFT |
| 0.33515 | x | 0 | 0.01466 | XRD26 | ||
| Ba(2) | 4e | 0 | 0 | 0.16922 | 0.01137 | DFT |
| 0 | 0 | 0.16963 | 0.01031 | XRD26 | ||
| Ba(3) | 4d | 0 | ½ | ¼ | 0.01355 | DFT |
| 0 | ½ | ¼ | 0.01212 | XRD26 | ||
| Si(1) | 8i | 0.8996 | 0.30034 | 0 | 0.01282 | DFT |
| 0.90055 | 0.30007 | 0 | 0.01134 | XRD26 | ||
| Si(2) | 8j | 0.19924 | x | 0.35597 | 0.01547 | DFT |
| 0.20077 | x | 0.35403 | 0.01359 | XRD26 |
The electronic density of states and the thermoelectric properties were calculated using a grid with 25 × 25 × 25 k-points. The electron localization function (ELF) was calculated following the description by Becke and Edgecombe.32 The thermoelectric properties were calculated with the BoltzTrap program in the constant relaxation time τ approximation within a rigid band model.33 For the lattice dynamics calculations, we used the supercell method implemented in the PHONON program.34 The calculations were performed in a 2 × 2 × 2 supercell with a grid of 5 × 5 × 5 k points.
The formation enthalpies Hform of pure and doped Ba3Si4 were calculated as the difference between the ground state energy E of the compounds Ba12Si16, Ba11YSi16 and Ba12Si15Al, obtained by DFT calculations, and of the ground states of the monatomic Ba, Y, Si, and Al crystals.
 | (1) |
 | (2) |
 | (3) |
 | (4) |
The Ba3Si4 samples were synthesized using an arc melting furnace from Ba (98.5%) and Si (99.999%) pieces in stoichiometric amounts under an Ar atmosphere. Powders were analyzed using X-ray diffraction (Philips X’PERT, Cu-Kα radiation using an accelerated detector PW 3050/60 at 45 kV, 30 mA settings). When ground to powder, the sample is sensitive to moisture, so the powders were prepared using an Ar glovebox and embedded in vacuum grease. The XRD pattern was simulated using Powdercell35 and the comparison with the experimental data show that almost all Bragg peaks can be assigned to Ba3Si4. Three small peaks are identified to be due to BaSi36 (see Fig. 2).
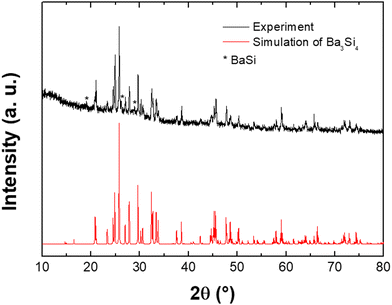 | ||
| Fig. 2 X-ray diffraction pattern of the Ba3Si4 sample (top) compared to a simulation (bottom). The asterisks indicate the Bragg peaks of the BaSi compound. | ||
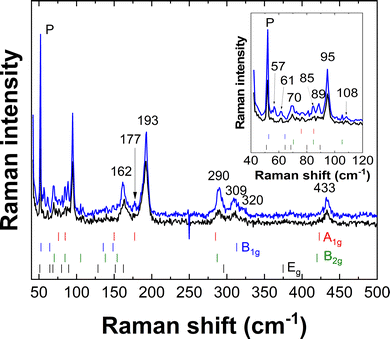
Raman scattering experiments have been performed using a T64000 spectrometer from Horiba–Jobin Yvon in backscattering geometry and a triple-monochromator configuration using a 488 nm laser. The triple-monochromator configuration enabled us to study all low-energy Raman modes of Ba3Si4. The error in Raman frequencies is about 2 cm−1. The Raman experiments were performed on small single-crystal pieces, which are much less sensitive to moisture than powder.
Inelastic neutron scattering (INS) experiments were performed using time-of-flight spectrometers IN5 and IN4 at the Institut Laue Langevin in Grenoble, France. Neutron incident wavelengths of 5 Å at IN5 and 1.1 and 1.6 Å at IN4 were applied. After the synthesis, the sample was stored in a glove box under an Ar atmosphere prior to the INS experiments. All INS measurements were carried out in standard cryostats with the sample under a helium atmosphere of 10–20 bars at T = 300 K. Standard corrections were applied to the data comprising empty container signal, instrument and frame overlap backgrounds, detector efficiencies and their energy dependence. From the corrected INS spectra, the generalized density of states (GDOS) Gexp(ω,T) was computed within the incoherent approximation.37,38
Electronic and thermoelectric properties
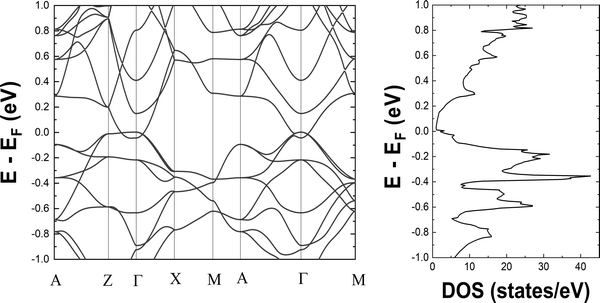
We begin to discuss our results with the electronic structure and thermoelectric properties of Ba3Si4. We report the electronic band structure and density of states around the Fermi level in Fig. 3. The overlap of the valence and conduction bands around Γ and the low value of the electronic density of states at the Fermi level are the characteristics of a semimetallic material and in good agreement with prior calculations.13,18,23,26,27 Notably, we observe the crossing of the valence and conduction bands close to the Fermi level well corresponding to the different topological features described and analyzed in detail by Cai et al.14 The two peaks in the electronic DOS close to the Fermi level are noted. They correspond to the bottom of the conduction band at −0.045 eV and the top of the valence band at 0.005 eV and signify the overlap between these two bands of 0.05 eV. In Fig. 4, we report the 3D representation of the ELF for ELF = 0.8 and the 2D cross-section through the [001] plane. One can clearly see that the Ba atoms have spherical ELF characteristics of ionic bonding. We also clearly see the attractors of the lone pairs of different Si atoms. When decreasing the ELF to 0.76, the attractors between the different Si atoms appear, indicating that the electrons in covalent Si–Si bonding are much less localized than the electrons in the lone pairs. All these characteristics are typical of Zintl compounds,39 although here Ba3Si4 is semimetallic due to the overlap of the highest valence and lowest conduction bands around Γ.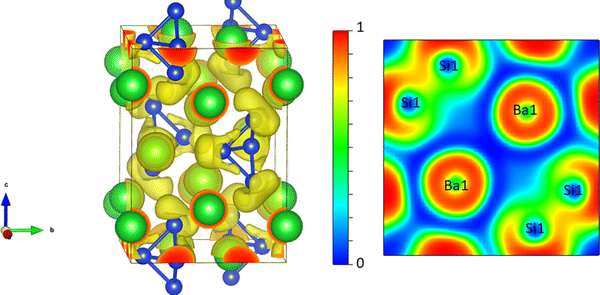 | ||
| Fig. 4 Left: 3D representation of the ELF isosurface with ELF = 0.8. Right: 2D cross section through the [0 0 1] plane of the ELF. | ||
This semimetallic nature with a low charge carrier concentration suggests the potential for TE applications as in the case of semimetallic CoSi showing good TE properties.40–42 As seen in the Introduction, both CoSi15 and Ba3Si413 are topological semimetals although of different nature. It has already been shown43 that the topology anomalies can give additional contributions to the TE power of the topological metal or semimetal.
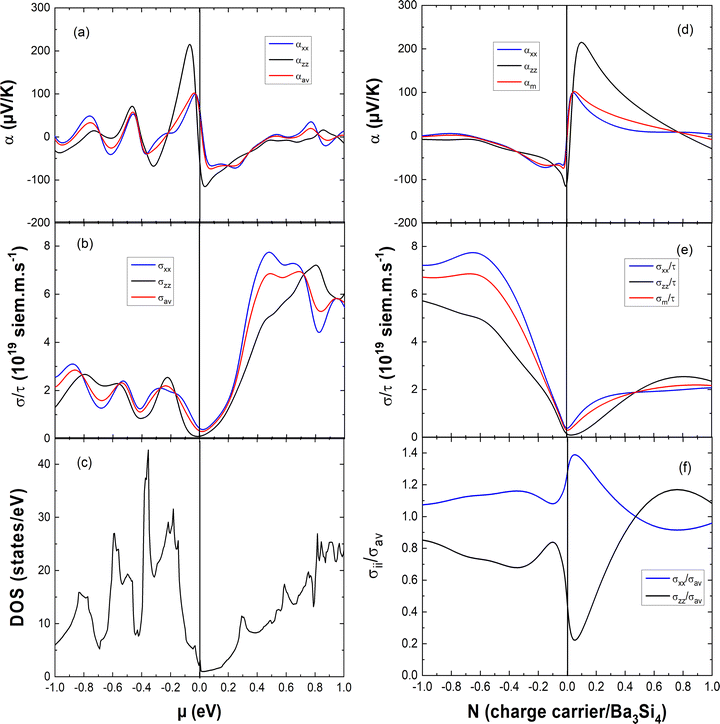
In Fig. 5, we report the anisotropy of the electrical conductivity and that of the Seebeck coefficient perpendicular and parallel to the c axis and the average Seebeck coefficient which is computed as αav = (2σxxα + σzzαzz)/3σav (with σav = (2σxx + σzz)/3). In Fig. 5(a)–(c), they are reported as a function of the chemical potential μ and compared with the variation of the electronic DOS. One can see that close to μ = 0 eV, the absolute value of the Seebeck coefficient is larger for the valence band than for the conduction band and this is the opposite concerning the electrical conductivity. For better insight into the variation of the thermoelectric properties with doping, we report the Seebeck coefficient and the electrical conductivity as a function of the charge carrier concentration N in Fig. 5(d)–(f). The positive N value corresponds to hole doping whereas the negative N value marks electron doping. The anisotropy of the Seebeck coefficient varies with the charge carrier concentration. For electron doping with −0.1 < N < 0 e per fu and for hole doping with 0.05 < N < 0.7 h per fu, the absolute value of the Seebeck coefficient is significantly larger in the c direction. The electrical conductivity is always larger in the ab plane than that in the c direction for electron doping −1 < N < 0 e per fu and for hole doping with 0 < N < 0.45 h per fu. These results can be explained by the much larger dispersion of the conduction and valence bands in the ΓX and ΓM directions than those in the ΓZ direction, resulting in a much smaller effective mass m* and larger delocalization of the charge carriers in the ab plane than those in the c direction. Thus, this explains naturally the anisotropy of the electrical conductivity and the Seebeck coefficient as in a first approximation σ ∝ 1/m* and α ∝ m*.
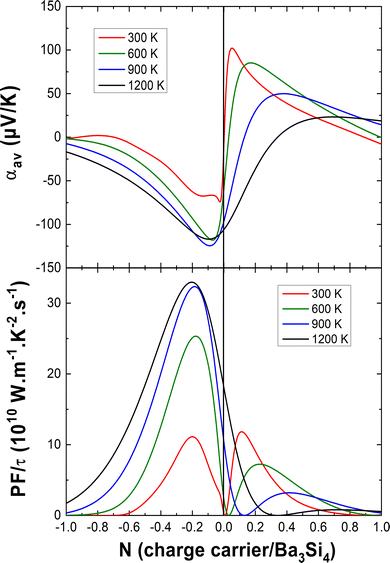
In Fig. 6, we report the average Seebeck coefficient αav and the power factor PF = αav2σav/τ as a function of the charge carrier concentration at different temperatures. For electron doping, one can see that the absolute value of the Seebeck coefficient has a maximum for N = −0.1 e per fu, increases from 300 K to 600 K and becomes almost temperature independent upon further heating. The best absolute values of the Seebeck coefficients in the case of electron doping are comparable with those of CoSi which has a ZT of about 0.15–0.2 above 600 K40–42 or of the bad metal LaFe4Sb1244 with ZT as large as 0.7 at 800 K.45
For hole doping, one can see that the maximum of the Seebeck coefficient shifts to higher charge carrier concentrations and lower values with increasing temperature. At 300 K, a similar maximum power factor is found for both electron doping and hole doping for about N = −0.2 e per fu and N = 0.1 h per fu, respectively. However, for hole doping, at a higher temperature, the power factor decreases marking hole doping an inept approach for good TE performance. In the case of electron doping, the power factor increases upon heating by a factor 3 and becomes almost constant above 900 K, still for N = −0.2 e per fu. This is a very promising result for TE applications. A possibly viable way of accomplishing the doping requirements for the best TE performance of Ba3Si4 could be the substitution of Ba by Y for electron doping (optimum electron doping for Ba2.8Y0.2Si4) and by Al for hole doping (optimum hole doping for Ba3Si3.9Al0.1). So far, it has not been clarified what maximum doping values the solubilities of Y and Al allow to reach. An accurate study of the Ba–Y–Si and Ba–Al–Si phase diagrams is needed. Note that the high sensitivity of Ba3Si4 to air and moisture will need specific care to characterize its thermoelectric properties.
Here, we have calculated the formation enthalpies Hform of pure and Al- and Y- doped Ba3Si4 as well as the insertion energies Ein of Al and Y in Ba3Si4 in order to determine if these elements are soluble in Ba3Si4 and on which sites the substitutions take place. The results are shown in Table 2.
| Compositions | Substitution site | a (Å) | c (Å) | V at (Å3) | H form (eV/atom) | E in (eV) |
|---|---|---|---|---|---|---|
| Ba3Si4 | 8.5829 | 11.9549 | 31.45 | −0.407 | ||
| Ba11YSi16 | Ba1 | 8.4711 | 11.9557 | 30.64 | −0.375 | 0.89 |
| Ba11YSi16 | Ba2 | 8.544 | 11.564 | 30.15 | −0.41 | −0.1 |
| Ba11YSi16 | Ba3 | 8.5043 | 11.6874 | 30.19 | −0.397 | 0.28 |
| Ba12Si15Al | Si1 | 8.5645 | 12.0375 | 31.53 | −0.392 | 0.41 |
| Ba12Si15Al | Si2 | 8.6828 | 11.8232 | 31.76 | −0.394 | 0.36 |
Y-doping should decrease significantly the lattice volume and modify very differently the lattice parameters depending on which the Ba site is substituted. Y insertion in Ba2 sites decreases the formation enthalpy Hform and leads to a negative insertion energy Ein. We conclude that Y should be soluble in Ba3Si4 and substitute preferentially on the Ba2 sites. Note that the insertion in Ba3 and Ba2 sites is progressively less favorable. In comparison, Al substitution is energetically less favorable and increases slightly the lattice volume. The low values of insertion energies Ein suggest however the possibility of substitution at high temperatures when configurational entropic and vibrational contributions play a stronger role.
Lattice dynamics and thermodynamic properties
In Ba3Si4, there are 28 atoms in the primitive cell and thus 84 different vibrational modes. The decomposition in irreducible representation is as follows:| Γopt = 6 A1g ⊕ 4 A2g ⊕ 5 B1g ⊕ 7 B2g ⊕ 10 Eg ⊕ 3 A1u ⊕ 5 A2u ⊕ 5 B1u ⊕ 2 B2u ⊕ 12 Eu and Γac = A2u ⊕ Eu |
There are 28 Raman-active modes with A1g, B1g, B2g and Eg symmetries and 17 Infrared-active excitations of A2u and Eu symmetries.
All DFT-computed Gamma point frequencies and their symmetries are reported in Table 3. A comparison of the calculated Raman modes with two experimental Raman spectra is shown in Fig. 7 and enables some mode symmetry assignments. The results of the assignment are detailed in Table 4. Note that in many cases several modes correspond to the Raman lines observed in our experiments.
| Symmetry | Frequency (cm−1) |
|---|---|
| A 1g | 76, 84.9, 150, 177.3, 284.9, 423 |
| A 2g | 65.5, 141.8, 154.5, 312.8 |
| B 1g | 52.7, 64.3, 135.6, 148.5, 313.1 |
| B 2g | 70.4, 84.7, 105.3, 138.3, 154, 287.1, 420 |
| E g | 51.1, 64.5, 68.6, 80, 89.5, 128.5, 151.6, 162.4, 295.8, 374.9 |
| A 1u | 71.8, 163, 306.1 |
| A 2u | 77.8, 79.5, 131.9, 155.3, 373.6 |
| B 1u | 53.4, 90.9, 145.1, 155, 377.4 |
| B 2u | 162.4, 306.9 |
| E u | 54.7, 68.7, 70.7, 71.5, 95, 129.9, 134, 152.5, 168.9, 292.5, 306.9, 425.4 |
| Frequency/cm−1 | Symmetry (DFT) |
|---|---|
| 57 | E g (51.1) |
| 61 | B 1g (52.7) |
| 70 | ? |
| 85 | E g (80) |
| 89 | B 2g (84.7) + A1g (84.9) |
| 95 | E g (89.5) |
| 108 | B 2g (105.3) |
| 162 | B 1g (148.5) + A1g (150) + Eg (11.6) + B2g (154) |
| 177 | E g (162.4) |
| 193 | A 1g (177.3) |
| 290 | A 1g (284.9) + B2g (287.1) |
| 309 | E g (295.8) |
| 320 | B 1g (313.1) |
| 433 | B 2g (420) + A1g (423) |
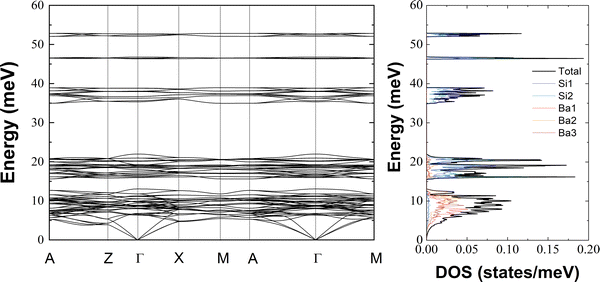
We report in Fig. 8 the phonon dispersion curves and the total and atom-projected phonon DOS of Ba3Si4 obtained from DFT-based lattice dynamics calculations. The phonon properties of Ba3Si4 show some very particular features which are worth highlighting. A dispersive character of the phonon system, which one might think of being the characteristic of acoustic phonons, is only obvious below 5 meV, despite the highest energy excitations reach almost 55 meV. Consequently, above 5 meV, all vibrational eigen-modes are highly localized. The strongly localized phonons form five clearly and extensively separated phonon bands. The lowest energy band ranges up to about 12.5 meV and cannot be discriminated from the acoustic regime. The second excitation band covers a wide energy range from 14 to 22 meV. It is followed by an extended excitation gap up to 35 meV where a narrower excitation band begins reaching out to 39 meV. The remaining localized eigen-modes form two almost singular lines in the phonon DOS centered at about 47 and 52.5 meV and are once more separated by large excitation gaps of 7 and 5 meV, respectively.
In addition to this striking localization and extensive gap characteristics of the phonon system, the vibrational amplitudes of the Ba and Si atoms are highly decoupled. This is best viewed in the atom-projected DOS on the right-hand side of Fig. 8. Note that the excitation band of the lowest energy (<12.5 meV) is basically dominated by the Ba vibrations deep into the acoustic regime. From the second excitation band, the vibrations are dominated by the Si amplitudes with no noticeable Ba contribution to the 3 high-energy phonon bands. There is as well a clear difference in the partial contributions from the 3 non-equivalent Ba sites, with Ba(1) eigen-vectors showing a preference for lower energies than Ba(2) and Ba(3). The preferences can be quantified by the mean energy 〈E〉 of the partial contributions resulting to 8.27 meV for Ba(1), 9.54 meV for Ba(3) and 10.67 meV for Ba(2). The sequence of increasing mean energies of Ba(1), Ba(3) and Ba(2) suggests this order for their bonding strength which correlates well with reciprocal mean distances of 3.6425 Å for Ba(1)–Si, 3.413 Å for Ba(3)–Si and 3.399 Å for Ba(2)–Si.26 See Fig. 1 for more details on the local structures. As we will show hereafter, the validity of the differences in the Ba-projected DOS is confirmed by diffraction results and can be further discriminated by the lattice direction. This holds equally for the properties of the two non-equivalent Si atoms. Although a difference is not clearly evident in the DOS presentation of Fig. 8, it is noticeable in the mean energy values of 29.19 meV for Si(1) and 26.15 meV for Si(2).
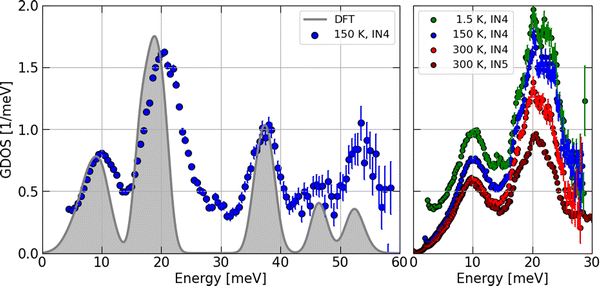
However, before discussing the effect of the partial contributions in more detail, let us establish the validity of the particular DOS features by a comparison with the INS experimental data. The contrast maps of the dynamic structure factor S(Q,E) measured at IN4 with an incident neutron wavelength of 1.6 Å at 1.5, 150 and 300 K are shown in Fig. 9. In Fig. 10, we compile the computed generalized densities of states (GDOS) from all IN4 and IN5 data as well as the neutron weighted DOS derived from DFT-based lattice dynamics and broadened for the spectrometer energy resolution.
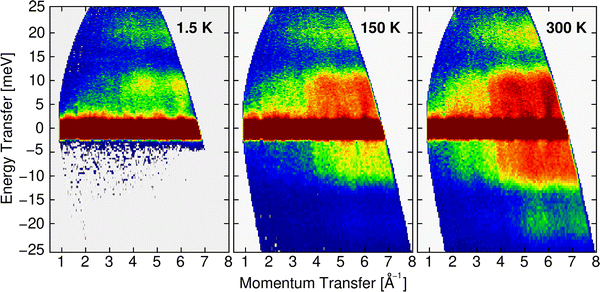 | ||
| Fig. 9 Contrast maps of S(Q,E) recorded at IN4 with λ = 1.6 Å at the indicated temperatures. The positive and negative energies characterize the Stokes and anti-Stokes lines, respectively. | ||
From the powder-averaged signal of the dynamic structure factor S(Q,E) shown in Fig. 9, the dispersive character of the monitored vibrational modes is clearly obvious for intensities up to the mode gap centered around 15 meV. The bands of acoustic phonons emanating from strong Bragg reflections at zero energy along E up to about 10 meV and high-intensity regions localized in Q highlight the collective character of the sampled excitations. Excitations above the mode gap show a reduced variation upon Q and E as deduced before from the computed phonon dispersion shown in Fig. 8. The increasing intensity towards high Q and with mounting temperatures reflects the basic dependence of phonon form-factors on Q and thermal occupation, respectively.
The temperature corrected and phase space averaged GDOS signals shown in Fig. 10 are in very good agreement with the DFT-LD results. Note that, for convenience, the resolution-broadened DOS has been normalized to 21 phonon modes and the GDOS recorded at 150 K was compared with the DOS for peak amplitudes in the low-E region. We highlight that within the resolution of the experimental setup, all measured phonon peaks are reproduced and the characteristic energies matched with high precision by the computed DOS. This is in particular the case for the Si-dominated high-E modes. In the Ba-dominated low-E region, the two strong peaks are somehow sharper and shifted to lower energies by about 10% in the DOS. This indicates that the Ba–Si coupling is slightly underestimated by the DFT calculations. A similar effect has been found for Ba–Si clathrates46 and a stronger underestimation of the Ba–Ge coupling has been found in Ba–Ge clathrates47,48 having applied PBE exchange–correlation functionals.
We may locate these Ba-dominated low-E peaks at 10 and 20 meV in the GDOS data. This result is temperature independent as evidenced by the higher resolution data shown on the right of Fig. 10. The progressive reduction of the intensity in the IN4 data upon heating is a result of the Debye–Waller factor. The difference in the amplitudes of the two peaks recorded at 300 K in the IN5 data with respect to the IN4 signal is a result of the different phase spaces covered by the two instruments and experimental setups.
To highlight the significance of the differences in the atom-projected DOS as shown in Fig. 8, we compare in Fig. 11 the isotropic thermal displacement parameters Uiso(T) derived from our DFT-LD data with experimental results taken at room temperature by Aydemir et al.26 The excellent correspondence of the DFT-LD and experimental results is noted. As expected and pointed out above, the weak underestimation of the Ba–Si coupling in the low-energy region of the DOS is demonstrated here by a slight shift of the DFT-LD data towards higher values. The subtle differences of the Si(1) and Si(2) specific dynamics which are less clear in Fig. 8 become obvious here and follow compellingly the experimental data as the three Ba-specific Uiso(T) do. Thus, the two-fold bonded Si(2) experiences higher displacement parameters than the three-fold bonded Si(1) in line with their specific mean energies <E> reported above.
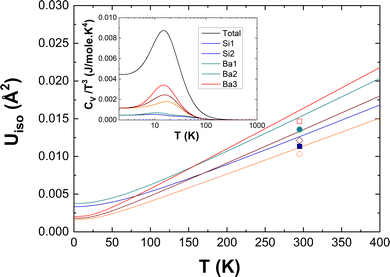 | ||
| Fig. 11 Isotropic atomic displacement parameters Uiso from DFT calculations (solid lines) compared to experimental values26 (symbols). Inset: Debye plot CV/T3 as a function of temperature. | ||
The excellent agreement between experiment and calculations can be further tracked down to the level of anisotropic displacement parameters Uij. They are listed in Table 5. Note that the sequence of Uij values derived from experiment is fully respected by our computation data for diagonal and off-diagonal elements. Our data affirm the weak anisotropies in Uij of all atoms conjectured from experiments. They confirm as well the variation in the bond strength of the Ba atoms. In contrast to Ba(1) and Ba(3) which experience a stronger bonds along the z direction than in the x–y plane, Ba(2) is stronger bonded in the x–y plane than along the z direction.
| Atom | Site | U xx (Å2) | U yy (Å2) | U zz (Å2) | U yz = Uxz (Å2) | U xy (Å2) | |
|---|---|---|---|---|---|---|---|
| Ba(1) | 4f | 0.01511 | U xx | 0.01894 | 0.00002 | −0.00035 | DFT |
| 0.01296 | U xx | 0.01805 | 0 | −0.00047 | XRD26 | ||
| Ba(2) | 4e | 0.01221 | U xx | 0.00969 | 0.00002 | 0.00058 | DFT |
| 0.01111 | U xx | 0.00871 | 0 | 0.00067 | XRD26 | ||
| Ba(3) | 4d | 0.01306 | U xx | 0.01453 | 0.00002 | 0.00000 | DFT |
| 0.01186 | U xx | 0.01264 | 0 | 0 | XRD26 | ||
| Si(1) | 8i | 0.01148 | 0.01448 | 0.01251 | 0.00004 | −0.00122 | DFT |
| 0.01005 | 0.01263 | 0.01135 | 0 | −0.00111 | XRD26 | ||
| Si(2) | 8j | 0.01515 | U xx | 0.0161 | −0.0038 | 0.00102 | DFT |
| 0.01303 | U xx | 0.01472 | −0.00326 | 0.00064 | XRD26 |
Finally, the corresponding heat capacity data in a Debye plot (CV/T3vs. T) are reported in the inset of Fig. 11. As expected from the observed peak around 10 meV in the DOS and GDOS, CV/T3 features a peak at about 15 K on the top of a Debye plateau. The atom-specific characteristics are obvious here by two features. There is a clear variation of intensities and a less evident variation of the peaks’ positions. Their behavior is comprehensible on a qualitative basis within the basic models of Einstein and Debye taking into account some characteristic energies such as the mean energies 〈E〉 calculated above. At low T, the atom-specific peak positions scale with 〈E〉 and the peak intensities are expected to follow ∼exp(−〈E〉/kBT) within the Einstein model. An equivalent explanation is offered by the Debye model for the intensities of the Debye plateau. They are supposed to scale as 1/〈E〉3 at low T. Thus, the differences in CV/T3 of the three symmetry-non-equivalent Ba atoms and the rather Debye-like CV/T3 of the Si atoms are anticipated.
Conclusion
In the present paper, we have investigated the electronic, thermoelectric, and phonon properties of the topological semimetal Ba3Si4. The bonding properties of Ba3Si4 are the characteristic of Zintl phases despite the semimetallic nature of the compound. This semimetallic nature results in a rather high Seebeck coefficient which is a prerequisite for good thermoelectric properties as found in some other silicides with similar characteristics. We believe that Y doping on Ba sites could make Ba3Si4 a potential thermoelectric material, if high enough doping concentrations could be achieved.The lattice dynamics of the material has been studied by Raman and inelastic neutron scattering experiments as well as ab initio lattice dynamics calculations. Good agreement of the experimental data with the ab initio results is observed. The presence of low-energy optical modes with dominating Ba participation is another prerequisite for the good thermoelectric performance of the material. In this case, the localization of vibrational modes in the energy domain of heat carrying acoustic phonons is supposed to open up an appreciable number of additional scattering channels for the heat carriers and thus reduce the lattice thermal conductivity. The high number of 84 eigen-modes out of which 81 are localized is a result of the complex structure of Ba3Si4 and points at an enhanced phase–space volume for Umklapp-scattering processes.
The very good agreement of the lattice dynamics calculations with the experimental results up to the level of anisotropic thermal displacement parameters underlines the accuracy of our ab initio computed data. This agreement strengthens our confidence in the validity of the computed electronic properties and thus in the charge carrier and temperature dependence of the electrical conductivity, the Seebeck coefficient and the power factor. It is a solid guide for the experimental work to follow.
Conflicts of interest
The authors have no conflicts of interest to declare.References
- G. J. Snyder and E. S. Toberer, Complex thermoelectric materials, Nat. Mater., 2008, 7, 105–114 CrossRef CAS PubMed.
- C. Han, Q. Sun, Z. Li and S. X. Dou, Thermoelectric enhancement of different kinds of metal chalcogenides, Adv. Energy Mater., 2016, 6, 1600498 CrossRef.
- T. Zhu, Y. Liu, C. Fu, J. P. Heremans, G. J. Snyder and X. Zhao, Compromise and synergy in high-efficiency thermoelectric materials, Adv. Mater., 2017, 29, 1605884 CrossRef PubMed.
- W. Du, M. Suzuno, M. A. Khan, K. Toh, M. Baba, K. Nakamura, K. Toko, N. Usami and T. Suemasu, Improved photoresponsivity of semiconducting BaSi2epitaxial films grown on a tunnel junction for thin-film solar cells, Appl. Phys. Lett., 2012, 100, 152114 CrossRef.
- K. Hashimoto, K. Kurosaki, Y. Imamura, H. Muta and S. Yamanaka, Thermoelectric properties of BaSi2, SrSi2, and LaSi, J. Appl. Phys., 2007, 102, 063703 CrossRef.
- S. A. Dotsenko, D. V. Fomin, K. N. Galkin, D. L. Goroshko and N. G. Galkin, Growth, optical and electrical properties of Ca2Si film grown on Si(111) and Mg2Si/Si(111) substrates, Phys. Proc, 2011, 11, 95–98 CrossRef CAS.
- C. Wen, T. Nonomura, A. Kato, Y. Kenichi, H. Udono, K. Isobe, M. Otake, Y. Kubota, T. Nakamura, Y. Hayakawa and H. Tatsuoka, Electrical properties of Ca2Si sintered compact synthesized by spark plasma sintering, Phys. Procedia, 2011, 11, 106–109 CrossRef CAS.
- S. Yabuuchi, Y. Kurosaki, A. Nishide, N. Fukutani and J. Hayakawa, First-principles study on thermoelectric transport properties of Ca3Si4, Phys. Rev. Mater., 2017, 1, 045405 CrossRef.
- A. Moll, R. Viennois, P. Hermet, A. Haidoux, J.-L. Bantignies and M. Beaudhuin, Stability and properties of the friendly environmental Zintl phases: Ca3Si4 and Ca14Si19, Acta Mater., 2017, 125, 490–497 CrossRef CAS.
- A. San Miguel and P. Toulemonde, High-pressure properties of group IV clathrates, High Press. Res., 2005, 25, 159–185 CrossRef CAS.
- V. L. Kuznetsov, L. A. Kuznetsov, A. E. Kalliazin and D. M. Rowe, Preparation and thermoelectric properties of AII8BIII16 BIV30 clathrate compounds, J. Appl. Phys., 2000, 87, 7871–7875 CrossRef CAS.
- J. H. Roudebush, E. S. Toberer, H. Hope, G. J. Snyder and S. M. Kauzlarich, Crystal structure, characterization and thermoelectric properties of the type-I clathrate Ba8-ySryAl14Si32 (0.6 ≤ y ≤ 1.3) prepared by aluminium flux, J. Solid State Chem., 2011, 184, 1176–1185 CrossRef CAS.
- J. Cai, Y. Xie, P.-Y. Chang, H.-S. Kim and Y. Chen, Nodal-chain network, intersecting nodal rings and triple points coexisting in nonsymmorphic Ba3Si4, Phys. Chem. Chem. Phys., 2018, 20, 21177–21183 RSC.
- S.-M. Huang, et al., New type of Weyl semimetal with quadratic double Weyl fermions, Proc. Nat. Acad. Sci. U. S. A., 2016, 113, 1180–1185 CrossRef CAS PubMed.
- D. A. Pshenay-Severin, Y. V. Ivanov, A. A. Burkov and A. T. Burkov, Band structure and unconventional electronic topology of CoSi, J. Phys.: Condens. Matter, 2018, 30, 135501 CrossRef CAS PubMed.
- C. S. Lue, M. D. Chou, N. Kaurav, Y. T. Chung and Y. K. Kuo, Enhancement in the thermoelectric performance by Y substitution on SrSi2, Appl. Phys. Lett., 2009, 94, 192105 CrossRef.
- T. Zhang, Y. Jiang, Z. Song, H. Huang, Y. He, Z. Fang, H. Weng and C. Fang, Catalogue of topological electronic materials, Nature, 2019, 566, 475–479 CrossRef CAS PubMed.
- https://materiae.iphy.ac.cn/#/ .
- F. Tang, H.-C. Po, A. Vishwanath and X. Wan, Comprehensive search for topological materials using symmetry indicators, Nature, 2019, 566, 486–490 CrossRef CAS PubMed.
- B. Bradlyn, L. Elcoro, J. Cano, M. G. Vergniory, Z. Wang, C. Felser, M. L. Aroyo and B. A. Bernevig, Toplogical quantum chemistry, Nature, 2017, 547, 298–305 CrossRef CAS PubMed.
- M. G. Vergniory, L. Elcoro, C. Felser, N. Regnault, B. A. Bernevig and Z. Wang, A complete catalogue of high-quality topological materials, Nature, 2019, 566, 480–485 CrossRef CAS PubMed.
- M. G. Vergniory, B. J. Wieder, L. Elcoro, S. S. P. Parkin, C. Felser, B. A. Bernevig and N. Regnault, All topological bands of all nonmagnetic stoichiometric materials, Science, 2022, 376, eabg9094 CrossRef CAS PubMed.
- https://www.topologicalquantumchemistry.com .
- B. Eisenmann, K. H. Janzon, H. Schäfer and A. Weiss, Zur kenntnis von Ba3Si4, Z. Naturforsch., B, 1969, 24, 457–458 CrossRef CAS.
- M. Pani and A. Palenzona, The phase diagram of the Ba-Si system, J. Alloys Compd., 2008, 454, L1–L2 CrossRef CAS.
- U. Aydemir, A. Ormeci, H. Borrmann, B. Böhme, F. Zürcher, B. Uslu, T. Goebel, W. Schnelle, P. Simon, W. Carillo-Cabrera, F. Haarmann, M. Baitinger, R. Nesper, H. G. von Schnering and Y. Grin, The metallic Zintl phase Ba3Si4: synthesis, crystal structure, chemical bonding, and physical properties, Z. Anorg. Allg. Chem., 2008, 634, 1651–1661 CrossRef CAS.
- V. F. Kranak, D. E. Benson, L. Wollmann, M. Mesgar, S. Shafeie, J. Grins and U. Häussermann, Hydrogenous Zintl phase Ba3Si4Hx (x = 1–2): transforming Si4 “butterfly“ anions into tetrahedral moieties, Inorg. Chem., 2015, 54, 756–764 CrossRef CAS PubMed.
- K. Momma and F. Izumi, VESTA 3 for three-dimensional visualization of crystal, volumetric and morphology data, J. Appl. Cryst., 2011, 44, 1272–1276 CrossRef CAS.
- G. Kresse and J. Furthmüller, Efficient iterative schemes for ab initio total-energy calculations using a plane-wave basis set, Phys. Rev. B: Condens. Matter Mater. Phys., 1996, 54, 11169–11186 CrossRef CAS PubMed.
- G. Kresse and D. Joubert, From ultrasoft pseudopotentials to the projector augmented-wave method, Phys. Rev. B: Condens. Matter Mater. Phys., 1999, 59, 1758–1775 CrossRef CAS.
- J. P. Perdew, K. Burke and M. Erzenhof, Generalized gradient approximation made simple, Phys. Rev. Lett., 1996, 77, 3865–3868 CrossRef CAS PubMed.
- A. D. Becke and K. E. Edgecombe, A simple measure of electron localization in atomic and molecular systems, J. Chem. Phys., 1990, 92, 5397–5403 CrossRef CAS.
- G. K. H. Madsen and D. J. Singh, BoltzTraP. A code for calculating band-structure dependent quantities, Comput. Phys. Commun., 2006, 175, 67–71 CrossRef CAS.
- K. Parlinski, Z.-Q. Li and Y. Kawazoe, First-principles determination of the soft mode in cubic ZrO2, Phys. Rev. Lett., 1997, 78, 4063–4066 CrossRef CAS.
- W. Krauss and G. Nolez, POWDERCELL – a program for the representation and manipulation of crystal structures and calculation of the resulting X-ray powder patterns, J. Appl. Cryst., 1996, 29, 301–303 CrossRef.
- A. Currao, J. Curda and R. Nesper, Kann man die arten von Zintl-anionen steuern? Variationen über das thema Si2− im system Sr/Mg/Si, Z. Anorg. Allg. Chem., 1996, 622, 85–94 CrossRef CAS.
- M. M. Bredov, B. A. Kotov, N. M. Okuneva, V. S. Oskotskii and A. L. Shakh-Budagov, Possibility of measuring thermal vibrations spectrum G(W) using coherent inelastic neutron scattering from a polycrystalline sample, Phys. Solid State, 1967, 9, 214 Search PubMed.
- V. S. Oskotskii, Measurement of phonon distribution function in polycrystalline materials using coherent scattering of slow neutrons into a solid angle, Phys. Solid State, 1967, 9, 420 Search PubMed.
- A. Sakai, F. Ishii, Y. Onose, Y. Tomioka, S. Yotsuhashi, H. Adachi, N. Nagaosa and Y. Tokura, Thermoelectric power oin transition-metal monosilicides, J. Phys. Soc. Jpn., 2007, 76, 093601 CrossRef.
- R. Viennois, X. Tao, P. Jund and J.-C. Tedenac, Stability and thermoelectric properties of transition-metal silicides, J. Electron. Mater., 2011, 40, 597–600 CrossRef CAS.
- M. Longhin, R. Viennois, D. Ravot, J.-J. Robin, B. Villeroy, J.-B. Vaney, C. Candolfi, B. Lenoir and P. Papet, J. Electron. Mater., 2015, 44, 1963–1966 CrossRef CAS.
- D. A. Pshenay-Severin, Y. V. Ivanov, A. A. Burkov and A. T. Burkov, Band structure and unconventional electronic topology of CoSi, J. Phys.: Condens. Matter, 2018, 30, 135501 CrossRef CAS PubMed.
- R. Lundgren, P. Laurell and G. A. Fiete, Thermoelectric properties of Weyl and Dirac semimetals, Phys. Rev. B: Condens. Matter Mater. Phys., 2014, 90, 165115 CrossRef.
- R. Viennois, L. Girard, D. Ravot, S. Paschen, S. Charar, A. Mauger, P. Haen and J.-C. Tedenac, Thermoelectric properties of (Ce,La)Fe4Sb12 skutterudites under a magnetic field, Phys. Rev. B: Condens. Matter Mater. Phys., 2009, 80, 155109 CrossRef.
- P. F. Qiu, J. Yang, R. H. Liu, X. Shi, X. Y. Huang, G. J. Snyder, W. Zhang and L. D. Chen, High-temperature electrical and thermal transport properties of fully filled skutterudites RFe4Sb12 (R = Ca, Sr, Ba, La, Ce, Pr, Nd, Eu, and Yb), J. Appl. Phys., 2011, 109, 063713 CrossRef.
- R. Viennois, M. M. Koza, R. Debord, P. Toulemonde, H. Mutka and S. Pailhès, Anisotropic low-energy vibrational modes as an effect of cage geometry in the binary baryum silicon clathrate Ba24Si100, Phys. Rev. B, 2020, 101, 224302 CrossRef CAS.
- M. M. Koza, M. R. Johnson, H. Mutka, M. Rotter, N. Nasir, A. Grytsiv and P. Rogl, Vibrational dynamics of the type-I clathrate Ba8ZnxGe46-x-y□ y (x = 0, 2, 4, 6, 8), Phys. Rev. B: Condens. Matter Mater. Phys., 2010, 82, 214301 CrossRef.
- R. Viennois, M. Beaudhuin and M. M. Koza, Strong renormalization of Ba vibrations in thermoelectric type-IX clathrate Ba24Ge100, Phys. Rev. B, 2022, 105, 054314 CrossRef CAS.
| This journal is © the Owner Societies 2023 |

