Mild phototherapy mediated by manganese dioxide-loaded mesoporous polydopamine enhances immunotherapy against colorectal cancer†
Caiying
Li‡
 a,
Tan
Li‡
b,
Kexin
Niu‡
a,
Zecong
Xiao
a,
Tan
Li‡
b,
Kexin
Niu‡
a,
Zecong
Xiao
 b,
Jing
Huang
b,
Ximin
Pan
b,
Jing
Huang
b,
Ximin
Pan
 a,
Yi
Sun
a,
Yongchen
Wang
a,
Decai
Ma
a,
Peiyi
Xie
*a,
Xintao
Shuai
a,
Yi
Sun
a,
Yongchen
Wang
a,
Decai
Ma
a,
Peiyi
Xie
*a,
Xintao
Shuai
 *b and
Xiaochun
Meng
 *a
*a
aDepartment of Radiology, The Sixth Affiliated Hospital, Sun Yat-sen University, Guangzhou, 510655, Guangdong, China. E-mail: mengxch3@mail.sysu.edu.cn; xiepy6@mail.sysu.edu.cn
bPCFM Lab of Ministry of Education, School of Materials Science and Engineering, Sun Yat-Sen University, Guangzhou 510275, China. E-mail: shuaixt@mail.sysu.edu.cn
First published on 7th June 2022
Abstract
One of the main challenges in applying the immune checkpoint blockade to treat colorectal cancer (CRC) is the immunosuppressive tumor microenvironment. Owing to its excellent cancer cell killing ability and immune activation, mild photothermal therapy (PTT) has shown bright promise to sensitize tumors to immune checkpoint inhibition through turning the immunologically “cold” tumors into “hot” ones. Herein, a mild photothermal effect-assisted theragnostic nanodrug (MnO2@MPDA-PEG NPs) is developed by incorporating MnO2 into PEGylated-mesoporous polydopamine nanoparticles (MPDA-PEG NPs). The presence of PEG endows the theragnostic nanodrug with high biostability. After accumulation in colorectal tumor, the theragnostic nanodrug responds to the tumor microenvironment, leading to the simultaneous release of Mn2+ which serves as a magnetic resonance imaging (MRI) contrast agent for tumor imaging. The released Mn2+ could also promote mild photothermal treatment-induced immune response, including the maturation of BMDC cells. In vivo antitumor studies on a CT26 model demonstrate that MnO2@MPDA-PEG NPs could be a promising dual-imaging theragnostic nanodrug to potentiate the systemic antitumor immunities.
Introduction
CRC is one of the most common malignant tumors. It accounts for approximately 10% of the annually diagnosed cancers and cancer-related deaths worldwide.1 In recent years, the immune checkpoint blockade (ICB) therapy has shown great potential in melanoma, non-small cell lung cancer, urothelial carcinoma etc., especially in some patients with advanced cancers.2,3 In addition, immune checkpoint inhibitors (ICI) were also applied in the clinical treatment of CRC,4 and the 2020 NCCN guidelines suggested that ICI should be considered as first-line therapy for advanced CRC with microsatellite instability-high (MSI-H) subtype.5 Unfortunately, the MSI-H subtype accounts for only 15% of CRC patients, and less than 50% of them can respond to ICI treatment.6 Studies have confirmed that insufficient tumor immunogenicity, hypoxia and lack of blood supply in the tumor microenvironment lead to the immunosuppression of CRC,7 which causes the insufficient infiltration of local effector T cells and eventually results in low immunotherapy response rate.8PTT is a promising therapy for treating superficial tumors with the help of near-infrared radiation (NIR).9 As a luminal tumor, CRC has the natural advantage for PTT because of its superficial location. The inorganic photothermal agents, including Au nanorods (AuNRs), graphene and CuS nanoparticles, and organic photothermal agents, such as IR780 and indocyanine green (ICG), have been widely used.9–11 Mesoporous polydopamine (MPDA), because of its good biocompatibility, high drug loading characteristics, strong NIR absorption capacity and high photothermal conversion rate,12 is used in many studies for drug delivery.13,14 To kill and ablate tumor cells, conventional PPT needs the local temperature of over 50 °C,15 which can damage adjacent normal tissues and increase the possibility of cancer metastasis.16 Recently, mild-PTT with a lower temperature (∼45 °C) was carried out in many studies as a method to stimulate immunological responses,17 instead of killing tumor cells directly. Theoretically, a favorable immunological tumor microenvironment (TME) would be constructed by mild-PTT.18,19 The relatively low temperature generated by mild-PTT can induce immunogenic cell death (ICD), which may further activate adaptive immunity to kill tumor cells.20,21 However, the mild temperature demonstrated an inefficient therapeutic effect and resulted in the overexpression of PD-L1 in solid tumors.17,22
Activating the stimulator of interferon genes (STING) pathway has been developed as a promising synergetic target for immunotherapy recently.23,24 The STING protein triggers downstream signaling by the activation and recruitment of interferon regulatory factor 3 (IRF3), TANK-binding kinase 1 (TBK1), and nuclear factor Kappa B (NF-κB) on the endoplasmic reticulum (ER) surface,25 followed by the expression and secretion of type I interferons (IFNs).26 Subsequently, type I IFNs stimulate the adaptive and innate immunity against cancer by promoting dendritic cell (DC) maturation and antigen presentation to stimulate T cells.27 In particular, manganese (Mn), a nutritional inorganic trace element, can amplify the activation of the cyclic GMP-AMP synthase (cGAS) and STING by strengthening cGAMP generation and enhancing cGAMP/STING binding affinity.28 Moreover, Mn2+ can also be used as a potent T1-weighted magnetic resonance imaging (MRI) contrast agent to monitor the drug delivery process.29
In this work, aiming at combining a mild photothermal therapy with cancer immunotherapy to improve the checkpoint blockade therapy for mild photothermal immunotherapy of colorectal cancer, we prepared a magnetic resonance/photothermal bimodal imaging theragnostic nanodrug by integrating MnO2 into PEGylated MPDA NPs (MnO2@MPDA-PEG NPs). Gratifyingly, after accumulation in colorectal tumor, Mn2+ could be released through the Fenton-like reaction of MnO2 loaded in the theragnostic nanodrug. Then, the STING pathway could be activated by Mn2+ and the ICD was elicited by mild PTT, leading to DC maturation and T cell infiltration, which could improve the therapeutic efficacy of PD-L1 antibody (aPD-L1). Thus, the dual imaging-visible MnO2@MPDA-PEG NPs may be generally applied to improve the immune response in immunologically cold tumors and promote the therapeutic effect of aPD-L1 immunotherapy in CRC patients.
Results and discussion
Construction and characterization of MnO2@MPDA-PEG NPs
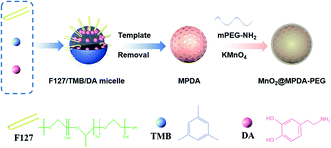
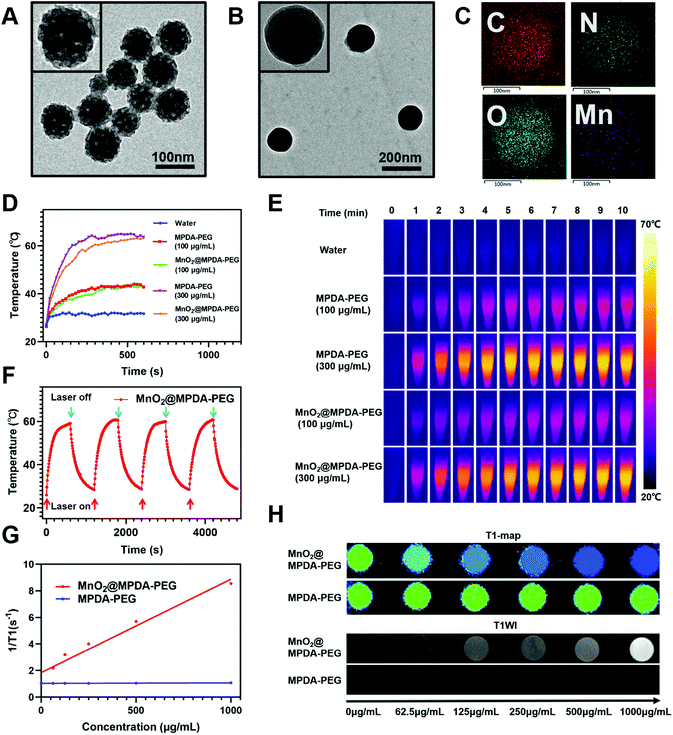
MPDA NPs were synthesized by the assembly of a pluronic F127 stabilized emulsion droplets and primary DA particles on water/1,3,5-trimethylbenzene (TMB) interfaces.14 The PEGylated MPDA NPs were then oxidized by KMnO4 to form MnO2@MPDA-PEG NPs (Scheme 1). The PEG chains could promote the EPR effect to enhance tumor accumulation of nanoparticles by forming the hydrophilic corona which could prolong the circulation time.30 Typical transmission electron microscopy (TEM) images revealed the mesoporous structure and the uniform spheric morphology of MPDA NPs. Further characterization of the surface topography of MPDA NPs indicated irregular pores with a size less than 20 nm (Fig. 1A). The morphology of MnO2@MPDA-PEG with a rough capping layer was also observed in TEM images (Fig. 1B). Here, the typical porous nanostructure of MPDA-PEG was completely covered by a layer of MnO2. Moreover, as shown in element mapping (Fig. 1C), MnO2@MPDA-PEG NPs had a fairly homogeneous distribution of Mn, O and N. As shown in Fig. S1A,† MnO2@MPDA-PEG NPs showed a hydrodynamic diameter of 174.2 nm, while MPDA NPs and MPDA-PEG NPs showed a hydrodynamic diameter of 154 nm and 158.5 nm respectively, indicating the successful decoration of the MnO2 layer. The low polydispersity (0.123 for MPDA, 0.038 for MPDA-PEG NPs and 0.037 for MnO2@MPDA-PEG NPs) indicated the highly uniform size of the NPs. The zeta potentials were tested and found to be −12.8 mV, −13.4 mV and −14.0 mV for MPDA NPs, MPDA-PEG NPs and MnO2@MPDA-PEG NPs, respectively (Fig. S1B†). The stability of size and zeta potentials of MPDA NPs, MPDA-PEG and MnO2@MPDA-PEG NPs within 7 days were further measured, as shown in Fig. S1C and D.† The particle size and zeta potentials did not change obviously, indicating their good stability. As a new photothermal agent, MPDA-PEG NPs exhibited a remarkably strong NIR absorption. As showed in Fig. 1D and E, the temperature of MPDA-PEG NPs and MnO2@MPDA-PEG NPs solution increased in a concentration-dependent manner. When exposed to an 808 nm laser for 10 min (1 W cm−2), the temperatures of the MPDA-PEG and MnO2@MPDA-PEG NP solutions (100 μg ml−1) and the temperatures of the MPDA-PEG and MnO2@MPDA-PEG NPs solutions (300 μg ml−1) increased about 17 °C and 36 °C, respectively, whereas the temperature of PBS only increased 5 °C. In addition, after four laser on/off cycles, no obvious change was observed in the ability of the nanoparticles to elevate the solution temperature, indicating the photostability of MnO2@MPDA-PEG NPs (Fig. 1F). As shown in Fig. S2,† encapsulation of MnO2 did not weaken the NIR absorption of MPDA-PEG NPs. To assess the potential of MnO2@MPDA-PEG as an MRI contrast agent, we performed a cellular MRI analysis. After incubating CT26 cells with MnO2@MPDA-PEG NPs, the signal intensity in CT26 cells increased on T1WI MRI (Fig. 1H and S3†). As shown in Fig. 1G, the averaged r1 value of MnO2@MPDA-PEG was 11 mM−1 s−1, while the value of MPDA-PEG was 0.06 mM−1 s−1, suggesting that MnO2 mainly exhibited T1 contrast enhancement. The averaged r1 value of CT26 cells incubated with MnO2@MPDA-PEG was much higher than that of Gd-DPTA (r1 = 3.5–5.5 mM−1 s−1), a widely known MRI contrast agent used in the clinic.31 In addition, no obvious hemolysis was detected for the MPDA-PEG or MnO2@MPDA-PEG NP treated red cells (Fig. S4†).Cancer cell uptake and dendritic cell maturation mediated by MnO2@MPDA-PEG NPs
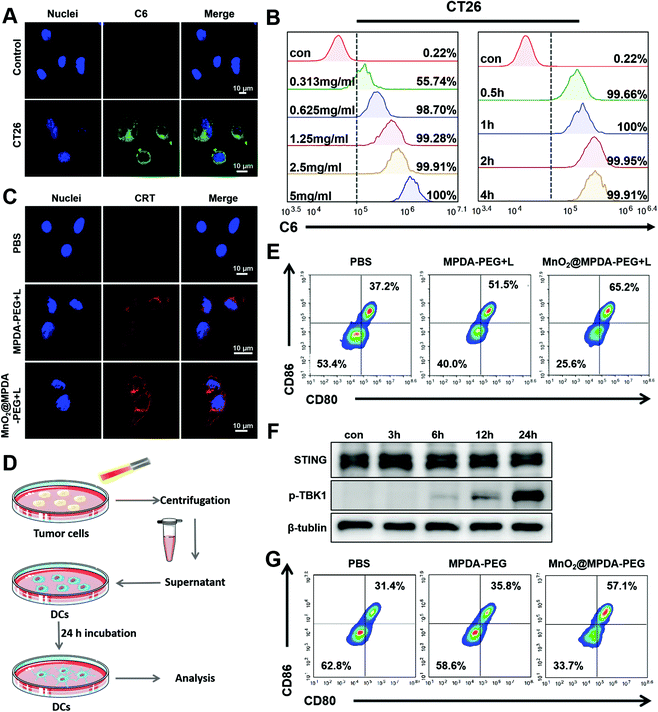
The cytotoxicity of MPDA-PEG and MnO2@MPDA-PEG NPs in CT26 cells was evaluated by the cell counting kit-8 (CCK8) assay. As shown in Fig. S5 in the ESI,† the MPDA-PEG NPs showed negligible cytotoxicity, indicating good compatibility. In contrast, MnO2@MPDA-PEG NPs exhibited obvious toxicity likely due to the oxidative hydroxyl (˙OH) generated by MnO2.29 Furthermore, with the assistance of mild-PTT under NIR laser irradiation, the viability of CT26 cells treated with MnO2@MPDA-PEG was the lowest, indicating the best therapeutic effect of MnO2@MPDA-PEG- in vitro.The in vitro cell uptake of MPDA-PEG NPs was assessed by flow cytometry and confocal laser scanning microscopy (CLSM). The CT26 cancer cells were incubated with coumarin-loaded MPDA-PEG NPs for 0.5 to 4 h. As shown in Fig. 2A, the MPDA-PEG NPs were internalized into cells. Quantitative analysis showed that cell uptake within 4 h was consistent with the CLSM observations. The cell uptake level of MPDA-PEG NPs increased within 0.5 h and then leveled off, and cell uptake increased with the increasing concentration of MPDA-PEG NPs (Fig. 2B). These results indicated that the MnO2@MPDA-PEG NPs could be delivered into tumor cells effectively, simultaneously allowing antitumor therapy and MRI.
HMGB1 and CRT are admittedly biochemical indicators of immunogenic cell death (ICD).20,32 Therefore, in vitro and in vivo ICD signaling molecules produced by mild-PTT were investigated in CT26 cells. As shown in Fig. 2C, CT26 cells treated with MnO2@MPDA-PEG or MPDA-PEG NPs under mild-PTT showed an obvious expression of CRT on the surface of the cell membrane. HMGB1 was also detected in CT26 cells by ELISA. As shown in Fig. S6 in the ESI,† mild-PTT induced HMGB1 release, while PBS did not (p < 0.05). In addition, we further investigated the role of MnO2@MPDA-PEG NPs in eliciting CRT exposure under laser irradiation in vivo. According to the images of tumor sections in Fig. S7 in the ESI,† both MPDA-PEG + laser (MPDA-PEG + L) treatment and MnO2@MPDA-PEG + laser (MnO2@MPDA-PEG + L) treatment could induce CRT exposure. In addition, we also demonstrated that the mild heating within the range of 37–43 °C could continuously upregulate the expression of PD-L1 in CT26 cells (Fig. S8, ESI†), which represented a common limit for phototherapy and justified the rationality and necessity of our combination strategy with aPD-L1 administration. Besides, the abilities of nanodrugs to induce ICD which promoted DC maturation was also investigated. As shown in Fig. 2D, PBS, MPDA-PEG and MnO2@MPDA-PEG NPs were co-incubated with CT26 cells for 24 h, followed by mild-photothermal treatment. The supernatant was then used to incubate the BMDC cells for another 24 h and the maturation of BMDC cells was analyzed by flow cytometry. The proportions of mature BMDCs for the MnO2@MPDA-PEG + L treatment group and the MPDA-PEG + L treatment group were increased by 14.3% and 28%, respectively, obviously higher than that of the PBS treatment group (Fig. 2E).
Mn2+ is reported to strengthen the activation of the cGAS and STING by enhancing the cGAMP generation and cGAMP/STING binding affinity.28 To verify the capability of MnO2@MPDA-PEG to activate cGAS-STING pathway in CT26 cells, STING and its downstream marker P-TPK1 were analyzed by western blot (Fig. 2F). It was found that prolonging the incubation time of DC2.4 cells with Mn2+ to 24 h from 0 h could cause a significant increase in the expression level of P-TPK1. Assumably, MnO2@MPDA-PEG was decomposed into Mn2+ which was then taken up by the DC2.4 cells to activate the cGAS-STING pathway. Type I IFN (particularly IFN-β) as the downstream signal molecule of the cGAS/STING pathway contributing to DCs maturation and migration is widely recognized as a bridge for innate and adaptive immunity.33 To further verify whether Mn2+ decomposed by MnO2@MPDA-PEG promoted the maturation of DC cells by activating the cGAS-STING pathway, we co-incubated BMDCs with MnO2@MPDA-PEG, MPDA-PEG NPs and PBS, and analyzed the maturation of BMDCs by flow cytometry. As shown in Fig. 2G, the percentage of BMDCs maturation in the MnO2@MPDA-PEG group was significantly higher than that in the MPDA-PEG NPs group and the PBS group. These data suggested that Mn2+ promoted BMDC maturation by activating the cGAS/STING pathway, which would eventually lead to significant anticancer immunity.
In vivo imaging
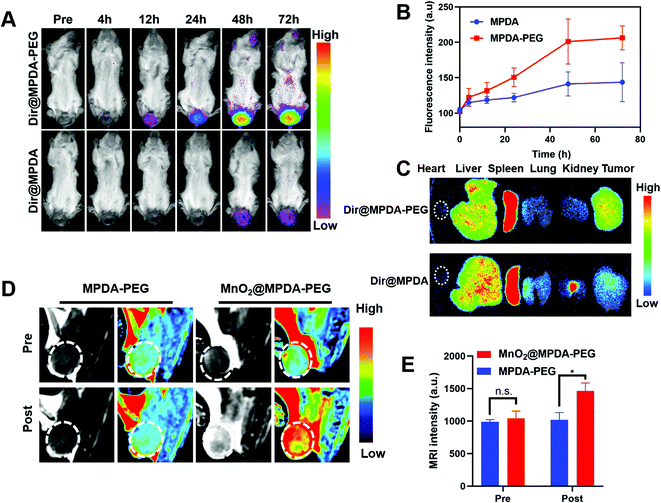
To explore the in vivo distribution of MPDA-PEG, orthotopic mice models of CRC were constructed by injecting CT26 cells into the submucosa of colorectum (Fig. S9, ESI†).34 The DIR-labeled MPDA-PEG (DiR@MPDA-PEG) was injected to investigate the in vivo distribution of MDPA-PEG, and DiR@MPDA was injected as a control. The fluorescence intensity at the tumor site increased gradually and peaked at 48 h after administering DiR@MPDA-PEG NPs, whereas a negligible signal was detected in the DiR@MPDA NPs treatment group (Fig. 3A and B). The DiR@MPDA-PEG distribution in the major organs and tumor was also analyzed by ex vivo imaging, which showed a strong fluorescence in the tumor (Fig. 3C), indicating that DiR@MPDA-PEG NPs preferentially accumulated in the tumor via the so-called tumor EPR effect.35,36 However, in the DiR@MPDA NPs group, fluorescence was observed mainly in the liver, spleen, and lungs. In addition, MnO2 has been reported to be a novel MRI contrast agent triggerable with the tumor microenvironment (TME).37 In TME featuring enriched H2O2 and low pH, MnO2 could be reduced into Mn2+, which could significantly decrease the longitudinal relaxation time of protons, leading to the significantly improved MRI contrast between the tumor region and the background in a highly specific manner.38 Different from the conventional MRI contrast agents (e.g., Gd), in vivo TME-responsive MRI contrast agents can reduce the false imaging caused by the non-specific distribution of contrast agents, achieving specific imaging of lesions.38 To study the potential of MnO2@MPDA-PEG NPs as an effective T1-weighted MRI contrast agent, sequential MRI scans of tumors were performed. After injection of MnO2@MPDA-PEG NPs, the tumor MRI signal intensity significantly increased (Fig. 3D and E). These results revealed that MnO2@MPDA-PEG NPs could be a promising MRI contrast agent for solid tumors.MnO2@MPDA-PEG mediated antitumor efficacy in vivo
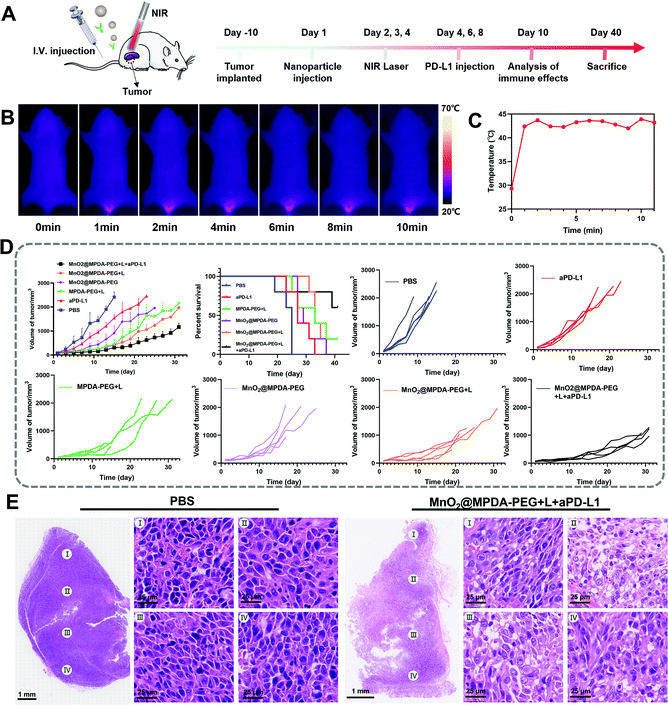
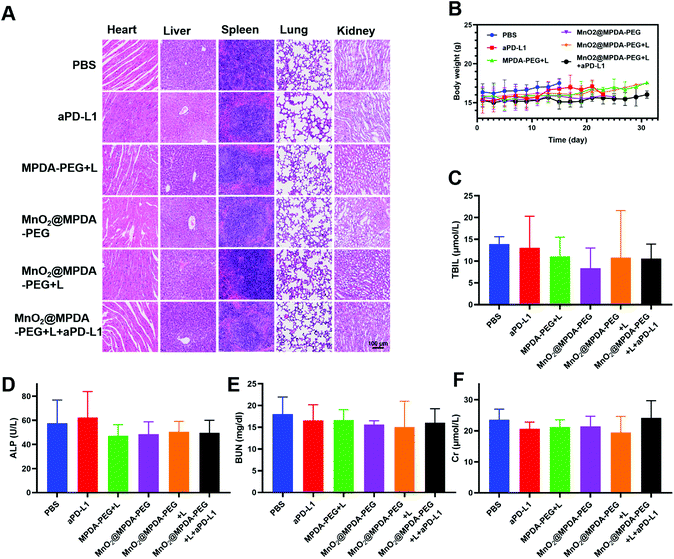
The antitumor effect of MnO2@MPDA-PEG was investigated in CT26 tumor-bearing mice (Fig. 4A). To monitor the changes of temperature in situ, an infrared thermal imaging camera was employed to record thermographic maps in the tumor temperature. The temperature was maintained at 43–45 °C by adjusting the laser power manually (Fig. 4B and C).39 BALB/c mice inoculated with CT26 cells were randomly grouped to receive separately a single tail vein injection of PBS, aPD-L1, MPDA-PEG + L, MnO2@MPDA-PEG, MnO2@MPDA-PEG + L, and MnO2@MPDA-PEG + L + aPD-L1. An 808 nm NIR laser was then applied to the tumor area for 11 min at 24 h, 48 h, and 72 h after tail vein injection of MPDA-PEG or MnO2@MPDA-PEG, according to the in vivo tumor accumulation results revealed by in vivo imaging experiment (Fig. 3A and B). aPD-L1 was injected through the tail vein at 4 d, 6 d and 8 d after nanoparticle injection. The therapeutic effects in CT26 tumor-bearing mice are summarized in Fig. 4D and S10 in the ESI.† The aPD-L1-alone treatment showed little tumor growth inhibition, just slightly better than in the inert PBS control group. In comparison, a more significant inhibitory effect on tumor growth was observed in the MPDA-PEG + L, MnO2@MPDA-PEG and MnO2@MPDA-PEG + L groups, with MnO2@MPDA-PEG + L showing the best effect among the three groups likely due to the synergistic effect of mild-PTT and MnO2. Excitingly, the MnO2@MPDA-PEG-L + aPD-L1 treatment group showed the slowest tumor growth among all treatment groups, indicating that the MnO2@MPDA-PEG-L treatment synergized with the ICB immunotherapy to markedly boost the therapeutic outcome. As shown in Fig. 4E, the H&E staining assay in the MnO2@MPDA-PEG + L + aPD-L1 group showed more changes of cell morphology and necrosis in tumor tissues than that in the PBS group, also providing direct evidence of a strong inhibitory effect of combination therapy on the tumor group.According to the H&E staining assays, no obvious side effect was observed in major organs including heart, spleen, liver, lungs and kidneys (Fig. 5A), and no significant change in body weight was detected over the treatments (Fig. 5B). The safety of nanodrugs was further studied by monitoring the liver function and renal function of the BALB/c mice. The detection of liver function markers, including total bilirubin (TBIL) and alkaline phosphatase (ALP), showed that none of the treatments induced any toxicity to the liver function (Fig. 5C and D). The kidney function after treatment detected by blood urea nitrogen (BUN) and creatinine (Cr) was not influenced as well (Fig. 5E and F). The above results clearly showed the prominent therapeutic effect and biosafety of MnO2@MPDA-PEG, highlighting its potential for theragnostic applications.
In vivo ICD signaling and T cells activation mediated by MnO2@MPDA-PEG NPs under laser irradiation
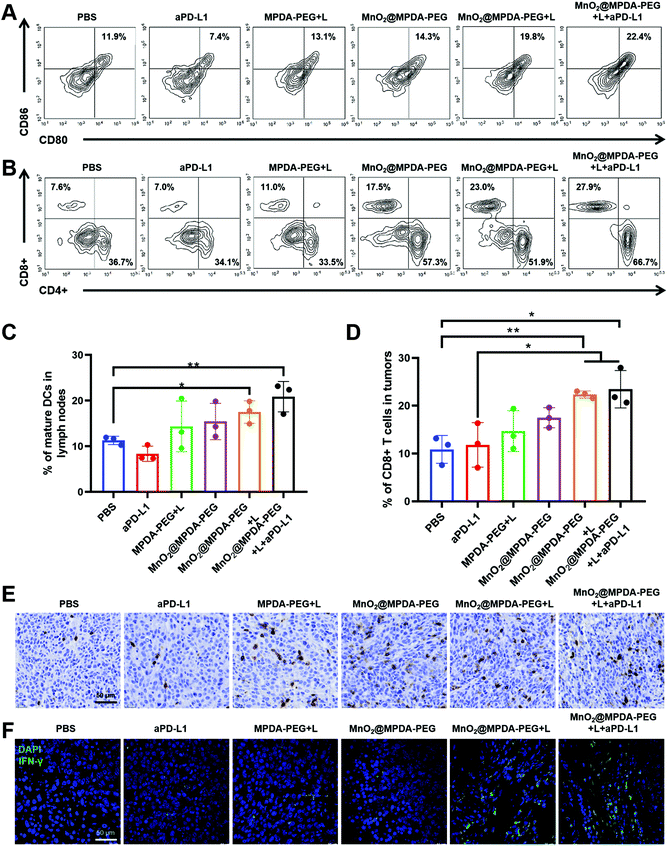
To verify the mechanisms of antitumor immune responses induced by the combination therapy of MnO2@MPDA-PEG NPs-based mild-PTT and aPD-L1, we explored their ability to activate DCs and T cells in vivo. As shown in Fig. 6A and C the MnO2@MPDA-PEG + L treatment resulted in a higher proportion of mature DCs in the lymph nodes than the MPDA-PEG + L treatment (19.8% vs. 13.1%), indicating the synergistic effect of mild-PTT and Mn2+. The MnO2@MPDA-PEG + L + aPD-L1 group showed even more maturation of DCs (22.4%). Similar results were also obtained in tumors (Fig. S11†).Tumor-infiltration of CD8+ T cells was regarded as strong evidence of the immunologic state of the tumor, i.e. immune “cold” or immune “hot”. As shown in the flow cytometry analysis (Fig. 6B and D), mice treated with PBS and aPD-L1 barely showed infiltration of CD8+ T cells in tumor tissues, while mice receiving the other treatments showed more CD8+ T cells infiltration. Specifically, mice treated with MnO2@MPDA-PEG + L + aPD-L1 displayed the most robust infiltration of CD8+ T cells in tumor (27.9%), with the PBS treatment showing the least tumor infiltration of CD8+ T cells (7.6%). Moreover, immunohistochemical analysis of CD8+ T cells obtained consistent results. That is, mice treated with MnO2@MPDA-PEG + L + aPD-L1 and MnO2@MPDA-PEG + L showed remarkable tumor infiltration of CD8+ T cells (Fig. 6E and S12†). CD4+ T cells in tumors were also counted, and no significant differences were observed among different treatment groups (Fig. S13, ESI†).
Considering that CD8+ T cells can produce IFN-γ and trigger the secretion of proinflammatory cytokines for a strong antitumor immunity,40 the IFN-γ+ CD8+ T cells in tumor were measured to confirm that T cells were activated for cancer cell killing. As shown in Fig. 6F, compared with the PBS and aPD-L1 treatment groups, other treatment groups induced increased proportions of IFN-γ+CD8+ T cells. Moreover, MnO2@MPDA-PEG + L + aPD-L1 treatment induced the highest IFN-γ secretion, indicating that the combination treatment enhanced anticancer immune response most efficiently. Based on the data shown in Fig. 6, MnO2@MPDA-PEG + L + aPD-L1 has the strongest capacity to induce potent antitumor immunity.
Conclusion
The insufficient therapeutic effect of PD-L1 antibody (aPD-L1) in CRC immunotherapy in the clinic remains a great challenge nowadays. A theragnostic nanodrug (MnO2@MPDA-PEG NPs) was prepared for MRI/photothermal imaging-guided mild photothermal immunotherapy. MPDA-based mild PTT, served as an ICD inducer, promoted the generation of tumor-associated antigens and triggered the production of DAMPs. Mn2+, as an adjuvant for immunization, promoted DC maturation and T cell activation. In vivo study demonstrated that the infiltration and function of CD8+ T cells after MnO2@MPDA-PEG NPs plus NIR irradiation treatment significantly increased in tumors, which ultimately promoted the immunotherapy of aPD-L1 against CT26. Therefore, the encouraging results indicated that MnO2@MPDA-PEG NPs could induce a positive shift in CRC tumors from “cold” to “hot”, thereby promoting immunotherapy of aPD-L1.Author contributions
Caiying Li, Tan Li, and Kexin Niu contributed to the conceptualization, data curation and investigation as well as writing of the original draft. Zecong Xiao, Jing Huang, and Ximin Pan contributed to the formal analysis as well as writing of the original draft. Yi Sun, Yongchen Wang, and Decai Ma contributed to the methodology. Peiyi Xie, Xintao Shuai, and Xiaochun Meng contributed to the supervision and writing – review and editing.Conflicts of interest
There are no conflicts to declare.Acknowledgements
This research was supported by the National Natural Science Foundation of China (51933011, 31971296, 81902867), the Key Areas Research and Development Program of Guangzhou (202007020006) and the Natural Science Foundation of Guangdong Province (2021A1515011795). We also thank Jinglu Yang for assistance with the writing of the article.Female BALB/c mice (6–8 weeks) were provided by GuangDong GemPharmatech Co., Ltd. All care and experiments on animals were carried out under the international animal experiment guidelines and maintained under protocols approved by the Sixth Affiliated Hospital, Sun Yat-Sen University Laboratory Animal Center (SYXK 2018-0190) and Sun Yat-sen University Laboratory Animal Center (SYXK 2016-0112).
References
- F. Bray, J. Ferlay, I. Soerjomataram, R. L. Siegel, L. A. Torre and A. Jemal, CA Cancer J. Clin., 2018, 68, 394–424 CrossRef PubMed.
- M. F. Sanmamed and L. Chen, Cell, 2018, 175, 313–326 CrossRef CAS PubMed.
- M. Yuan, L. L. Huang, J. H. Chen, J. Wu and Q. Xu, Signal Transduction Targeted Ther., 2019, 4, 61 CrossRef PubMed.
- H. Hu, L. Kang, J. Zhang, Z. Wu, H. Wang, M. Huang, P. Lan, X. Wu, C. Wang, W. Cao, J. Hu, Y. Huang, L. Huang, H. Wang, L. Shi, Y. Cai, C. Shen, J. Ling, X. Xie, Y. Cai, X. He, R. Dou, J. Zhou, T. Ma, X. Zhang, S. Luo, W. Deng, L. Ling, H. Liu and Y. Deng, Lancet Gastroenterol. Hepatol., 2022, 7, 38–48 CrossRef.
- A. B. Benson, A. P. Venook, M. M. Al-Hawary, M. A. Arain, Y. J. Chen, K. K. Ciombor, S. Cohen, H. S. Cooper, D. Deming, I. Garrido-Laguna, J. L. Grem, A. Gunn, S. Hoffe, J. Hubbard, S. Hunt, N. Kirilcuk, S. Krishnamurthi, W. A. Messersmith, J. Meyerhardt, E. D. Miller, M. F. Mulcahy, S. Nurkin, M. J. Overman, A. Parikh, H. Patel, K. Pedersen, L. Saltz, C. Schneider, D. Shibata, J. M. Skibber, C. T. Sofocleous, E. M. Stoffel, E. Stotsky-Himelfarb, C. G. Willett, A. Johnson-Chilla and L. A. Gurski, J. Natl. Compr. Cancer Network, 2020, 18, 806–815 Search PubMed.
- T. Andre, K. K. Shiu, T. W. Kim, B. V. Jensen, L. H. Jensen, C. Punt, D. Smith, R. Garcia-Carbonero, M. Benavides, P. Gibbs, C. de la Fouchardiere, F. Rivera, E. Elez, J. Bendell, D. T. Le, T. Yoshino, E. Van Cutsem, P. Yang, M. Z. H. Farooqui, P. Marinello, L. A. Diaz Jr. and K. Investigators, N. Engl. J. Med., 2020, 383, 2207–2218 CrossRef CAS PubMed.
- K. Ganesh, Z. K. Stadler, A. Cercek, R. B. Mendelsohn, J. Shia, N. H. Segal and L. A. Diaz Jr., Nat. Rev. Gastroenterol. Hepatol., 2019, 16, 361–375 CrossRef PubMed.
- C. Riera-Domingo, A. Audige, S. Granja, W. C. Cheng, P. C. Ho, F. Baltazar, C. Stockmann and M. Mazzone, Physiol. Rev., 2020, 100, 1–102 CrossRef CAS PubMed.
- Y. Liu, P. Bhattarai, Z. Dai and X. Chen, Chem. Soc. Rev., 2019, 48, 2053–2108 RSC.
- N. Fernandes, C. F. Rodrigues, A. F. Moreira and I. J. Correia, Biomater. Sci., 2020, 8, 2990–3020 RSC.
- H. S. Jung, P. Verwilst, A. Sharma, J. Shin, J. L. Sessler and J. S. Kim, Chem. Soc. Rev., 2018, 47, 2280–2297 RSC.
- D. Wu, J. Zhou, X. Chen, Y. Chen, S. Hou, H. Qian, L. Zhang, G. Tang, Z. Chen, Y. Ping, W. Fang and H. Duan, Biomaterials, 2020, 238, 119847 CrossRef CAS PubMed.
- Y. Wang, S. Song, T. Lu, Y. Cheng, Y. Song, S. Wang, F. Tan, J. Li and N. Li, Biomaterials, 2019, 220, 119405 CrossRef CAS PubMed.
- Y. Xing, J. Zhang, F. Chen, J. Liu and K. Cai, Nanoscale, 2017, 9, 8781–8790 RSC.
- F. Zhou, S. Wu, S. Song, W. R. Chen, D. E. Resasco and D. Xing, Biomaterials, 2012, 33, 3235–3242 CrossRef CAS PubMed.
- Z. Zhou, N. Jiang, J. Chen, C. Zheng, Y. Guo, R. Ye, R. Qi and J. Shen, J. Nanobiotechnol., 2021, 19, 375 CrossRef CAS PubMed.
- L. Huang, Y. Li, Y. Du, Y. Zhang, X. Wang, Y. Ding, X. Yang, F. Meng, J. Tu, L. Luo and C. Sun, Nat. Commun., 2019, 10, 4871 CrossRef PubMed.
- B. Frey, E. M. Weiss, Y. Rubner, R. Wunderlich, O. J. Ott, R. Sauer, R. Fietkau and U. S. Gaipl, Int. J. Hyperthermia, 2012, 28, 528–542 CrossRef CAS PubMed.
- T. A. Mace, L. Zhong, K. M. Kokolus and E. A. Repasky, Int. J. Hyperthermia, 2012, 28, 9–18 CrossRef CAS PubMed.
- L. Galluzzi, A. Buque, O. Kepp, L. Zitvogel and G. Kroemer, Nat. Rev. Immunol., 2017, 17, 97–111 CrossRef CAS PubMed.
- D. V. Krysko, A. D. Garg, A. Kaczmarek, O. Krysko, P. Agostinis and P. Vandenabeele, Nat. Rev. Cancer, 2012, 12, 860–875 CrossRef CAS PubMed.
- J. Peng, Y. Xiao, W. Li, Q. Yang, L. Tan, Y. Jia, Y. Qu and Z. Qian, Adv. Sci., 2018, 5, 1700891 CrossRef PubMed.
- H. Du, T. Xu and M. Cui, Biomed. Pharmacother., 2021, 133, 110972 CrossRef CAS PubMed.
- J. Zheng, J. Mo, T. Zhu, W. Zhuo, Y. Yi, S. Hu, J. Yin, W. Zhang, H. Zhou and Z. Liu, Mol. Cancer, 2020, 19, 133 CrossRef CAS PubMed.
- Q. Chen, L. Sun and Z. J. Chen, Nat. Immunol., 2016, 17, 1142–1149 CrossRef CAS PubMed.
- A. Ablasser and Z. J. Chen, Science, 2019, 363, eaat8657 CrossRef CAS PubMed.
- M. Gao, Y. Q. Xie, K. Lei, Y. Zhao, A. Kurum, S. Van Herck, Y. Guo, X. Hu and L. Tang, Adv. Ther., 2021, 4, 2100065 CrossRef CAS.
- C. Wang, Y. Guan, M. Lv, R. Zhang, Z. Guo, X. Wei, X. Du, J. Yang, T. Li, Y. Wan, X. Su, X. Huang and Z. Jiang, Immunity, 2018, 48, 675–687 CrossRef CAS PubMed.
- J. Tan, X. Duan, F. Zhang, X. Ban, J. Mao, M. Cao, S. Han, X. Shuai and J. Shen, Adv. Sci., 2020, 7, 2003036 CrossRef CAS.
- A. J. Cole, A. E. David, J. Wang, C. J. Galban and V. C. Yang, Biomaterials, 2011, 32, 6291–6301 CrossRef CAS PubMed.
- J. S. Choi, J. H. Lee, T. H. Shin, H. T. Song, E. Y. Kim and J. Cheon, J. Am. Chem. Soc., 2010, 132, 11015–11017 CrossRef CAS PubMed.
- A. Ahmed and S. W. G. Tait, Mol. Oncol., 2020, 14, 2994–3006 CrossRef CAS PubMed.
- L. Hou, C. Tian, Y. Yan, L. Zhang, H. Zhang and Z. Zhang, ACS Nano, 2020, 14, 3927–3940 CrossRef CAS PubMed.
- N. Hite, A. Klinger, L. Hellmers, G. A. Maresh, P. E. Miller, X. Zhang, L. Li and D. A. Margolin, Dis. Colon Rectum, 2018, 61, 698–705 CrossRef PubMed.
- J. S. Suk, Q. Xu, N. Kim, J. Hanes and L. M. Ensign, Adv. Drug Delivery Rev., 2016, 99, 28–51 CrossRef CAS PubMed.
- U. Prabhakar, H. Maeda, R. K. Jain, E. M. Sevick-Muraca, W. Zamboni, O. C. Farokhzad, S. T. Barry, A. Gabizon, P. Grodzinski and D. C. Blakey, Cancer Res., 2013, 73, 2412–2417 CrossRef CAS PubMed.
- W. Fan, W. Bu, B. Shen, Q. He, Z. Cui, Y. Liu, X. Zheng, K. Zhao and J. Shi, Adv. Mater., 2015, 27, 4155–4161 CrossRef CAS PubMed.
- M. Yu, X. Duan, Y. Cai, F. Zhang, S. Jiang, S. Han, J. Shen and X. Shuai, Adv. Sci., 2019, 6, 1900037 CrossRef PubMed.
- Z. H. Feng, Z. T. Li, S. Zhang, J. R. Wang, Z. Y. Li, M. Q. Xu, H. Li, S. Q. Zhang, G. X. Wang, A. Liao and X. Zhang, Acta Biomater., 2021, 136, 495–507 CrossRef CAS PubMed.
- V. Berner, H. Liu, Q. Zhou, K. L. Alderson, K. Sun, J. M. Weiss, T. C. Back, D. L. Longo, B. R. Blazar, R. H. Wiltrout, L. A. Welniak, D. Redelman and W. J. Murphy, Nat. Med., 2007, 13, 354–360 CrossRef CAS PubMed.
Footnotes |
| † Electronic supplementary information (ESI) available: Methods, materials and additional figures. See DOI: https://doi.org/10.1039/d2bm00505k |
| ‡ Co-first authors. |
| This journal is © The Royal Society of Chemistry 2022 |

