Preparation and solution properties of polyacrylamide-based silica nanocomposites for drag reduction application
Liang
Xing
,
Yangchuan
Ke
 *,
Xu
Hu
and
Peng
Liang
CNPC Nanochemistry Key Laboratory, College of Science, China University of Petroleum, Beijing, 102249, China. E-mail: kyc066@sohu.com
First published on 2nd June 2020
Abstract
Drag reducers (DRs) have a significant effect on shale hydraulic fracturing. Hence, it is very essential to develop excellent DRs for engineering applications. In this work, a novel nanocomposite drag reducer (PASD-SiO2) was synthesized using acrylamide (AM), sodium 4-styrenesulfonate (SSS), dimethylhexadeylallylammonium bromide (DMAAB) and modified nanosilica by redox free radical copolymerization. Fourier transform infrared spectroscopy (FT-IR), 13C nuclear magnetic resonance spectroscopy (13C NMR), thermal gravimetric analysis (TGA), transmission electron microscopy (TEM), elemental analysis, dynamic light scattering spectrophotometer (DLS) and scanning electron microscopy (SEM) were utilized to characterize the copolymer. Then its solution properties were evaluated. The results showed that the nanocomposite exhibited better performances of temperature resistance, salt tolerance, shear resistance and viscoelasticity than those of a pure polymer. The indoor drag reduction measurements were carried out in a closed loop flow system. The maximum drag reduction efficiency of PASD-3%SiO2 was 59.2%, which was 9.7% higher than that of a neat polymer. These improvements in desirable properties were mainly attributed to the dispersion of silica nanoparticles in the polymer matrix. Nanosilica acted as a cross-linker and enhanced the strength of the network structures, which improved the structural stability. In addition, the polymer containing silica nanoparticles exhibited improved structural rigidity. Therefore, the polymer molecules showed more persistent and effective restriction towards vortices under turbulent flows. This novel drag reducer showed good potential for slickwater fracturing applications.
1. Introduction
Slickwater fracturing has become a key stimulation technology for shale gas development because of its high efficiency and low cost.1–3 Unlike conventional fracturing fluid, a slickwater fracturing fluid shows a relatively low viscosity. In order to effectively create complex fracture networks and a transport proppant, fracturing is almost conducted with a high displacement and a large volume. This situation leads to huge energy loss caused by the friction inside the pipelines and fractures.3–5 In this context, drag reducers (DRs) play a crucial role in minimizing the energy loss in shale stimulation.6 Currently, polyacrylamide (PAM) and its derivatives (such as partially hydrolyzed polyacrylamide) have been broadly used as DRs in slickwater treatments.3,6–9Nevertheless, these polymers have potential for thermal degradation and precipitation under high temperature and high salinity conditions, respectively.10,11 Additionally, they usually suffer from shear degradation under turbulent flow conditions.12 To overcome these drawbacks, a number of researchers have started to investigate the modification of polyacrylamide. Liu et al. investigated the effect of polymer microstructures on drag reduction performance. The drag reducer in their study was synthesized using acrylamide, acrylic acid, 2-acrylamido-2-methylpropanesulfonic acid and butyl acrylate.13 Some scholars have reported that DRs with a fraction of hydrophobic moieties show better performance. Wang et al. prepared a hydrophobicity associated drag reducer and found that the novel polymer showed better efficiency than PAM under high Reynolds number and high salinity conditions.14
In recent years, many researchers in academic and industrial fields improve the desirable performances of polymers by the inclusion of a low content of inorganic nanoparticles.15–19 Nanosilica is preferentially investigated due to its nanometer size, enormous numbers of hydrogen bonds, and high specific surface area. The presence of silica nanoparticles in a polymer matrix leads to a great enhancement of strength, thermal and mechanical stability.20–25 For example, Akindoyo et al. reported that the silica fluid had a positive effect on the alleviation of mechanical degradation.26 Some recent studies have shown a polymer/silica nanocomposite is conducive to the enhancement of salt resistance and thermal stability.27–29 Zhu et al. pointed out that a HAHPAM/silica hybrid exhibited superior shear stability, long-term thermal stability and more excellent oil recovery factors than HAHPAM.30 Ji et al. demonstrated that a poly(AM-co-AA)/silica microsphere exhibited better salt-tolerance, higher shear stability and more effective plugging performance in high-permeability channels than poly(AM-co-AA).31
The improvement of excellent performance is strongly related to the level of adhesion at the interface between the polymer matrix and silica nanoparticles.32,33 However, original silica nanoparticles have a propensity to agglomerate into bigger particles because of their high surface free energy and nanometer dimensions.34,35 This situation easily results in inhomogeneous dispersion in a polymer matrix and has a negative effect on the desired performance. So the silica surface must be modified to improve the compatibility between silica nanoparticles and an organic polymer matrix.36,37 A silane coupling agent is typically used to modify the original silica nanoparticles by some researchers. Modified silica nanoparticles show better adhesion with organic polymers and more uniform dispersion.38
It is well accepted that polymer/silica nanocomposites combining the advantages of the inorganic fillers and the organic polymers have been widely applied. Although some research studies have reported on the application of nanocomposites in conventional hydraulic fracturing, most of them focus on the performance evaluation. However, little research has been devoted to the synthesis of nanocomposites as drag reducers. Here, we are focusing on preparing a new polymer/silica drag reducer. We also hope that this strategy can provide a new opportunity in the development of high-efficiency DRs using nanotechnology. AM, SSS, DMAAB and modified nanosilica were used to synthesize the desired product. Subsequently, the structures were characterized by FT-IR, 13C NMR, TEM, SEM, DLS and TGA. The salt resistance, temperature tolerance, shear stability and rheological behavior also were systematically investigated. Finally, the drag reduction performance was evaluated in a closed loop flow system.
2. Experimental
2.1. Materials
For this work, ethyl silicate (Si(OC2H5)4, TEOS, 99.5%) was purchased from Sinopharm Chemical Reagent Co., Ltd. Absolute ethanol (AR, 99.7%), ammonia solution (AR, NH3·H2O, 25%) and sodium chloride (NaCl, 99.5%, AR) were provided by Beijing Chemical Works. 3-Methacryloxypropyltrimethoxysilane (γ-MPS, 97.0%), sodium 4-styrenesulfonate (SSS, 99.0%) and allyl bromide (98.0%) were obtained from Aladdin Industrial Corporation. Acrylamide (AM, AR, 98.0%), ethyl acetate (AR, 99.5%), ammonium persulphate (APS, AR, 98.0%), sodium hydrogen sulfite (NaHSO3, AR, 98%), sodium hydroxide (NaOH, AR, 99.0%) were supplied by Fuchen (Tianjin) Chemical Reagents Co., Ltd. N,N-Dimethylhexadecan-1-amine (97%) was obtained from Shanghai Macklin Biochemical Co., Ltd. Acetone (AR, 99.5%) and anhydrous ethyl ether (AR, 99.5%) were bought from Beijing Tongguang Fine Chemicals Company. Deionized water was employed for all experiments.2.2. Preparation and modification of silica nanoparticles
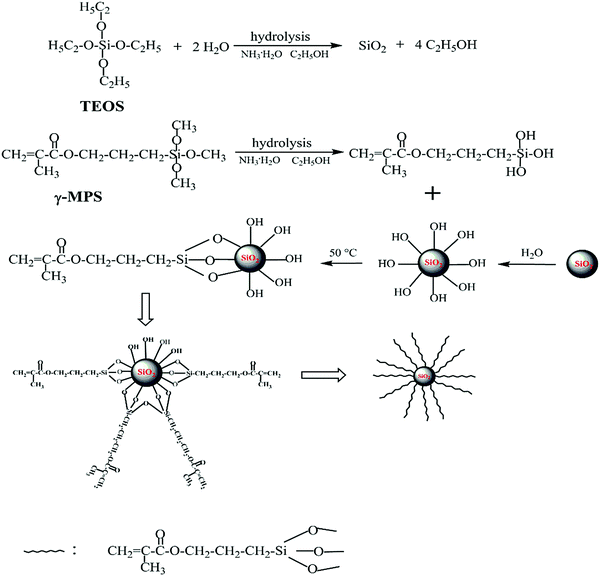
In the present work, silica nanoparticles were prepared according to the synthesis procedures previously reported by Stöber.39 Firstly, the mixture containing absolute ethanol, ammonia solution and deionized water was prepared. And then ethyl silicate (TEOS) was added. After the reaction was performed with gentle stirring for 24 h at room temperature, the resulting product was separated from the mixture by centrifugation (9000 rpm). Then it was washed three times with absolute ethanol and dried in a vacuum oven at 70 °C for 24 h. The prepared nanosilica was dispersed in the mixture of absolute ethanol and deionized water by ultrasonication in a three-neck flask. Subsequently, 3-methacryloxypropyltrimethoxysilane (γ-MPS) and a few drops of ammonia solution were introduced. The molar ratio between γ-MPS and silica was 1![[thin space (1/6-em)]](https://www.rsc.org/images/entities/char_2009.gif) :
:![[thin space (1/6-em)]](https://www.rsc.org/images/entities/char_2009.gif) 18. After the reaction was carried out with continuous stirring at 50 °C for 24 h in a N2 atmosphere, reduced pressure distillation was used to remove the excess ethanol. Then the mixture was centrifuged (10
18. After the reaction was carried out with continuous stirring at 50 °C for 24 h in a N2 atmosphere, reduced pressure distillation was used to remove the excess ethanol. Then the mixture was centrifuged (10![[thin space (1/6-em)]](https://www.rsc.org/images/entities/char_2009.gif) 000 rpm). The modified nanosilica was rinsed three times with absolute ethanol. Finally, the product was dried in a vacuum oven at 50 °C for 24 h. The route of preparation and modification of nanosilica is shown in Fig. 1.
000 rpm). The modified nanosilica was rinsed three times with absolute ethanol. Finally, the product was dried in a vacuum oven at 50 °C for 24 h. The route of preparation and modification of nanosilica is shown in Fig. 1.
2.3. Synthesis of dimethylhexadeylallylammonium bromide (DMHAAB)
Dimethylhexadecyl amine was added into a desired amount of ethyl acetate. Then the mixture was poured into a 500 mL three-neck round flask equipped with a reflux condenser, a thermometer and a mechanical stirrer. After allyl bromide was slowly dropped into the flask, the reaction was conducted with continuous stirring for 12 h at 50 °C. The molar ratio of dimethylhexadecyl amine and allyl bromide was 1.0![[thin space (1/6-em)]](https://www.rsc.org/images/entities/char_2009.gif) :
:![[thin space (1/6-em)]](https://www.rsc.org/images/entities/char_2009.gif) 1.2. Reduced pressure distillation was used to remove the excess solvent. Then the primary product was purified using a significant amount of acetone and anhydrous diethyl ether. Finally, the target product was dried in a vacuum oven at 50 °C for 24 h. Fig. 2 shows the synthetic process of DMHAAB.
1.2. Reduced pressure distillation was used to remove the excess solvent. Then the primary product was purified using a significant amount of acetone and anhydrous diethyl ether. Finally, the target product was dried in a vacuum oven at 50 °C for 24 h. Fig. 2 shows the synthetic process of DMHAAB.
2.4. Preparation of nanocomposite (PASD-SiO2)
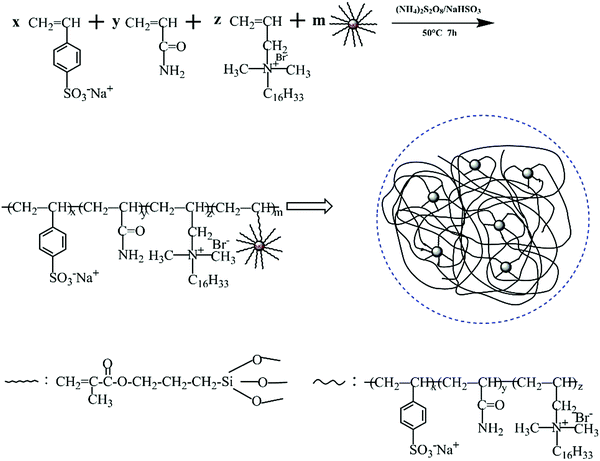
The desired product was prepared by redox free radical copolymerization. The mass ratio of AM, SSS and DMHAAB was 100![[thin space (1/6-em)]](https://www.rsc.org/images/entities/char_2009.gif) :
:![[thin space (1/6-em)]](https://www.rsc.org/images/entities/char_2009.gif) 25.3
25.3![[thin space (1/6-em)]](https://www.rsc.org/images/entities/char_2009.gif) :
:![[thin space (1/6-em)]](https://www.rsc.org/images/entities/char_2009.gif) 1.5. The concentration of monomers was 25%. Firstly, AM, SSS and DMHAAB were placed into a 250 mL breaker. Then the mixture was completely dissolved in deionized water under continuous stirring for 0.5 h. Various fractions of modified nanosilica were added into the reaction solution. In order to sufficiently disperse modified nanosilica in the solution, it was stirred with a magnetic stirrer for another 2 h at a speed of 300 rpm at room temperature. The pH value of the solution was adjusted to 8–9 by the addition of the NaOH solution. The initiators (APS and NaHSO3, molar ration 1
1.5. The concentration of monomers was 25%. Firstly, AM, SSS and DMHAAB were placed into a 250 mL breaker. Then the mixture was completely dissolved in deionized water under continuous stirring for 0.5 h. Various fractions of modified nanosilica were added into the reaction solution. In order to sufficiently disperse modified nanosilica in the solution, it was stirred with a magnetic stirrer for another 2 h at a speed of 300 rpm at room temperature. The pH value of the solution was adjusted to 8–9 by the addition of the NaOH solution. The initiators (APS and NaHSO3, molar ration 1![[thin space (1/6-em)]](https://www.rsc.org/images/entities/char_2009.gif) :
:![[thin space (1/6-em)]](https://www.rsc.org/images/entities/char_2009.gif) 1, 0.25 wt%) were added into the mixed solution. After the reaction was carried out at 50 °C for 7 h under a N2 atmosphere, a colloidal copolymer was acquired and rinsed with excess ethyl alcohol several times. Finally, the polymer was dried under vacuum conditions at 70 °C for 24 h. Fig. 3 illustrates the polymerization process.
1, 0.25 wt%) were added into the mixed solution. After the reaction was carried out at 50 °C for 7 h under a N2 atmosphere, a colloidal copolymer was acquired and rinsed with excess ethyl alcohol several times. Finally, the polymer was dried under vacuum conditions at 70 °C for 24 h. Fig. 3 illustrates the polymerization process.
2.5. Materials characterization
The FT-IR spectra of pre-dried original SiO2, modified nanosilica, DMHAAB, PASD and PASD-SiO2 were obtained using the Bruker ENSON II spectrophotometer (Bruker, Germany) in the range of 4000–400 cm−1 with a resolution of 4 cm−1 at room temperature. Element analysis was conducted using an energy dispersive spectrometer (Model 550i, IXRF Systems, America). A Bruker Ascend™ 400WB spectrometer with the cross-polarization magic angle spinning (CP/MAS) was employed to obtain the solid stated 13C-NMR spectra. The scanning time was 4 h with a 7 kHz spinning rate at room temperature. The suppression of sidebands was acquired by using TOSS pulse sequences during the data collection. The thermal gravimetric analysis (TGA) was performed using a NETZSCH (STA409PC, Germany) in the temperature range of 30–800 °C under a constant N2 flow rate of 140 cm3 min−1 at a heating rate of 10.0 °C min−1. The microstructures of the samples were studied using a scanning election microscope (SEM, Hitachi SU8010, Japan) at an accelerating voltage of 5 kV. The morphologies of nanosilica and PASD-SiO2 were acquired using a transmission electron microscope (TEM, FEI F20, Japan) at an accelerating voltage of 200 kV. The particle size distribution of nanosilica was investigated through a dynamic light scattering spectrophotometer (DLS, Zetasizer Nano ZS, Malvern, UK). Prior to the measurement of the morphology and particle size, the modified nanosilica was ultrasonically dispersed in absolute ethanol for 1.5 h at room temperature.2.6. Intrinsic viscosity
The intrinsic viscosity of the polymeric solution in 1.00 mol L−1 NaCl aqueous solution was determined using an Ubbelohde capillary viscometer (inside diameter, 0.57 mm) at 30.0 ± 0.1 °C. After 10 mL of the solution was poured into the viscometer, the flow time at five different concentrations was recorded using a chronometer (TF-C300, China). After the dilution of the copolymer solution in the viscometer, it was extremely essential to homogenize by shaking. Each concentration was measured three times repeatedly. The difference between each time was no more than 0.2 s. The molecular weight and intrinsic viscosity of the copolymer were determined using eqn (1)–(4), respectively. | (1) |
 | (2) |
 | (3) |
 | (4) |
2.7. Solution property measurements
Temperature-tolerance measurements were carried out in the range of 25–100 °C using a Brookfield DV–III + Pro Viscometer at a concentration of 6000 mg L−1 at 20 rpm. Salt-resistance tests were conducted in a series of different salinity solutions with a concentration of 6000 mg L−1 at 25 °C at 20 rpm. The shear-tolerance analysis was carried out under steady shear using a HAAKE-RS600 rheometer at a concentration of 5 g L−1 at 25 °C in the range of 0.1 to 1000 s−1. The measurements of the viscoelastic performance were performed using a HAAKE-RS600 rheometer with oscillatory frequency from 0.1 to 10.00 Hz within the linear viscoelastic region at 25 °C.2.8. Drag reduction behavior
The experiments of drag reduction were performed in a closed loop flow system at room temperature. This system contained a stainless steel tube with a length of 3 m and an inner diameter of 8 mm. The test solutions were pumped into the pipeline from the tank by a screw pump (measuring range of 0–5 m3 h−1), where the different flow rates were acquired by adjusting the pump speed. Firstly, clean water was pumped in order to clean the pipeline and obtain the pressure difference between the inlet and the outlet of the test section. Then polymer solution was used as the working fluid and prepared in a tank. A pressure transducer (ranging from 0 to 5 MPa) and a flow meter (over a range of 0–100 L min−1) were used to determine the pressure drop and the flow rate of the test section, respectively. All data were recorded in a stable state. The percentage of drag reduction was evaluated by comparing the friction factors between the clean water and the working fluid under the same experimental conditions. The drag reduction ratio of each polymer solution was calculated as follows.The experimental friction factor f was calculated based on the following equation:40
 | (5) |
 | (6) |
 | (7) |
3. Results and discussion
3.1. FT-IR analysis
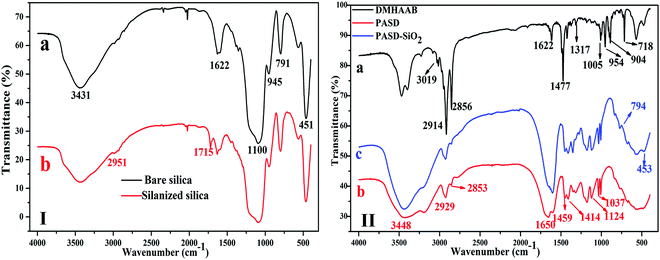
Fig. 4(I) shows the FTIR spectrum of original and modified silica. As seen from Fig. 4(I)(a), the characteristic absorption peaks at 3431 cm−1 and 1622 cm−1 were attributed to –OH on the surface of SiO2. The strong bands at 1100 cm−1 and 451 cm−1 were assigned to the stretching vibrations and bending vibrations of Si–O–Si, respectively.43 The band at 791 cm−1 was due to the Si–O stretching vibrations. Fig. 4(I)(b) shows the FTIR spectra of modified silica. The weak peak at 2951 cm−1 was attributed to the C–H stretching vibration of –CH3 and –CH2– in γ-MPS. The characteristic band at 1715 cm−1 arose from the stretching vibrations of C![[double bond, length as m-dash]](https://www.rsc.org/images/entities/char_e001.gif) O in γ-MPS. Compared with bare silica, the appearance of new characteristic bands indicate that the modified silica has been successfully prepared.
O in γ-MPS. Compared with bare silica, the appearance of new characteristic bands indicate that the modified silica has been successfully prepared.
 | ||
| Fig. 4 (I) FT-IR spectrum of bare and silanized silica, (II) FT-IR spectra of (a) DMHAAB, (b) PASD and (c) PASD-SiO2. | ||
In the FT-IR spectra of DMHAAB (Fig. 4(II)(a)), the absorption peak at 3019 cm−1 was related to the stretching vibrations of C–H in –CH![[double bond, length as m-dash]](https://www.rsc.org/images/entities/char_e001.gif) CH2. The strong bands at 2914 cm−1 and 2856 cm−1 were assigned to the stretching vibrations of C–H in –CH3 and –CH2–, respectively. The characteristic peaks at 1622 cm−1 and 1477 cm−1 were attributed to the telescopic vibrations of C
CH2. The strong bands at 2914 cm−1 and 2856 cm−1 were assigned to the stretching vibrations of C–H in –CH3 and –CH2–, respectively. The characteristic peaks at 1622 cm−1 and 1477 cm−1 were attributed to the telescopic vibrations of C![[double bond, length as m-dash]](https://www.rsc.org/images/entities/char_e001.gif) C and the scissor vibrations of C–H in the –CH2– group, respectively. The bending vibration peak of –CH3 was found at 1317 cm−1. The typical peak at 1005 cm−1 was representative of C–N stretching vibrations. The bending vibrations of terminal C–H in
C and the scissor vibrations of C–H in the –CH2– group, respectively. The bending vibration peak of –CH3 was found at 1317 cm−1. The typical peak at 1005 cm−1 was representative of C–N stretching vibrations. The bending vibrations of terminal C–H in ![[double bond, length as m-dash]](https://www.rsc.org/images/entities/char_e001.gif) CH2 were found at 954 cm−1 and 904 cm−1. The sharp absorption signal at 718 cm−1 was attributed to the rocking vibrations of methylene in the hydrophobic chain. Therefore, it was concluded that the aimed product (DMHAAB) has been successfully synthesized.
CH2 were found at 954 cm−1 and 904 cm−1. The sharp absorption signal at 718 cm−1 was attributed to the rocking vibrations of methylene in the hydrophobic chain. Therefore, it was concluded that the aimed product (DMHAAB) has been successfully synthesized.
In Fig. 4(II)(b), the absorption band at 3448 cm−1 was relative to the stretching vibrations of the N–H bond in AM. The strong characteristic peak at 1650 cm−1 was attributed to the symmetric stretching vibrations of C![[double bond, length as m-dash]](https://www.rsc.org/images/entities/char_e001.gif) O in AM. The typical bands at 2929 cm−1 and 2853 cm−1 were relative to the stretching vibrations of C–H in –CH2– and –CH3 of the long-chain alkyl chain and the copolymer backbone, respectively. The bending vibration peak at 1459 cm−1 was assigned to the double methyl groups bonded with N+ in DMHAAB. The band due to the benzene ring stretching vibrations in SSS was found at 1414 cm−1. The absorption peaks at 1124 cm−1 and 1037 cm−1 were due to the antisymmetric and symmetric vibrations of the S
O in AM. The typical bands at 2929 cm−1 and 2853 cm−1 were relative to the stretching vibrations of C–H in –CH2– and –CH3 of the long-chain alkyl chain and the copolymer backbone, respectively. The bending vibration peak at 1459 cm−1 was assigned to the double methyl groups bonded with N+ in DMHAAB. The band due to the benzene ring stretching vibrations in SSS was found at 1414 cm−1. The absorption peaks at 1124 cm−1 and 1037 cm−1 were due to the antisymmetric and symmetric vibrations of the S![[double bond, length as m-dash]](https://www.rsc.org/images/entities/char_e001.gif) O bond of the –SO3− group, respectively. In addition, the characteristic peak of Si–O–Si ranging from 1000 cm−1 to 1200 cm−1 overlapped with the peak of S
O bond of the –SO3− group, respectively. In addition, the characteristic peak of Si–O–Si ranging from 1000 cm−1 to 1200 cm−1 overlapped with the peak of S![[double bond, length as m-dash]](https://www.rsc.org/images/entities/char_e001.gif) O, so it was difficult to distinguish. The new bands in the FT-IR spectrum of PASD-SiO2 (Fig. 4(II)(c)) were attributed to the symmetrical stretching vibrations and bending vibrations of Si–O–Si at 794 cm−1 and 453 cm−1, respectively. Thus, it was concluded that the silica has been successfully bonded into the polymer.
O, so it was difficult to distinguish. The new bands in the FT-IR spectrum of PASD-SiO2 (Fig. 4(II)(c)) were attributed to the symmetrical stretching vibrations and bending vibrations of Si–O–Si at 794 cm−1 and 453 cm−1, respectively. Thus, it was concluded that the silica has been successfully bonded into the polymer.
3.2. 13C NMR analysis
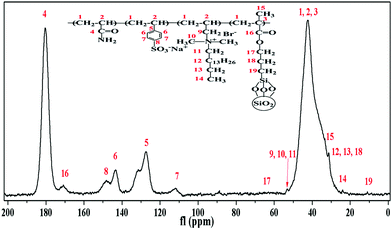
The liquid state sample with D2O as a solvent exhibited a poor mobility in the experimental tube, so a solid state 13C NMR analysis was performed. The 13C-NMR spectrum of PASD-3%SiO2 is shown in Fig. 5. The strong peak at 42.21 ppm (1, 2, 3) was attributed to the main carbon backbone. The two peaks at 180.34 ppm (4) and 170.66 ppm (16) were attributed to the C![[double bond, length as m-dash]](https://www.rsc.org/images/entities/char_e001.gif) O carbon in AM and silanized silica, respectively. The chemical shifts at 127.42 ppm (5), 111.51 ppm (7), 143.27 ppm (6) and 148.35 ppm (8) depicted the carbon atoms of the benzene, respectively. The signals at 31.25 ppm (12, 13, 18) and 24.08 ppm (14) were attributed to the carbons of –CH2– and –CH3, respectively. The peaks of carbons of +N–CH2 and +N–CH3 were found at 51.81–54.84 ppm (9, 10, 11). The weak resonance peaks at 33.35 ppm (15) and 11.13 ppm (19) were attributed to the carbons of –CH3 and –CH2–Si– in modified silica. The signal peak of the carbon in –O–CH2– (17) was too weak to distinguish easily at 60–70 ppm. As a consequence, the 13C-NMR spectrum further demonstrated that the desired product was successfully prepared and was in well accordance with the FT-IR spectrum.
O carbon in AM and silanized silica, respectively. The chemical shifts at 127.42 ppm (5), 111.51 ppm (7), 143.27 ppm (6) and 148.35 ppm (8) depicted the carbon atoms of the benzene, respectively. The signals at 31.25 ppm (12, 13, 18) and 24.08 ppm (14) were attributed to the carbons of –CH2– and –CH3, respectively. The peaks of carbons of +N–CH2 and +N–CH3 were found at 51.81–54.84 ppm (9, 10, 11). The weak resonance peaks at 33.35 ppm (15) and 11.13 ppm (19) were attributed to the carbons of –CH3 and –CH2–Si– in modified silica. The signal peak of the carbon in –O–CH2– (17) was too weak to distinguish easily at 60–70 ppm. As a consequence, the 13C-NMR spectrum further demonstrated that the desired product was successfully prepared and was in well accordance with the FT-IR spectrum.
3.3. Morphology, DLS measurement and elemental analysis
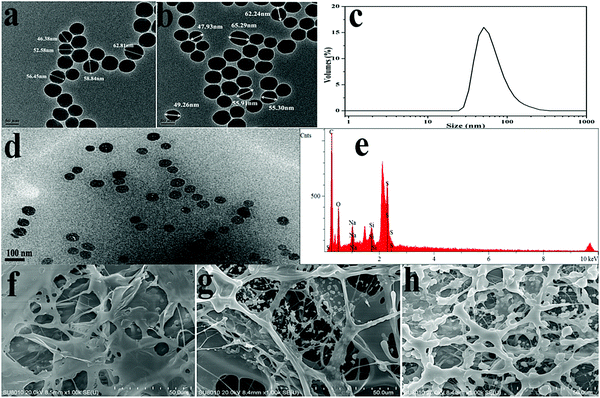
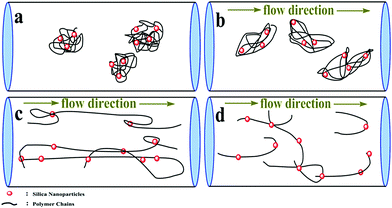
Insights into the morphology, microstructure and particle size distribution were provided by TEM analysis, SEM analysis and DLS measurements. Fig. 6(a) shows the TEM image of pure silica with a diameter range of 46–63 nm. As shown in Fig. 6(b), the surface-modified silica with a diameter of around 56 nm exhibited a regular arrangement and spherical morphology. Fig. 6(c) shows a relatively narrow particle size distribution. According to the strong peak observed at 50.18 nm, the modified SiO2 showed an average particle size of approximately 86.26 nm. The size obtained from DLS was slightly bigger than TEM results, which was attributed to the thin absorption layer of solvent molecules and the extension of surface molecules in the solvent. Fig. 6(d) displayed the dispersion of silica nanoparticles in the polymer matrix without heavy aggregation, which indicated that the compatibility between the polymeric matrix and silica nanoparticles was improved. Elemental analysis was used to obtain the chemical composition information of the composite. As seen from Fig. 6(e), the occurrence of the peak of silicon further confirmed that the modified silica was successfully polymerized into the aimed product. Fig. 6(f)–(h) shows the SEM images of PASD and PASD-SiO2. Although all copolymers displayed the similar network structures, the density of the connected skeletons increased with the addition of nanosilica. Nanosilica acted as joints among copolymer chains, leading to the appearance of denser network structures with the increase of silica nanoparticles.It was well accepted that the good affinity between nanoparticles and polymer matrix was a precondition for achieving good performance.44,45 As shown in Fig. 7, we could infer that the PASD-SiO2 exhibited behavior reinforcement. The phenomenon might be explained as follows. Firstly, the mobility of polymer chains around silica nanoparticles (the shade in Fig. 7) in the solution was restricted mainly due to the steric hindrance of the silica nanoparticles. This behavior resulted in the enhancement of network stability. Moreover, silica nanoparticles acted as crosslinkers by overlapping or attracting several molecule chains. Simultaneously, it was likely that each polymer chain was absorbed by different silica nanoparticles. This bridge interaction led to the formation of the complex macromolecule network. Therefore, the structure strength was enhanced. Additionally, the presence of hydrogen bonds between the silica nanoparticles and the polymer matrix constrained the local rotation and movement of polymer chains, leading to the stronger spatial network.46 Consequently, these synergistic effects greatly enhanced the nanocomposite performances.
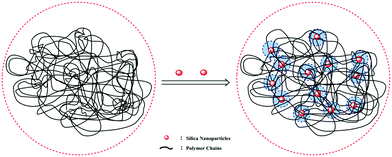 | ||
| Fig. 7 Schematic illustration of the interactions between the silica nanoparticles and the polymer matrix. | ||
3.4. Thermal analysis
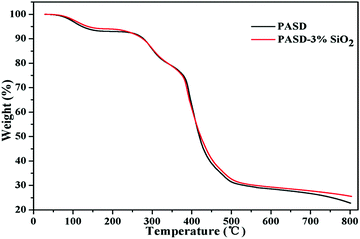
Fig. 8 presents the results of thermal gravimetric analysis of PASD and the PASD-3%SiO2 nanocomposite. The TGA curves of the pure copolymer and the nanocomposite show three stages of weight loss. In the first stage, the gentle weight reduction was attributed to the evaporation of physically adsorbed intramolecular or intermolecular moisture in the range of 30–250 °C. The second degradation step occurred in the range from 250 °C to 510 °C. Rapid drops in weight were resulted from the thermal decomposition of amide groups and hydrophobic branch chains. In the last stage, both TGA curves showed an invisible decrease above 510 °C, which was attributed to the combustion of the degraded components. Compared with the weight reduction of the neat polymer, the nanocomposite retarded the thermal degradation of polymeric molecules, especially under high temperature conditions. This phenomenon might be explained as follows. First of all, the incorporation of silica into the polymer matrix restrained the polymer chain mobility at high temperature and delayed the decomposition of volatile groups to some degree.20 Moreover, the introduction of organically modified silica retarded the decomposition of the polymer matrix and increased the degradation temperature by sharing thermal energy during the high temperature test.473.5. Intrinsic viscosity
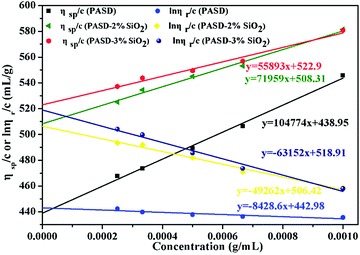
The intrinsic viscosity [η] was a good indication of the hydrodynamic diameter of the macromolecular coil in the aqueous solution. As displayed in Fig. 9, the intrinsic viscosity was obtained by plotting the curve of the reduced viscosity (ηsp/c and ln![[thin space (1/6-em)]](https://www.rsc.org/images/entities/char_2009.gif) ηr/c) as a function of the polymer concentration, extrapolating to zero, and taking the intercept value. The results in this experiment were 440.97 mL g−1, 507.37 mL g−1 and 520.91 mL g−1, respectively. Based on eqn (1)–(4), the viscosity-average molecular weight of PASD, PASD-2%SiO2 and PASD-3%SiO2 was calculated to be 1.62 × 10⁶ g mol−1, 1.93 × 10⁶ g mol−1 and 1.99 × 10⁶ g mol−1, respectively.
ηr/c) as a function of the polymer concentration, extrapolating to zero, and taking the intercept value. The results in this experiment were 440.97 mL g−1, 507.37 mL g−1 and 520.91 mL g−1, respectively. Based on eqn (1)–(4), the viscosity-average molecular weight of PASD, PASD-2%SiO2 and PASD-3%SiO2 was calculated to be 1.62 × 10⁶ g mol−1, 1.93 × 10⁶ g mol−1 and 1.99 × 10⁶ g mol−1, respectively.
3.6. Salinity tolerance
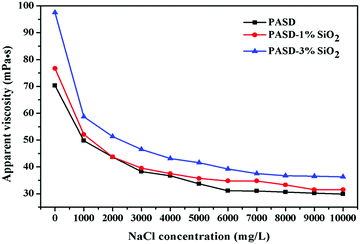
The flowback water was usually recycled to prepare fracturing fluids in many areas. However, the flowback water was often of high salinity, which had negative effects on the performance. Fig. 10 shows the effect of salinity on viscosity. The apparent viscosity of the pure polymer solution steeply decreased with the increase of the NaCl concentration. Then the apparent viscosity seemed independent as the NaCl concentration increased. A similar behavior for PASD-1%SiO2 and PASD-3%SiO2 was observed with respect to the NaCl concentration in the whole test range. The apparent viscosity increased with the addition of silica loadings. In the absence of salt, the hydrogen bonds formed between water and polymer chains. Moreover, the electrostatic interactions took place among charged ions. However, the presence of salts reinforced the solution polarity, leading to the weakness of hydrogen bonds. The contribution of electrostatic repulsion towards apparent viscosity gradually decreased. These changes caused the curl of molecular chains. However, the nanocomposite solution presented a higher viscosity under the same experimental conditions compared to that of the neat polymer solution. This phenomenon might be ascribed to the incorporation of silica nanoparticles. As inorganic nanoparticles, silica nanoparticles were insensitive to the presence of Na+ and provided a steric hindrance against the suppressive effect on electric double layers. These contributions led to a bigger hydrodynamic volume. Therefore, the PASD-SiO2 presented better salt-tolerance than the PASD.3.7. Temperature resistance
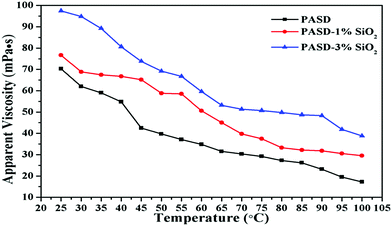
Thermal exchange would take place when the fracturing fluid was injected into the target interval, probably resulting in an unsatisfactory performance of the working fluid under high temperature conditions.48Fig. 11 shows the effect of temperature on viscosity. The apparent viscosity of all samples tended to decrease with the temperature increasing from 25 °C to 100 °C. The adhesion between different macromolecule chains became weak with the increase of temperature. And then the movement of polymer chains became drastic, which led to the decrease of the apparent viscosity. However, it was worthwhile noting that the samples with silica nanoparticles exhibited higher viscosity than those without nanosilica. The apparent viscosity tended to increase with the continuous increase of nanosilica loadings. This behavior was attributed to the following reasons. Firstly, the great spatial hindrance from nanosilica restricted the movement of polymer chains, which improved the chain rigidity (as exhibited in Fig. 7). Moreover, the appearance of strong bonds between Si–O and C–Si alleviated the degradation of polymer chains in comparison with PASD.11 Additionally, the disassociation of nanoparticle–polymer interactions would consume more energy in comparison with PASD. Taken together, the synergism provided an excellent temperature resistance for PASD-SiO2.3.8. Shear stability
The polymers usually suffered from mechanical degradation in turbulent pipe flow, which restricted the amount of drag reduction that could be achieved. The viscosity curves are displayed in Fig. 12. All samples showed a shear thinning behavior with the increase of the shear rate. After an initially steep decrease in viscosity, the viscosity seemed to retain the mild decrease with the increment of the shear rate. For the pure polymer, under static conditions molecular chains stretched at random and the interactions among different polymer chains would occur. However, the conformation of molecular chains changed into an orientation with external shear action. Accompanying the increasing shear rate, the interactions between different chains would be disrupted. Besides, the mechanical degradation of the polymer chains also took place. As a result, the apparent viscosity evidently dropped. At a high shear rate, the further degradation for macromolecule segments became difficult, exhibiting an inconspicuous decrease with respect to the shear rate.7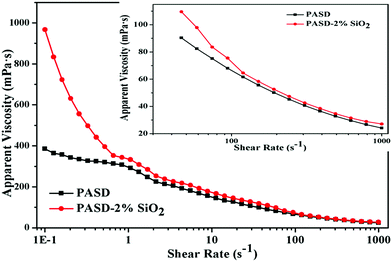 | ||
| Fig. 12 Effect of the shear rate on apparent viscosity of PASD and PASD-2%SiO2. Inset showed the apparent viscosity at a high shear rate. | ||
However, it was worthwhile noting that due to the presence of silica nanoparticles, the apparent viscosity was higher than that of the neat polymer solution. On the one hand, the presence of silica nanoparticles improved the polymeric stability. On the other hand, the interaction between the silica nanoparticles and the polymer through forming a crosslinked structure enhanced the strength of the macromolecular network. Therefore, under these joint actions, the nanocomposite displayed higher viscosity than that of the pure polymer. However, as displayed in the inset of Fig. 12, under high shear rate conditions the difference in apparent viscosity was very less, which implied that the shear resistance should be further improved.
3.9. Viscoelastic behavior
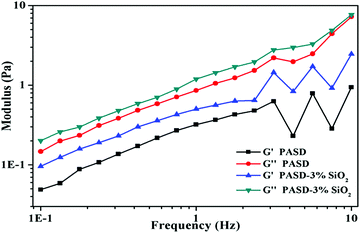
Polymeric viscoelasticity had a significant effect on drag reduction, which was confirmed by many researchers.49,50 As a consequence, excellent drag reduction effectiveness usually resulted from the good viscoelasticity. Fig. 13 shows the storage moduli (G′) and loss moduli (G′′) as a function of frequency in this experiment. For PASD, both G′ and G′′ increased with the elevation of frequency. The curves of PASD-SiO2 followed a similar trend to that of the pure polymer. However, both G′ and G′′ further increased with the increase of the silica nanoparticles. As seen from Fig. 13, G′ was less than G′′ over the whole frequency region, indicating that the viscous behavior was dominant. A few papers also reported the identical findings for the similar polymer system containing modified silica.11 However, the polymer containing silica nanoparticles exhibited higher G′ and G′′ in the same frequency. This phenomenon might be attributed to the presence of the strong interactions between nanosilica and the hosting polymer matrix. The well-dispersed nanosilica adsorbed with the polymeric matrix and cross-linked more molecular chains.51,52 Due to more effective junction points, the network structure was strengthened, facilitating the enhancement of the polymer viscoelastic behavior.3.10. Drag reduction
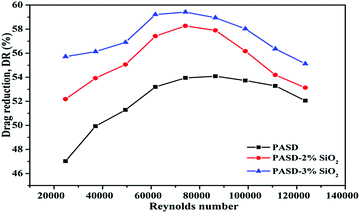
Fig. 14 displays the experimental results that were obtained at a concentration of 300 ppm. The drag reduction performance initially increased when the Reynolds number (Re) increased from 25![[thin space (1/6-em)]](https://www.rsc.org/images/entities/char_2009.gif) 000 to 60
000 to 60![[thin space (1/6-em)]](https://www.rsc.org/images/entities/char_2009.gif) 000, then leveled off in the range of 60
000, then leveled off in the range of 60![[thin space (1/6-em)]](https://www.rsc.org/images/entities/char_2009.gif) 000–98
000–98![[thin space (1/6-em)]](https://www.rsc.org/images/entities/char_2009.gif) 000, and slightly decreased ranging from 98
000, and slightly decreased ranging from 98![[thin space (1/6-em)]](https://www.rsc.org/images/entities/char_2009.gif) 000 to 123
000 to 123![[thin space (1/6-em)]](https://www.rsc.org/images/entities/char_2009.gif) 000. It was observed that the maximum drag reduction was 59.2% for PASD-3%SiO2 and 54.0% for PASD, respectively. When the working fluid began to flow, the polymer conformation varied from the coil to extension under external flow (as shown in Fig. 15(a) and (b)), leading to a strong suppression of the formation and further development of vortices. Therefore, the percentage of drag reduction steeply increased. With the increase of Reynolds number, the molecular chains reached perfect extension and the confinement of turbulence vortices became more effective, which corresponded to the optimum drag reduction region (as presented in Fig. 15(c)). Accompanying the further increase of the Reynolds number, the effect of shear action gradually became prominent. However, the restraint effect of the polymer chains was still dominant. The drag reduction efficiency remained stable in the specified region. When the flow rate and the circulation time continuously increased, the shear action gradually predominated (as displayed in Fig. 15(d)). Nevertheless, the mechanical degradation had a negative influence on the drag reduction performance. At a high Reynolds number, the drag reduction ratio decreased slightly.
000. It was observed that the maximum drag reduction was 59.2% for PASD-3%SiO2 and 54.0% for PASD, respectively. When the working fluid began to flow, the polymer conformation varied from the coil to extension under external flow (as shown in Fig. 15(a) and (b)), leading to a strong suppression of the formation and further development of vortices. Therefore, the percentage of drag reduction steeply increased. With the increase of Reynolds number, the molecular chains reached perfect extension and the confinement of turbulence vortices became more effective, which corresponded to the optimum drag reduction region (as presented in Fig. 15(c)). Accompanying the further increase of the Reynolds number, the effect of shear action gradually became prominent. However, the restraint effect of the polymer chains was still dominant. The drag reduction efficiency remained stable in the specified region. When the flow rate and the circulation time continuously increased, the shear action gradually predominated (as displayed in Fig. 15(d)). Nevertheless, the mechanical degradation had a negative influence on the drag reduction performance. At a high Reynolds number, the drag reduction ratio decreased slightly.
As seen from Fig. 14, although both the neat polymer and nanocomposite had a similar propensity, there were a few differences. It could be seen that the maximum drag reduction ratios of the nanocomposites were higher than those of the pure polymer under identical experiment conditions. It could also be observed that the high drag reduction regions were maintained for a wider range of Reynolds number. This phenomenon could be ascribed to the reinforced interactions between the polymer matrix and the silica nanoparticles. When the nanosilica was introduced, nanosilica provided more bridge nodes and reinforced the strength of the spatial network. In addition, the presence of well dispersed silica nanoparticles in the polymer matrix improved the rigidity of the chain structure. The synergism enhanced the resistance to the shear action and hindrance to vortices. The larger the addition amount of nanosilica, the more crosslink and the stronger structure produced in the solution. As a consequence, the excellent drag reduction behavior was maintained stable for a wider range. Meanwhile, the enhanced structure reduced the effect of molecular degradation on the drag reduction ratio.
4. Conclusions
In this paper, a novel nanocomposite drag reducer was prepared using AM, SSS, DMAAB and surface-modified nanosilica via free radical copolymerization. The silica nanoparticles had a relatively uniform dispersion and a spherical morphology. DLS measurement presented an average particle size of about 86.26 nm. FTIR and NMR analyses confirmed that the desired product was successfully prepared. TEM analysis indicated that silica nanoparticles dispersed uniformly into the polymer matrix. SEM showed that the presence of silica nanoparticles strengthened the network structure. Thermogravimetric analysis demonstrated that the incorporation of silica nanoparticles enhanced the thermal stability under high temperature conditions. The solution properties were investigated under various conditions. Compared with the pure polymer, the experimental results indicated that the nanocomposite solutions exhibited higher apparent viscosity under the same conditions. In other words, the polymer/silica nanocomposite exhibited better performances of temperature tolerance, salt resistance and shear tolerance. In addition, the apparent viscosity increased with the increase of nanosilica loadings. The dynamic rheology test indicated that both storage moduli and loss moduli of the nanocomposites obviously increased. The improvement of the rheological properties was beneficial to achieve an excellent drag reduction behavior. The drag reduction performance was investigated in a closed loop flow system. It was found that the maximum drag reduction efficiency for the new polymer/silica drag reducer was 59.2%. Compared with the neat polymer, the drag reduction efficiency was enhanced by 9.7%. With the increase of the flow time and shear action, drag reduction effectiveness slightly decreased. On the one hand, the incorporation of silica nanoparticles strengthened the network structures, so the degradation of drag reducer molecules was effectively delayed. On the other hand, the dispersion of silica nanoparticles in the polymer matrix enhanced the rigidity of the molecular chains. This structure showed strong stability under turbulent flow conditions and protected flexible chains, so that it was more effective and persistent to suppress the development of vortices under turbulent flow. This polymer/silica drag reducer combined the advantages of the inorganic fillers and the organic polymers. The proposed nanocomposite also showed more advantages in terms of high temperature, high salinity and high displacement conditions. Thus, it provided a reference for the development of drag reducers.Conflicts of interest
The authors declare no conflict of interests.Acknowledgements
This work was financially supported by the National Natural Science Foundation of China (Grant No. 51974339 and 51674270), National Major Project (Grant No. 2017ZX05009-003), Major project of the National Natural Science Foundation of China (Grant No. 51490650), and the Foundation for Innovative Research Groups of the National Natural Science Foundation of China (Grant No. 51821092 and 51521063).References
- A. Vengosh, R. B. Jackson, N. Warner, T. H. Darrah and A. Kondash, Environ. Sci. Technol., 2014, 48, 8334–8348 CrossRef CAS PubMed.
- L. Wang, B. Yao, M. Cha, N. B. Alqahtani and T. W. Patterson, J. Nat. Gas Sci. Eng., 2016, 35, 160–174 CrossRef CAS.
- T. C. Nguyen, B. Romero, E. Vinson and H. Wiggins, J. Pet. Sci. Eng., 2018, 163, 590–599 CrossRef CAS.
- A. F. Ibrahim, H. A. Nasr-El-Din, A. Rabie, G. Lin, J. Zhou and Q. Qu, SPE Low Perm Symposium, Denver, Colorado, USA, 2016 Search PubMed.
- S. Tong and K. K. Mohanty, Fuel, 2016, 181, 463–477 CrossRef CAS.
- Y. Sun, Q. Wu, M. Wei, B. Bai and Y. Ma, Fuel, 2014, 131, 28–35 CrossRef CAS.
- L. G. Reis, I. P. Oliveira, R. V. Pires and E. F. Lucas, Colloids Surf., A, 2016, 502, 121–129 CrossRef CAS.
- R. O. Afolabi, Am. J. Polym. Sci., 2015, 5, 41–46 CAS.
- D. B. Levitt and G. A. Pope, SPE/DOE improved oil recovery symposium, Tulsa, Oklahoma, USA, 2008 Search PubMed.
- C. Peng, S. Gou, Q. Wu, L. Zhou, H. Zhang and Y. Fei, New J. Chem., 2019, 43, 5363–5373 RSC.
- N. K. Maurya, P. Kushwaha and A. Mandal, J. Taiwan Inst. Chem. Eng., 2017, 70, 319–330 CrossRef CAS.
- L. Xue, U. S. Agarwal and P. J. Lemstra, Macromolecules, 2005, 38, 8825–8832 CrossRef CAS.
- Z. Liu, F. Zhou, H. Qu, Z. Yang and Y. Zou, Geofluids, 2017, 1–8 Search PubMed.
- L. Wang, D. Wang, Y. Shen, X. Lai and X. Guo, J. Polym. Res., 2016, 23, 1–8 CrossRef CAS.
- H. ShamsiJazeyi, C. A. Miller, M. S. Wong, J. M. Tour and R. Verduzco, J. Appl. Polym. Sci., 2014, 40576, 1–13 Search PubMed.
- A. N. T. Tiong, P. Kumar and A. Saptoro, Korean J. Chem. Eng., 2015, 32, 1455–1476 CrossRef CAS.
- R. C. S. da Luz, M. V. G. Paixão and R. D. C. Balaban, J. Mol. Liq., 2019, 279, 279–288 CrossRef CAS.
- H. Jang, Y. C. Supartono and J. Lee, Korean J. Chem. Eng., 2015, 32, 390–396 CrossRef CAS.
- M. Zhao, W. Lv, Y. Li, C. Dai, X. Wang, H. Zhou, C. Zou, M. Gao, Y. Zhang and Y. Wu, J. Mol. Liq., 2018, 261, 373–378 CrossRef CAS.
- M. L. Saladino, T. E. Motaung, A. S. Luyt, A. Spinella, G. Nasillo and E. Caponetti, Polym. Degrad. Stab., 2012, 97, 452–459 CrossRef.
- H. Zou, S. Wu and J. Shen, Chem. Rev., 2008, 108, 3893–3957 CrossRef CAS PubMed.
- J. Yang, J. Zhao, C. Han and J. Duan, Compos. Sci. Technol., 2014, 95, 1–7 CrossRef CAS.
- X. Ma, N. Lee, H. Oh, J. Kim, C. Rhee, K. Park and S. Kim, Colloids Surf., A, 2010, 358, 172–176 CrossRef CAS.
- J. Zhang, Z. Guo, X. Zhi and H. Tang, Colloids Surf., A, 2013, 418, 174–179 CrossRef CAS.
- C. Bartholome, E. Beyoua, E. Bourgeat-Lamib, P. Cassagnaua, P. Chaumonta, L. Davida and N. Zydowicza, Polymer, 2005, 46, 9965–9973 CrossRef CAS.
- E. O. Akindoyo and H. A. Abdulbari, Aust. J. Basic Appl. Sci., 2015, 9, 1–9 Search PubMed.
- A. N. El-hoshoudy, S. E. M. Desouky, M. Y. Elkady, A. M. Alsabagh, M. A. Betiha and S. Mahmoud, Int. J. Polym. Sci., 2015, 1–14 CAS.
- Z. Ye, X. Qin, N. Lai, Q. Peng, X. Li and C. Li, J. Chem. Educ., 2013, 1–10 Search PubMed.
- C. Zareie, A. R. Bahramian, M. V. Sefti and M. B. Salehi, J. Mol. Liq., 2019, 278, 512–520 CrossRef CAS.
- D. Zhu, L. Wei, B. Wang and Y. Feng, Energies, 2014, 7, 3858–3871 CrossRef.
- J. Ji, C. Zeng and Y. Ke, J. Appl. Polym. Sci., 2017, 45502, 1–11 Search PubMed.
- M. Salami-Kalajahi, V. Haddadi-Asl, S. Rahimi-Razin, F. Behboodi-Sadabad, M. Najafi and H. Roghani-Mamaqani, J. Polym. Res., 2012, 19, 9793 CrossRef.
- G. Liu, H. Zhang, X. Yang and Y. Wang, Polymer, 2007, 48, 5896–5904 CrossRef CAS.
- E. Amerio, P. Fabbri, G. Malucelli, M. Messori, M. Sangermano and R. Taurino, Prog. Org. Coat., 2008, 62, 129–133 CrossRef CAS.
- H. Zou, S. Wu and J. Shen, Chem. Rev., 2008, 108, 3893–3957 CrossRef CAS PubMed.
- F. Zhang, J. Kang and C. Yu, J. Polym. Res., 2011, 18, 615–620 CrossRef CAS.
- G. M. Nisola, A. B. Beltran, D. M. Sim, D. Lee, B. Jung and W. J. Chung, J. Polym. Res., 2011, 18, 2415–2424 CrossRef CAS.
- D. W. Lee and B. R. Yoo, J. Ind. Eng. Chem., 2016, 38, 1–12 CrossRef CAS.
- W. Stöber and A. Fink, J. Colloid Interface Sci., 1968, 26, 1–8 CrossRef.
- M. Eshrati, T. Al-Wahaibi, A. R. Al-Hashmi, Y. Al-Wahaibi, A. Al-Ajmi and A. Abubakar, Exp. Therm. Fluid Sci., 2017, 83, 169–176 CrossRef CAS.
- W. R. dos Santos, E. S. Caser, E. J. Soares and R. N. Siqueira, J. Non-Newtonian Fluid Mech., 2020, 276, 104223 CrossRef CAS.
- E. J. Soares, J. Non-Newtonian Fluid Mech., 2020, 276, 104225 CrossRef CAS.
- Y. Kwon, H. Im and J. Kim, Sep. Purif. Technol., 2011, 78, 281–289 CrossRef CAS.
- S. Pavlidou and C. D. Papaspyrides, Prog. Polym. Sci., 2008, 33, 1119–1198 CrossRef CAS.
- J. Tan and A. K. Cheetham, Chem. Soc. Rev., 2011, 40, 1059–1080 RSC.
- J. Yang, C. Han, J. Duan, F. Xu and R. Sun, J. Phys. Chem. C, 2013, 117, 8223–8230 CrossRef CAS.
- L. Unnikrishnan, S. Mohanty and S. K. Nayak, High Perform. Polym., 2013, 25, 854–867 CrossRef.
- H. Jang, W. Lee and J. Lee, Colloids Surf., A, 2018, 554, 261–271 CrossRef CAS.
- A. Zacharatos and E. Kontou, J. Appl. Polym. Sci., 2015, 42141, 1–5 Search PubMed.
- M. C. Boyce and E. M. Arruda, Polym. Eng. Sci., 1990, 30, 1288–1298 CrossRef CAS.
- P. Xiang, K. Petrie, M. Kontopoulou, Z. Ye and R. Subramanian, Polym. Chem., 2013, 4, 1381–1395 RSC.
- M. Bailly, M. Kontopoulou and K. E. Mabrouk, Polymer, 2010, 51, 5506–5515 CrossRef CAS.
| This journal is © The Royal Society of Chemistry and the Centre National de la Recherche Scientifique 2020 |

