 Open Access Article
Novel nitrogen doped carbon dots enhancing the anticorrosive performance of waterborne epoxy coatings†
Juan
Wang‡
ab,
Peng
Du‡
 a,
Haichao
Zhao
 *a,
Jibin
Pu
 *a and
Chengbing
Yu
b
aKey Laboratory of Marine Materials and Related Technologies, Zhejiang Key Laboratory of Marine Materials and Protective Technologies, Ningbo Institute of Materials Technology and Engineering, Chinese Academy of Sciences, Ningbo 315201, China. E-mail: zhaohaichao@nimte.ac.cn; pujibin@nimte.ac.cn
bSchool of Materials Science and Engineering, Shanghai University, Shanghai 200444, China
First published on 9th July 2019
Abstract
There are lots of research studies reporting the excellent performances of waterborne epoxy resin coatings to reduce environmental VOC levels. However, it has also been manifested that waterborne epoxy resin coatings do not have high corrosion resistance because of being hydrophilic. Herein, we utilized a kind of N doped carbon dot (N-CD) which has high ethanol solubility and low cytotoxicity to enhance the corrosion resistance of waterborne epoxy resin coatings as a nanofiller. The N-CDs were obtained through a solvothermal method by using 4-aminosalicylic acid (ASA) as a precursor. The diameter and height of N-CDs confirmed by scanning probe microscopy and transmission electron microscopy are 3–5 nm. Corrosion resistance performance of the coatings without and with N-CDs is investigated by electrochemical impedance spectroscopy by immersing them in 3.5 wt% NaCl (aq) for 70 days. The results indicate that the composite coatings with 0.5 wt% N-CDs show superior anticorrosive performance due to bond interactions between N-CDs and polymer chains, the defect repairing effect of N-CDs and the formation of compact Fe2O3 and Fe3O4 passivation layers.
1. Introduction
The lifetime of metals is limited by the degradation of the surface morphology and structure.1 The damage caused by metal corrosion is extremely serious, which not only wastes a lot of money but also is unsafe.2,3 So it is necessary to prolong the usage time of metal materials.4 Among all protective measures, coating protection due to its low cost, simple technology and significant performance has become the most effective and most widely used methods. Anti-corrosion coating can be applied to a metal surface to isolate it from the corrosive medium and oxygen.5,6 As a result, coatings should have good electrical insulation capability, water impermeability and strong adhesion to the surface of the metal.7 Furthermore, imparting self-repairing ability is an effective way to prolong the life of materials. Therefore, the development of facile methods to prepare anti-corrosive coatings which are safe, eco-friendly, non-toxic and self-healing is highly desirable.8–11Water-based epoxy resin, a stable dispersion system in which an epoxy resin is dispersed in the form of small particles or droplets in a continuous phase of water, has many advantages over solvent-borne epoxy coatings.12,13 First, it exhibits strong adaptability and high adhesion to many metal substrates; second, it meets the demands of environmental protection due to the low content of organic solvents or volatile organic compounds. Last but not least, it ensures high crosslinking density.14–16 So it is safe enough during storage or transportation which greatly improves its use. However, it should be noted that an epoxy coating only acts as a barrier in metal protection. It is key to prepare a composite coating with a barrier effect and other functions such as self-healing and corrosion inhibition.
Recently, carbon dots (CDs), a kind of carbon-based fluorescent (FL) nanomaterial with low cytotoxicity, significant water solubility and superior corrosion inhibition properties, have attracted ever-increasing attention.17,18 Song et al. demonstrated a facile synthesis of N-doped carbon dots (N-CDs) for cell imaging and Fe3+ detection.19 Zhao's group reported water soluble carbon dots as an effective corrosion inhibitor for carbon steel.20 Besides, Zhu et al. applied carbon dots as nanofillers to endow healing properties in bulk polymers and described their anticorrosion properties.21 Now, the inhibiting effect of CDs is worthy of paying attention to in the field of metal protection. First, many hydrophilic functional groups such as carboxyl groups on the surface of CDs make them significantly soluble in water.22 Therefore, they have good compatibility in waterborne epoxy coatings which can effectively fill the defects caused by the process of solvent evaporation.23 Second, CDs with amino groups as a type of adsorbent film corrosion inhibitor can be adsorbed by the surface charge of the metal and form a monomolecular film throughout the anode and cathode regions.20 Thence, they prevent the corresponding electrochemical reaction and protect the metal surface from severe corrosion. Furthermore, the C![[double bond, length as m-dash]](https://www.rsc.org/images/entities/char_e001.gif) O–NH covalent bond formed between CDs and polymer chains, the hydrogen bond formed between functional groups and the van der Waals forces of CDs21 enhance the flexibility and self-healing ability of the resin structure.
O–NH covalent bond formed between CDs and polymer chains, the hydrogen bond formed between functional groups and the van der Waals forces of CDs21 enhance the flexibility and self-healing ability of the resin structure.
Herein, a simple, versatile, and cost-effective methodology is reported for initiating interfacial bonding in bulk polymers: the introduction of carbon dots (CDs) into a polymer matrix forming a composite coating. To explore prospective applications, we further evaluated the morphology, chemical structure and crystal configuration of the N-CDs. The anti-corrosion performance is studied by electrochemical impedance spectroscopy (EIS) in 3.5 wt% NaCl aqueous solution. Besides, the corrosion products are investigated by scanning electron microscopy (SEM) and energy dispersive spectroscopy (EDS) to reflect the anti-corrosion mechanism. These results prove that N-CD nanocomposite coatings have a significant corrosion protective performance on carbon steel.
2. Experimental section
2.1 Materials
4-Aminosalicylic acid (ASA) and ethanol were purchased from Aladdin Industrial Corporation. Epoxy resin (E-51) and waterborne curing agents were provided by Sichuan Honglizhan Chemical Co., Ltd. Deionized (DI) water was used during the whole experiment. Q235 carbon steel (10 mm × 10 mm × 10 mm) was used as the corrosion testing substrate. Before testing, carbon steel was polished with 500 and 1500 SiC sand papers to gain smooth surfaces, then washed with ethanol and DI water via ultrasonic vibration several times, and finally dried in a vacuum environment.2.2 Synthesis of N-CDs
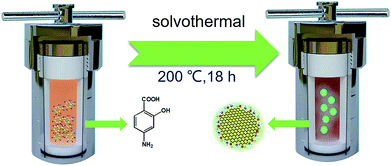
N-CDs were obtained using a similar method reported by Song et al.19 ASA (0.6 g) was first dissolved in 60 mL of ethanol with stirring, and then moved into polytetrafluoroethylene autoclaves and kept at 200 °C for 18 h in an oven. Then dark brown solutions were obtained after cooling down to room temperature. In order to remove nonreactive molecules, dialysis bags (molecular weight cut-off ∼ 3.0 kDa) were used to purify the prepared solution for one day. DI water should be changed every 3 h, and finally N-CDs were obtained as a black solid after rotary evaporation and drying under vacuum and have better solubility in ethanol.2.3 Preparation of N-CDs–EP composite coatings
A certain amount of N-CD powder was completely dissolved in 10 mL of ethanol with ultrasonication, and then a pre-calculated amount of the waterborne curing agent was added to the above solution and carefully mechanically stirred for 30 min. After removing ethanol by rotary evaporation, a stoichiometric amount of E51 epoxy (the mass ratio between E51 epoxy and waterborne curing agents was at 2![[thin space (1/6-em)]](https://www.rsc.org/images/entities/char_2009.gif) :
:![[thin space (1/6-em)]](https://www.rsc.org/images/entities/char_2009.gif) 3, Table S1†) was added to the polymer matrix. After removing trapped air bubbles through degassing in a vacuum oven, the mixture was mechanically stirred vigorously with a high speed blender for 5 min. Finally, the mixture was coated on the Q235 steel surface with a wire bar coater and cured at room temperature (25 °C) for 48 h to obtain N-CDs–EP composite coatings with a thickness of 50 μm. Besides, pure EP coatings were prepared for comparison by the same procedure without N-CD nanoparticles as mentioned above. These samples were named pure EP, 0.5% N-CDs–EP, 1.0% N-CDs–EP and 2.0% N-CDs–EP according to the content of N-CDs.
3, Table S1†) was added to the polymer matrix. After removing trapped air bubbles through degassing in a vacuum oven, the mixture was mechanically stirred vigorously with a high speed blender for 5 min. Finally, the mixture was coated on the Q235 steel surface with a wire bar coater and cured at room temperature (25 °C) for 48 h to obtain N-CDs–EP composite coatings with a thickness of 50 μm. Besides, pure EP coatings were prepared for comparison by the same procedure without N-CD nanoparticles as mentioned above. These samples were named pure EP, 0.5% N-CDs–EP, 1.0% N-CDs–EP and 2.0% N-CDs–EP according to the content of N-CDs.
2.4 Characterization
The microstructure and morphology of N-CDs were characterized by transmission electron microscopy (TEM, FEI Tecnai F20) and scanning probe microscopy (SPM, Vecco Dimension 3100). Fourier transform infrared spectrometry (FTIR, THERMO Nicolet 6700), X-ray diffraction (XRD, BRUKER D8 ADVANCE), UV-vis absorption spectroscopy (Perkin-Elmer Lambda 950), Raman spectroscopy (Renishaw inVia Reflex) and X-ray photoelectron spectroscopy (XPS, Axis Ultra DLD) were used to confirm the chemical composition and structure of N-CDs. The coating matrix was investigated by scanning electron microscopy (SEM, Hitachi S4800) and differential scanning calorimetry (DSC, DSC 214). Electrochemical impedance spectroscopy (EIS) was performed on a CHI660E electrochemical station in 3.5 wt% NaCl solution using a three-electrode system, where, the test samples were used as the working electrode, a Pt plate was used as the counter electrode and the saturated calomel electrode (SCE) was used as the reference electrode, respectively. The corrosion potential (Ecorr) of the Q235 steel specimens was obtained from the open circuit potential in the balance state of the system. The EIS plots were plotted in the frequency range of 105 to 0.01 Hz and the sinusoidal voltage signal amplitude was 20 mV. The final corrosion parameters from the EIS data were fitted with ZsimpWin software. The surface morphology and chemical composition of the substrates after 70 days of immersion in 3.5 wt% NaCl solution were obtained with scanning electron microscopy (SEM, FEI Quanta FEG 250), energy dispersive spectroscopy (EDS) and X-ray diffraction (XRD).3. Results and discussion
3.1 Materials properties
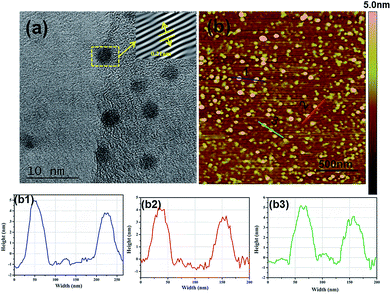
As shown in Fig. 2a, N-CDs have an average diameter of about 3 nm with a uniform spherical structure. In addition, the high-resolution TEM image of N-CDs provides the highly crystalline structure with well-resolved lattice fringes with a (100) interplanar lattice spacing of 0.21 nm, corresponding to the (001) plane of graphite in N-CDs.18 SPM can measure the height of N-CDs, as revealed in Fig. 2b, and the height of N-CDs is approximately 3–5 nm which is similar to the results in Fig. 2a.
![[double bond, length as m-dash]](https://www.rsc.org/images/entities/char_e001.gif) O, and N–H stretching vibrations, respectively. The peaks centered at 1448 cm−1 and 1293 cm−1 are attributed to the C–N and C–O bonds. The peak at 818 cm−1 is assigned to the bending vibration of the C–H bond belonging to the benzene ring.19 As expected, N-CDs have the same functional group as ASA and therefore show unreacted O–H and N–H groups at around 3380 cm−1 and C–O stretching and C–H bonds of the benzene ring at 1239 cm−1 and 838 cm−1, respectively. However, we also found that the peak at 1617 cm−1 corresponds to NH2 deformation vibrations and that at 1508 cm−1 denotes C
O, and N–H stretching vibrations, respectively. The peaks centered at 1448 cm−1 and 1293 cm−1 are attributed to the C–N and C–O bonds. The peak at 818 cm−1 is assigned to the bending vibration of the C–H bond belonging to the benzene ring.19 As expected, N-CDs have the same functional group as ASA and therefore show unreacted O–H and N–H groups at around 3380 cm−1 and C–O stretching and C–H bonds of the benzene ring at 1239 cm−1 and 838 cm−1, respectively. However, we also found that the peak at 1617 cm−1 corresponds to NH2 deformation vibrations and that at 1508 cm−1 denotes C![[double bond, length as m-dash]](https://www.rsc.org/images/entities/char_e001.gif) C vibrations which are the unique functional groups of N-CDs due to the carbonization reaction.25 The N-CDs were characterized via wide-angle X-ray scattering analysis, as shown in Fig. 3b. A broad peak centered at 2θ = 24° in the XRD spectra indicated that they had an amorphous carbon structure due to the introduction of nitrogen and oxygen. The interlayer spacing of N-CDs was 0.370 nm, broader than that of graphite (0.34 nm).26 This is consistent with the results of TEM. UV-vis spectroscopy was applied to detect the optical properties of the N-CDs. As shown in Fig. 3c, the UV-vis absorption spectra of the sample shows an absorbance at 280 nm and 370 nm due to the π → π* and n → π* transitions of certain sub-fluorophores included in the CDs (e.g. –NH2 and C–N
C vibrations which are the unique functional groups of N-CDs due to the carbonization reaction.25 The N-CDs were characterized via wide-angle X-ray scattering analysis, as shown in Fig. 3b. A broad peak centered at 2θ = 24° in the XRD spectra indicated that they had an amorphous carbon structure due to the introduction of nitrogen and oxygen. The interlayer spacing of N-CDs was 0.370 nm, broader than that of graphite (0.34 nm).26 This is consistent with the results of TEM. UV-vis spectroscopy was applied to detect the optical properties of the N-CDs. As shown in Fig. 3c, the UV-vis absorption spectra of the sample shows an absorbance at 280 nm and 370 nm due to the π → π* and n → π* transitions of certain sub-fluorophores included in the CDs (e.g. –NH2 and C–N![[double bond, length as m-dash]](https://www.rsc.org/images/entities/char_e001.gif) C), respectively.27,28 In addition, the N-CDs emit green light under 365 nm UV excitation which has strong fluorescence as shown in the inset in Fig. 3c. The high fluorescence may also disturb Raman characterization. The Raman spectra of N-CDs showed a G band at 1590 cm−1 and a D band at 1350 cm−1.29 In general, the D band represents the low-carbon lattice structure (defect degree) of the carbon materials, and the G band is the light level band of sp2 hybridized carbon atoms, which was not obvious in Fig. 3d. This phenomenon (more pronounced D-band) may be due to the strong photoluminescence interference under the visible near-infrared wavelength excitation.
C), respectively.27,28 In addition, the N-CDs emit green light under 365 nm UV excitation which has strong fluorescence as shown in the inset in Fig. 3c. The high fluorescence may also disturb Raman characterization. The Raman spectra of N-CDs showed a G band at 1590 cm−1 and a D band at 1350 cm−1.29 In general, the D band represents the low-carbon lattice structure (defect degree) of the carbon materials, and the G band is the light level band of sp2 hybridized carbon atoms, which was not obvious in Fig. 3d. This phenomenon (more pronounced D-band) may be due to the strong photoluminescence interference under the visible near-infrared wavelength excitation.
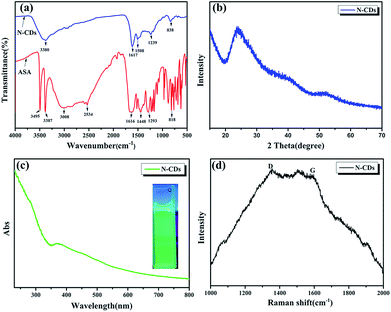 | ||
| Fig. 3 (a) Fourier transform infrared (FTIR) spectra, (b) XRD pattern of N-CDs, (c) UV-vis absorption spectra of N-CDs and (d) Raman spectrum. | ||
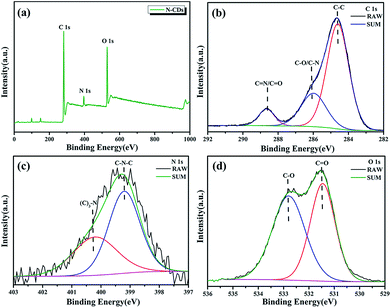
X-ray photoelectron spectroscopy (XPS) is used to analyze the chemical composition and structure of N-CDs. The full XPS spectra of N-CDs shown in Fig. 4a demonstrate that N-CDs are certainly composed of carbon, nitrogen and oxygen. The fine structure spectrum of C 1s (Fig. 4b) exhibits three chemically shifted peak components at 284.5, 285.6 and 288.2 eV attributed to C–C, C–O/C–N and C![[double bond, length as m-dash]](https://www.rsc.org/images/entities/char_e001.gif) N/C
N/C![[double bond, length as m-dash]](https://www.rsc.org/images/entities/char_e001.gif) O, respectively. Similarly, the two peaks in the fine structure spectrum of N 1s (Fig. 4c) are assigned to C–N–C (399.2 eV) and (C)3–N (400.2 eV), and the two peaks for O 1s are ascribed to two kinds of O atoms (C
O, respectively. Similarly, the two peaks in the fine structure spectrum of N 1s (Fig. 4c) are assigned to C–N–C (399.2 eV) and (C)3–N (400.2 eV), and the two peaks for O 1s are ascribed to two kinds of O atoms (C![[double bond, length as m-dash]](https://www.rsc.org/images/entities/char_e001.gif) O (531.5 eV) and C–O (532.8 eV)) (Fig. 4d).30
O (531.5 eV) and C–O (532.8 eV)) (Fig. 4d).30
3.2 Characterization of N-CDs–EP composite coatings
3.3 Anticorrosion properties of N-CDs–EP composite coatings
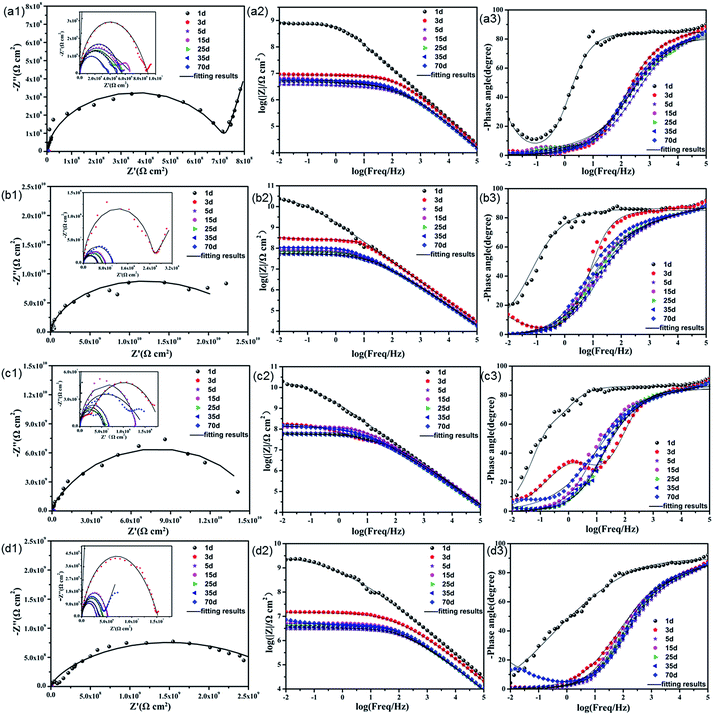 | ||
| Fig. 7 Nyquist and Bode plots of (a) pure EP; (b) 0.5% N-CDs–EP; (c) 1.0% N-CDs–EP; and (d) 2.0% N-CDs–EP coatings immersed in 3.5% NaCl solution during 70 days (solid lines indicate fitting data). | ||
In order to evaluate the corrosion protection properties of the various coating systems and judge the corrosion state, the EIS parameters were appropriately fitted with the electrical equivalent circuits using ZSimpwin software as shown in Fig. 8a and b. This process included two stages. Rs and Rc represent the solution resistance and coating resistance. Rct, Qc and Qdl stand for the charge transfer resistance, coating capacitance and double layer capacitance, respectively.40 The Warburg element (Zw) is used to reflect the diffusion in the coating.41 Due to the waterborne epoxy resin coatings absorbing water faster, the electrical equivalent circuit (Fig. 8a and b) was used to fit the electrochemical data for the sample where the corrosive medium had come into contact with the steel substrates. The fitted coating resistance (Rc) and charge transfer resistance of the double layer (Rct) for different coating systems during the 70 days of immersion in 3.5 wt% NaCl solution are shown in Fig. 8c and d. It was significant that the Rc and Rct values of pure EP gradually decreased (from 7.24 × 10⁶ to 1.67 × 10⁴ Ω cm2 for Rc and from 9.98 × 10⁷ to 3.48 × 10⁵ Ω cm2 for Rct) and the rate of decrease was fast due to the sustained water absorption. However, upon adding 0.5–1.0 wt% N-CDs, the nanocomposite coatings always maintained much higher values of Rc and Rct and showed a slight decrease during the whole immersion period.42 In addition, the Rc and Rct values of all the N-CDs–EP coating systems are one to three orders of magnitude much higher than those of the pure EP system. Therefore, we reach the following conclusion that embedding a moderate amount of N-CDs could decrease coating flaws and increase diffusion hindrance of aggressive species in the coating matrix. However, excessive addition of N-CDs (more than 1.0 wt%) will destroy the coating structure and then lead to decreased Rc values. It is noted that the Rc and Rct values of N-CDs–EP coatings show a slight increase at the end of the immersion period35 Because the N-CDs gradually filled up the defects of pure waterborne epoxy resin, the steel substrate was protected again in a short period.43
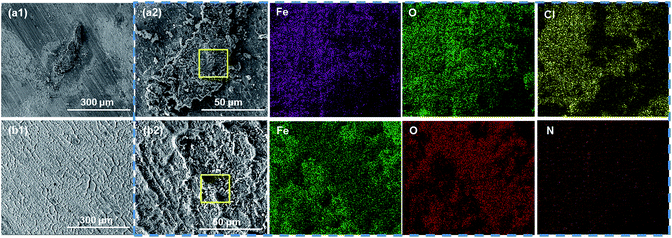 | ||
| Fig. 9 The SEM morphological images of corrosion products on the substrate coated with (a1 and a2) pure EP and (b1 and b2) 0.5% N-CDs–EP after 70 days of immersion. EDS is shown in the blue box. | ||
 | ||
| Fig. 10 The EDS spectra obtained from the areas shown in the yellow box in Fig. 9a2 and b2 are presented in (a) and (b) and (c) the XRD patterns of the surface of steel substrates coated with different coatings after 70 days of immersion in 3.5 wt% NaCl solution. | ||
4. Conclusion
To conclude, we synthesized N-CD nanoparticles having excellent solubility in ethanol by a hydrothermal method. The diameter and height of N-CDs were observed to be approximately 3–5 nm by scanning probe microscopy and transmission electron microscopy. The waterborne epoxy resin coatings containing 0.5 wt%, 1 wt%, and 2 wt% N-CD nanoparticles were favorably prepared by the curing reaction of aqueous amine curing agents, epoxy resin (E51), and N-CDs. The corrosion resistance performance of coatings without and with N-CDs on steel electrodes was studied by impedance measurements and fitting Rc and Rct by immersing them in 3.5 wt% NaCl solution. The composite coatings containing 0.5–1 wt% N-CDs showed better corrosion resistance performance for Q235 steel than the pure EP coating which is definitely discovered from a high phase angle at high frequency and low impedance modulus at 0.01 Hz (Zf=0.01 Hz) in EIS, and the formation of compact Fe2O3 and Fe3O4 passivation layers is also observed by analyzing the surface morphology and chemical composition of Q235. Meanwhile, the mechanism of N-CDs enhancing the corrosion resistance of waterborne epoxy resin coatings is discussed. Based on our research conclusions, we consider that N-CDs have great potential to improve the corrosion resistance of waterborne epoxy coatings due to the environmental requirements of low VOC.Conflicts of interest
There are no conflicts to declare.Acknowledgements
The authors gratefully acknowledged financial support provided by the Open Financial Grant from the Qingdao National Laboratory for Marine Science and Technology (QNLM2016ORP0409).Notes and references
- Z. Jia, P. Xiong, Y. Shi, W. Zhou, Y. Cheng, Y. Zheng, T. Xi and S. Wei, J. Mater. Chem. B, 2016, 4, 2498–2511 RSC.
- L. Hamadi, S. Mansouri, K. Oulmi and A. Kareche, Egypt. J. Pet., 2018, 27, 1157–1165 CrossRef.
- B. Jin, D.-B. Xiong, Z. Tan, G. Fan, Q. Guo, Y. Su, Z. Li and D. Zhang, Carbon, 2019, 142, 482–490 CrossRef CAS.
- A. Kabir, M. J. Dunlop, B. Acharya, R. Bissessur and M. Ahmed, Polymers, 2018, 10, 16 CrossRef.
- M. Li, N. Liu, J. Chen and Q. Li, J. Taiwan Inst. Chem. Eng., 2019, 95, 682–691 CrossRef CAS.
- F. Jiang, W. Zhao, Y. Wu, J. Dong, K. Zhou, G. Lu and J. Pu, Prog. Org. Coat., 2019, 127, 70–79 CrossRef CAS.
- Y.-T. Choi, S. B. Kim, S. J. Lee, G.-T. Kim, E.-H. Park and E.-S. Park, Composites, Part B, 2017, 114, 268–279 CrossRef CAS.
- S. Ataei, S. N. Khorasani and R. E. Neisiany, Prog. Org. Coat., 2019, 129, 77–95 CrossRef CAS.
- A. Weishaar, M. Carpenter, R. Loucks, A. Sakulich and A. M. Peterson, Constr. Build. Mater., 2018, 191, 125–135 CrossRef CAS.
- C. Zhang, H. Wang and Q. Zhou, Prog. Org. Coat., 2018, 125, 403–410 CrossRef CAS.
- S. Mandal, N. Pandey, S. Singh, A. Ranjanb and U. Ojha, Mater. Chem. Front., 2019, 3, 690–701 RSC.
- M. Shibata, N. Ishigami and A. Shibita, React. Funct. Polym., 2017, 118, 35–41 CrossRef CAS.
- S. He, W. Q. Liu, M. P. Yang, C. H. Liu, C. Jiang and Z. F. Wang, J. Appl. Polym. Sci., 2019, 136, 10 Search PubMed.
- L. Guo, L. Z. Jing, Y. Liu, B. J. Zou, S. C. Hua, J. P. Zhang, D. Y. Yu, S. C. Wang, S. R. Wang, L. D. Wang and J. X. Yang, Int. J. Electrochem. Sci., 2018, 13, 11867–11881 CrossRef CAS.
- M. Liu, S. Han, J. Pan and W. Ren, Constr. Build. Mater., 2018, 177, 72–82 CrossRef CAS.
- C. Hu, J. Zhao, Z. Leng, M. N. Partl and R. Li, Constr. Build. Mater., 2019, 197, 220–227 CrossRef CAS.
- J. Shen, Y. Zhu, X. Yang, J. Zong, J. Zhang and C. Li, New J. Chem., 2012, 36, 97–101 RSC.
- J. H. Shen, Y. H. Zhu, C. Chen, X. L. Yang and C. Z. Li, Chem. Commun., 2011, 47, 2580–2582 RSC.
- Y. Song, C. Z. Zhu, J. H. Song, H. Li, D. Du and Y. H. Lin, ACS Appl. Mater. Interfaces, 2017, 9, 7399–7405 CrossRef CAS PubMed.
- M. Cui, S. Ren, H. Zhao, L. Wang and Q. Xue, Appl. Surf. Sci., 2018, 443, 145–156 CrossRef CAS.
- C. Zhu, Y. Fu, C. Liu, Y. Liu, L. Hu, J. Liu, I. Bello, H. Li, N. Liu, S. Guo, H. Huang, Y. Lifshitz, S.-T. Lee and Z. Kang, Adv. Mater., 2017, 29, 1701399 CrossRef.
- H. Singh, J. S. Sidhu, D. K. Mahajan and N. Singh, Mater. Chem. Front., 2019, 3, 476–483 RSC.
- T. Monetta, A. Acquesta, A. Carangelo and F. Bellucci, J. Coat. Technol. Res., 2018, 15, 923–931 CrossRef CAS.
- W. Shang, T. Cai, Y. Zhang, D. Liu and S. Liu, Tribol. Int., 2018, 118, 373–380 CrossRef CAS.
- W. Shang, M. Ye, T. Cai, L. Zhao, Y. Zhang, D. Liu and S. Liu, J. Mol. Liq., 2018, 266, 65–74 CrossRef CAS.
- M. Ye, T. Cai, W. Shang, L. Zhao, Y. Zhang, D. Liu and S. Liu, Tribol. Int., 2018, 127, 557–567 CrossRef CAS.
- K. Jiang, Y. Wang, X. Gao, C. Cai and H. Lin, Angew. Chem., Int. Ed., 2018, 57, 6216–6220 CrossRef CAS.
- K. Jiang, Y. Wang, C. Cai and H. Lin, Adv. Mater., 2018, 30, 1800783 CrossRef.
- S. Zhu, Q. Meng, L. Wang, J. Zhang, Y. Song, H. Jin, K. Zhang, H. Sun, H. Wang and B. Yang, Angew. Chem., Int. Ed., 2013, 52, 3953–3957 CrossRef CAS.
- Y. Xu, M. Wu, Y. Liu, X.-Z. Feng, X.-B. Yin, X.-W. He and Y.-K. Zhang, Chem.–Eur. J., 2013, 19, 2276–2283 CrossRef CAS.
- C. Chen, S. Qiu, M. Cui, S. Qin, G. Yan, H. Zhao, L. Wang and Q. Xue, Carbon, 2017, 114, 356–366 CrossRef CAS.
- J. Macan, K. Paljar, B. Burmas, G. Spehar, M. Leskovac and A. Gajovic, J. Therm. Anal. Calorim., 2017, 127, 399–408 CrossRef CAS.
- S. L. Qin, M. J. Cui, Z. D. Dai, S. H. Qiu, H. C. Zhao, L. P. Wang and A. F. Zhang, Tribol. Lett., 2018, 66, 10 CrossRef.
- S. Qiu, W. Li, W. Zheng, H. Zhao and L. Wang, ACS Appl. Mater. Interfaces, 2017, 9, 34294–34304 CrossRef CAS.
- J.-H. Ding, H.-R. Zhao, Y. Zheng, X. Zhao and H.-B. Yu, Carbon, 2018, 138, 197–206 CrossRef CAS.
- P. Du, J. Wang, G. Liu, H. Zhao and L. Wang, Mater. Chem. Front., 2019, 3, 321–330 RSC.
- P. Du, S. Qiu, C. Liu, G. Liu, H. Zhao and L. Wang, New J. Chem., 2018, 42, 4201–4209 RSC.
- W. Sun, L. D. Wang, T. T. Wu, C. Dong and G. C. Liu, Mater. Lett., 2019, 240, 262–266 CrossRef CAS.
- T. Wang, L. Tan, C. Ding, M. Wang, J. Xu and J. Fu, J. Mater. Chem. A, 2017, 5, 1756–1768 RSC.
- H. Zhao, J. Ding and H. Yu, New J. Chem., 2018, 42, 14433–14443 RSC.
- J. Ding, O. u. Rahman, W. Peng, H. Dou and H. Yu, Appl. Surf. Sci., 2018, 427, 981–991 CrossRef CAS.
- S. K. Saha and P. Banerjee, Mater. Chem. Front., 2018, 2, 1674–1691 RSC.
- C. Chen, S. Qiu, S. Qin, G. Yan, H. Zhao and L. Wang, Int. J. Electrochem. Sci., 2017, 12, 3417–3431 CrossRef CAS.
- J. Ding, H. Zhao, D. Ji, B. Xu, X. Zhao, Z. Wang, D. Wang, Q. Zhou and H. Yu, J. Mater. Chem. A, 2019, 7, 2864–2874 RSC.
- S. H. Qiu, C. Chen, M. J. Cui, W. Li, H. C. Zhao and L. P. Wang, Appl. Surf. Sci., 2017, 407, 213–222 CrossRef CAS.
Footnotes |
| † Electronic supplementary information (ESI) available: See DOI: 10.1039/c9na00155g |
| ‡ These authors contributed equally to this work. |
| This journal is © The Royal Society of Chemistry 2019 |

