 Open Access Article
Unravelling the physisorption characteristics of H2S molecule on biaxially strained single-layer MoS2†
Seyed-Mohammad
Tabatabaei
 *a,
Mohammad-Javad
Farshchi-Heydari
 ab,
Mohsen
Asad
cd and
Morteza
Fathipour
 *a
*a
aSchool of Electrical and Computer Engineering, University College of Engineering, University of Tehran, Tehran 14395-515, Iran. E-mail: mfathi@ut.ac.ir; s.m.tabatabaei@ut.ac.ir
bDepartment of Mechanical Engineering, K. N. Toosi University of Technology, Tehran 15875-4416, Iran
cDepartment of Electrical and Computer Engineering, University of Waterloo, 200 University Avenue, Waterloo, Ontario, Canada N2L 3G1
dWaterloo Institute for Nanotechnology, University of Waterloo, 200 University Avenue, Waterloo, Ontario, Canada N2L 3G1
First published on 15th July 2019
Abstract
Sensing ultra-low levels of toxic chemicals such as H2S is crucial for many technological applications. In this report, employing density functional theory (DFT) calculations, we shed light on the underlying physical phenomena involved in the adsorption and sensing of the H2S molecule on both pristine and strained single-layer molybdenum disulfide (SL-MoS2) substrates. We demonstrate that the H2S molecule is physisorbed on SL-MoS2 for all values of strain, i.e. from −8% to +8%, with a modest electron transfer, ranging from 0.023e− to 0.062e−, from the molecule to the SL-MoS2. According to our calculations, the electron-donating behaviour of the H2S molecule is halved under compressive strains. Moreover, we calculate the optical properties upon H2S adsorption and reveal the electron energy loss (EEL) spectra for various concentrations of the H2S molecule which may serve as potential probes for detecting H2S molecules in prospective sensing applications based on SL-MoS2.
1 Introduction
The successful experimental isolation of graphene in 2004 marks a milestone in the research on two-dimensional (2D) materials.1 Since then, a multitude of 2D materials have riveted many researchers due to their broad functionalities and prospective applications.2–8 Transition metal dichalcogenides (TMDs) are a group of van der Waals 2D materials with strong in-plane bonding and weak out-of-plane interactions. In particular, single-layer molybdenum disulfide (SL-MoS2), a well-known member of the TMD family, which is composed of a molybdenum (Mo) layer sandwiched between two sulfur (S) layers, has shown several advantages over many other 2D materials, the most prominent one being its decent bandgap of 1.8 eV.9–13 The fascinating properties of SL-MoS2 have rendered this material a promising successor for conventional materials employed in the areas of field effect transistors, light detectors, and gas sensors.14–26Precise monitoring of the molecules in the gas phase is of great interest for various industrial and health purposes.27 Among the gases, common pollutants such as toxic gases like ammonia (NH3) or nitrogen oxide (NO2), released by vehicles and power plants, may cause severe environmental damage as well as serious health issues for civilians.28 Therefore, the need for gas sensors with the ability to quickly detect certain gases in very small concentrations has risen. For this purpose, 2D materials have been shown to be great candidates as they benefit from a high surface-to-volume ratio, low thermal conductivity, high electronic mobility, and unprecedented mechanical characteristics.29–35 In particular, SL-MoS2 has been proven to be a promising candidate for chemical sensing purposes.36 In this regard, Kim et al. demonstrated linear responses of sensing 1–100% concentrations of O2 on SL-MoS2 with extremely high accuracy.36 Furthermore, Li et al. fabricated a MoS2 field effect transistor to detect NO and observed a modulation of 80 percent in its current upon 80 ppm of NO gas flow.37 In another attempt, He et al. employed Pt nanoparticles in addition to a SL-MoS2 substrate to detect NO2.38
Hydrogen sulfide (H2S) is the second most lethal gas, after only carbon monoxide.39 H2S is released by agricultural, petrochemical, and waste water industries and therefore may put many workers at risk.40 Consequently, sensitive H2S sensors are vital for swift detection of infinitesimal quantities of this lethal molecule. There have been previous theoretical and experimental studies on the potential of 2D materials for H2S sensing.41–46 In this regard, Gao et al. synthesized porous nanosheets of ZnFe2O4 and successfully detected H2S down to 500 ppb at low working temperatures (85 °C) and reported a fast recovery time and good selectivity, reproducibility, and stability.47 In another attempt, Fu et al. fabricated a nanoscale heterostructure of SnO2/ZnO to improve selectivity, response time and long-term stability. They concluded that even at a working temperature of 100 °C, the sensor was capable of detecting gas molecules down to 10 ppb.48 These experimental findings verify the strong potential of reliable gas sensors based on 2D materials.
Strain is omnipresent in devices based on atomically thin 2D materials.49 In fact, there have been numerous studies to investigate the effect of strain on SL-MoS2.50–56 Accordingly, a large enough strain applied to SL-MoS2 can result in a semiconductor–metal transition. Besides, the effective mass of carriers is modified under strain and the direct bandgap is transformed to an indirect one. As can be seen, strain engineering of the material's characteristics is an attractive avenue from both scientific and technical perspectives. Hence, in order to realize high-performance SL-MoS2-based gas sensors, strain-induced mechanical and electronic variations must be investigated. In this regard, Sahoo et al. studied the adsorption of NO, NO2, NH3, CO, and CO2 on SL-MoS2 under biaxial strains ranging from −7% to +7% and demonstrated that the performance of SL-MoS2-based gas sensors can be significantly improved for NH3 sensing under strain.57 However, to the best of our knowledge, no previous study addresses the effect of biaxial strain on the adsorption of H2S on SL-MoS2-based substrates.
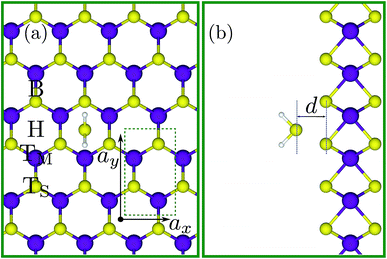
In this report, in order to obtain the fundamental physical guidelines for designing flexible SL-MoS2-based H2S gas sensors, the adsorption mechanism of this molecule on a 3 × 4 rectangular supercell of SL-MoS2 (see Fig. 1) is comprehensively investigated under biaxial strains ranging from −8% to +8%. Towards this goal, under each value of strain, the gas molecule is placed at 14 initial positions over the pristine SL-MoS2 sheet (see Fig. 1S in the ESI†) and the relevant electronic and optical characteristics are calculated for the most energetically favorable relaxed configuration. Moreover, we have investigated the role of gas concentration by considering up to four H2S molecules within the supercell of SL-MoS2.
2 Computational methods
DFT calculations are carried out using the Perdew–Burke–Ernzerhof (PBE) modification of the generalized gradient approximation as implemented in the SIESTA code.58–61 The valence electrons are described by norm-conserving Troullier–Martins pseudopotentials62 that were generated and tested according to the adopted functional. A double-ζ polarized (DZP) numerical atomic orbital basis set with a 25 meV confinement energy is used to expand the Kohn–Sham orbitals. All the structures are relaxed until the forces acting on atoms become smaller than 0.01 eV Å−1. To eliminate the interactions between supercell images, a vacuum spacing of 20 Å was adopted along the direction perpendicular to the substrate. In order to ensure a total energy convergence smaller than 0.01 meV per supercell in self-consistent iterations, a cutoff energy equal to 300 Ry is applied. The relaxed structure is obtained by using a two-dimensional Monkhorst–Pack Brillouin zone grid of 6 × 4 × 1 k-points. For optical and electronic structure calculations, the mesh is increased to 18 × 12 × 1. A broadening of 0.20 eV together with a sufficient number of unoccupied states above the Fermi energy level has been utilized for optical calculations.The imaginary part of the frequency-dependent dielectric function (ε2(ω)) for the relaxed configurations is obtained by a summation over the empty states:63
 | (1) |
The stability of the relaxed structures was investigated by calculating the binding energy (Eb) as follows:
| Eb = EMoS2+H2S − EMoS2 − EH2S | (2) |
3 Results and discussion
3.1 Electronic properties
To verify our adopted DFT approach, we first computed the electronic and structural characteristics of SL-MoS2 and compared them with previous results. A direct bandgap of 1.69 eV, an optimized Mo–S bond length of 2.44 Å, a layer thickness of 3.20 Å, and a net electronic charge of +0.238 (−0.119) for Mo (S) (calculated using the Hirshfeld charge population analysis framework64) are obtained. The achieved results are in excellent agreement with the corresponding values reported in previous studies56,65 which proves the precision and suitability of the PBE method for the current study.Next, a 3 × 4 rectangular supercell (see Fig. 1), composed of 24 Mo atoms and 48 S atoms, is adopted to study the adsorption characteristics of the H2S molecule on SL-MoS2 under no strain. A supercell of this size is sufficient to eliminate the spurious interactions between the H2S molecule and its periodic images in the calculations. To initialize the geometry relaxation process, the center of mass of the previously relaxed H2S molecule was placed above the basal plane of the supercell at four different adsorption sites at a vertical spacing of 4 Å from the top layer of S atoms in SL-MoS2. These four sites are on top of the center of the hollow hexagon, above the molybdenum atom, above the sulfur atom, and above the middle of the Mo–S bond, as shown in Fig. 1. In each of these four sites, the orientation of the H2S molecule is also changed, giving rise to 14 initial positions in total which are shown in ESI Fig. S1.†
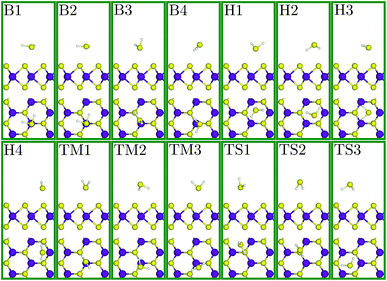
Fig. 2 depicts the relaxed structures for each of the 14 initial configurations above the SL-MoS2. The adsorption energy (Ea), equilibrium distance (d, defined as the vertical distance between the H2S molecule and the SL-MoS2 surface), and charge transfer (via employing the Hirshfeld method) are calculated for each of these relaxed adsorption states and tabulated in Table 1. According to this table, the least adsorption energy belongs to the H3 initial condition which is, therefore, the most stable condition. In contrast to its initial structure (H3), the H2S molecule's plane in the final structure is not parallel to the basal plane of SL-MoS2 any more. In addition, the sulfur atom in the H2S molecule is closer to the SL-MoS2 surface compared with the hydrogen atoms which gives rise to electron transfer from the molecule to the SL-MoS2.
| Initial configuration of H2S | E a (eV) | d (Å) |
|---|---|---|
| H1 | −0.478 | 2.56 |
| H2 | −0.430 | 2.25 |
| H3 | −0.494 | 2.75 |
| H4 | −0.450 | 2.97 |
| TM1 | −0.430 | 2.67 |
| TM2 | −0.437 | 2.24 |
| TM3 | −0.433 | 2.93 |
| TS1 | −0.206 | 3.19 |
| TS2 | −0.330 | 2.54 |
| TS3 | −0.476 | 2.38 |
| B1 | −0.480 | 2.78 |
| B2 | −0.488 | 2.78 |
| B3 | −0.439 | 2.68 |
| B4 | −0.470 | 2.38 |
In order to investigate the influence of mechanical deformations on the adsorption characteristics of the H2S molecule on SL-MoS2, both compressive and tensile strains are considered. In this regard, a range of biaxial strains from −8% to +8% with intervals of 2% is studied. Biaxial strain is exerted on the SL-MoS2 by increasing or decreasing the lattice constant according to the value of the applied strain. For each value of exerted strain, the aforementioned fourteen initial conditions (see ESI Fig. 1S†) are again considered and the calculations are carried out again to obtain the adsorption characteristics. The reason behind choosing the −8% to +8% strain range is based on the previous studies which state that the feasible limit of exerting biaxial strain on SL-MoS2 is 19%,66 beyond which the sheet is destroyed. Furthermore, at +10% tensile biaxial strain, the bandgap is closed and a semiconductor–metal transition occurs.66 On the other hand, for compressive biaxial strains, the bandgap is direct below 2% strain and becomes indirect for larger values. The bandgap increases as the compressive strain is applied and then monotonically decreases resulting a semiconductor–metal transition at −15%.56
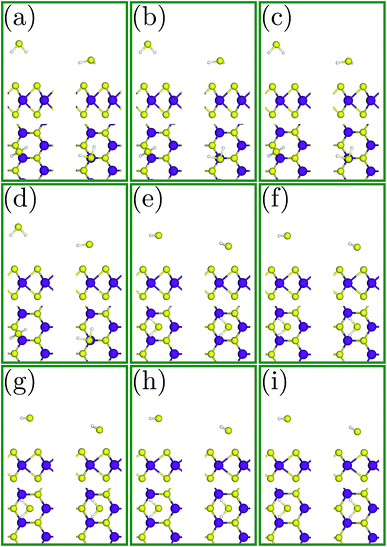
The most favourable adsorption condition for each value of biaxial strain is exhibited in Fig. 3. Similar to the unstrained SL-MoS2, the least adsorption energy under tensile strains arises from the H3 initial configuration, while the B2 initial condition results in the most favorable adsorption configuration for compressive strains. As the SL-MoS2 undergoes tensile strain, it is observed that the adsorption energy gradually decreases, indicating more stable adsorption (see Fig. 4). Also, as the substrate is stretched and therefore the surface charge densities are decreased, the gas molecule adsorption occurs relatively closer to the SL-MoS2. These reflect stronger interactions between the SL-MoS2 and H2S molecule under higher tensile strains. In contrast, exerting compressive strains increases the adsorption energy and distance and therefore results in weaker interaction between the substrate and the H2S molecule. From Fig. 4, it is established that both the adsorption energy and distance almost follow a similar trend. The obtained results are in excellent qualitative agreement with previous studies which investigate the influence of strain on the adsorption of various gases on SL-MoS2.57,67
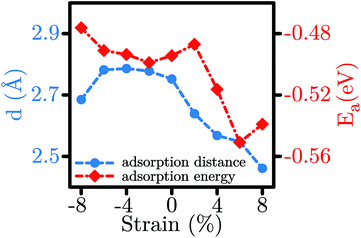 | ||
| Fig. 4 Modulation of the adsorption distance (d) and the adsorption energy (Ea) for the H2S molecule in the most stable configurations for each value of strain. | ||
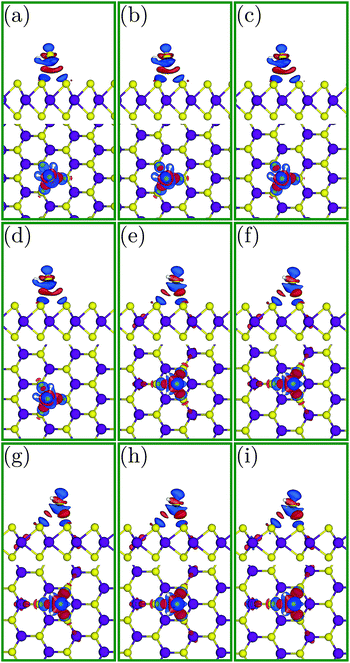
To further delve into the interactions between the H2S molecule and SL-MoS2, we have also calculated the charge density redistribution (Δρ) in the most stable adsorption configuration for each strain value, obtained using the following equation:
| Δρ = ρMoS2+H2S − ρMoS2 − ρH2S | (3) |
To better investigate the charge transfer phenomena, familiarity with the shape of the HOMO and LUMO is necessary. Fig. 5 depicts the HOMO and LUMO in the H2S molecule. The LUMO is located in the H2S molecule plane and is extended around the hydrogen atoms (Fig. 5(a) and (b)), whereas the HOMO is positioned perpendicular to this plane and (almost) only around the sulfur atom (Fig. 5(c) and (d)). Indeed, since the HOMO is full, it can only donate electrons, while the LUMO is vacant and can receive electrons.
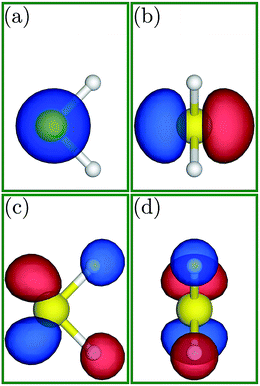 | ||
| Fig. 5 (a and c) Side and (b and d) front views of the HOMO and LUMO, respectively, for the H2S molecule. | ||
Fig. 6 shows the calculated Δρ profiles for the most stable adsorption configurations for each value of exerted strain. The blue (red) color represents loss of (gain of) electrons. As the blue color is dominant around the H2S molecule, the Hirshfeld method results, which state a positive charge on the H2S molecule, are validated. It is noteworthy that the red color in the adsorbed H2S molecule plane indicates charge transfer to the LUMO. However, this transfer is completely compensated by a stronger electronic charge transfer from the HOMO to the SL-MoS2, resulting in a net charge transfer from the molecule to the substrate. In fact, the presence of the blue color below and above the sulfur atom in the H2S molecule represents a loss of electrons from the HOMO, which leads to a positive charge on H2S.
According to our charge transfer calculations based on the Hirshfeld charge analysis method, under the most stable adsorption conditions of unstrained and compressed SL-MoS2, 0.06e−1 is transferred from the H2S molecule to the SL-MoS2 plane, whereas this amount is reduced to half, i.e. 0.03−1, under tensile strains. In order to comprehend the underlying reason for such a decrease in charge transfer, it is worth mentioning some points. First, the H2S molecule plays an electron donor role under all conditions. Second, the gas molecule's LUMO, as an electron acceptor, is closer to the compressed MoS2 surface in the adsorbed state. On the other hand, upon adsorption, the HOMO, as an electron donor, comes closer to the SL-MoS2 surface for the tensile strains.
The electronic band structure of the H2S adsorbed SL-MoS2 is illustrated in Fig. 7 and the bandgap values for studied strains are tabulated in Table 2. Under both compressive and tensile strains, the bandgap is reduced and the maximum attenuation occurs when the SL-MoS2 is under tensile strain whereas the bandgap slightly shrinks when compressive strains are applied. Exerting tensile strain, the bandgap values are reduced by as much as 86%, from 1.67 eV in the unstrained H3 configuration to 0.23 eV in the +8% strained configuration. On the other hand, when compressive strains are applied, a bandgap reduction is observed for the B2 configuration by up to 26% as 1.81 eV is decreased to 1.34 eV in −2% and −8%, respectively. It is worthwhile to mention that the obtained results are consistent with previously reported bandgap modulations under strain.56
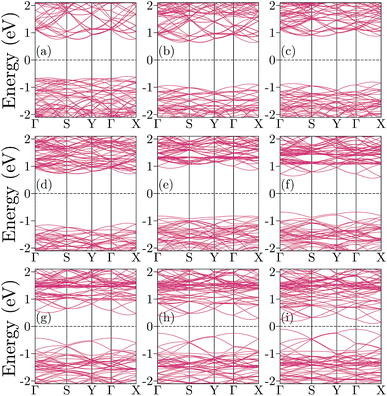 | ||
| Fig. 7 Band structures for the adsorption of the H2S molecule on (a) −8 to (i) +8 percent strained SL-MoS2 substrates with 2 percent intervals. | ||
| Strain | Initial config. | d (Å) | E a (eV) | (ρH2S) (|e|) | E g (eV) |
|---|---|---|---|---|---|
| −8 | B2 | 2.685 | −0.4762 | 0.023 | 1.34 |
| −6 | B2 | 2.782 | −0.4910 | 0.033 | 1.52 |
| −4 | B2 | 2.786 | −0.4936 | 0.032 | 1.60 |
| −2 | B2 | 2.778 | −0.4989 | 0.042 | 1.81 |
| 0 | H3 | 2.752 | −0.4944 | 0.060 | 1.67 |
| 2 | H3 | 2.639 | −0.4870 | 0.060 | 1.07 |
| 4 | H3 | 2.568 | −0.5163 | 0.060 | 0.92 |
| 6 | H3 | 2.548 | −0.5509 | 0.062 | 0.51 |
| 8 | H3 | 2.461 | −0.5390 | 0.061 | 0.23 |
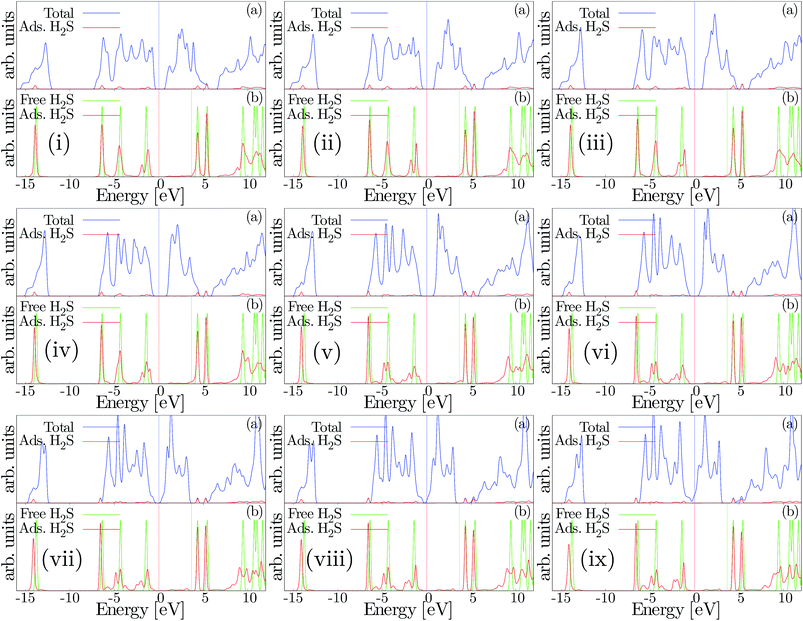
Fig. 8 demonstrates the density of states plots for the H2S molecule adsorption on the SL-MoS2 substrate for the energetically favourable conditions under exerted strains. In particular, Fig. 8(i)–(ix) correspond to −8% to +8% biaxially strained structures, respectively. In each subsection of (i) to (ix), two subsections of (a) and (b) are present. The upper graph in each subsection, (a), shows the total density of states (TDOS). As can be seen, the adsorption of the H2S molecule influences the valence band close to the Fermi energy level but similar levels in the conduction band are left intact. Moreover, the lower plot, (b), compares the density of states for the isolated and adsorbed hydrogen sulfide molecules. It is established that implementing compressive strains attenuates the peaks in the TDOS plots while tensile strains intensify them. It is also verified that the electron transfer occurs from the H2S molecule to SL-MoS2, as the Fermi energy levels are decreased upon adsorption under both compressive and tensile strains. This is also proof of the fact that the LUMO of the hydrogen sulfide molecule has little interaction with the SL-MoS2, whereas its HOMO overlaps the valence band levels in SL-MoS2. It's notable that as both the HOMO of the H2S molecule and the valence band levels of SL-MoS2 are full, only slight charge transfer occurs.
3.2 Optical properties
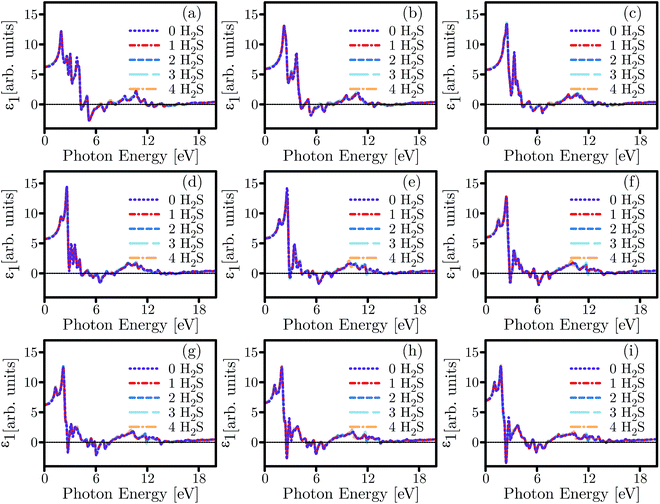
Optical sensors based on SL-MoS2 have successfully been demonstrated to detect particles and biomolecules in several past studies.68–71 In this section, the optical characteristics of SL-MoS2 are investigated under biaxial strains ranging from −8% to +8% for pristine and H2S-adsorbed substrates. Furthermore, we have complemented our calculations by studying the influence of H2S concentration on the optical characteristics. It is noteworthy that despite the fact that the DFT method undervalues the energy band gap, our obtained optical trends are reliable.72The real and imaginary parts of the dielectric function (ε1 and ε2) are calculated for both pristine and H2S-adsorbed SL-MoS2 within the aforementioned strain range. It is well established that the energy values in which ε1 crosses the horizontal zero axis from the negative side are associated with plasmonic excitations.20 All zero-crossings in ε1 spectra are tabulated in ESI Table S1.† Exploring the ε1 spectra shown in Fig. 9 for the unstrained SL-MoS2 at zero-concentration, it is observed that the zero-crossings occur at 3.06 eV, 4.516 eV, 5.438 eV, 7.058 eV, 7.542 eV, 8.07 eV, 14.15 eV, and 15.45 eV. Depending on the number of adsorbed molecules or the amount of exerted strain, existing zero-crossings might disappear or undergo modulation in energies and intensities, and new zero-crossings might even emerge (see Table S1†). In particular, by referring to Fig. 9 and Table S1,† it is evident that exerting compressive and tensile strains alters the zero-crossing energies and number of their occurrences. For instance, as the SL-MoS2 undergoes compressive strain, the zero-crossings appear at higher energies (i.e. 4.641–4.693 eV) while, similar to the unstrained SL-MoS2 at zero-concentration, the zero-crossings span from 2.526 to 3.005 eV under tensile strains. Moreover, compared to the unstrained SL-MoS2 at zero-concentration, the number of zero-crossings are halved to 4 in +8% strained SL-MoS2 under no adsorption. This trend, however, is not repeated under compressive strains and the number of zero-crossings is left almost intact. On the other hand, introducing various concentrations of the gas molecule to the SL-MoS2 modulates the energy values at which the zero-crossings occur and/or brings about the emergence of new ones. Simultaneous adsorption of up to four molecules redshifts the values in question in a gradually increasing manner (showing up to 0.116 eV increase in −8% biaxially strained SL-MoS2, compared to −8% strained SL-MoS2 at zero-concentration) as the exerted compressive strains are intensified. In contrast, as the tensile strains are applied, the shift in energy values decreases and for SL-MoS2 under +8% strain, introducing four H2S molecules blueshifts the energy value at which the first zero-crossing emerges by 0.023 eV, compared to the +8% strained SL-MoS2 at zero-concentration. Besides, a new zero-crossing at 11.9 eV is recorded under several biaxial strains (0, +2 and +4 strains) when three and four gas molecules are introduced into the SL-MoS2. Overall, slight and negligible dissonances are observed upon adsorption of several gas molecules. Upon adsorption of four gas molecules, few disharmonies occur compared to the rest of the plot and two additive zero-crossings occur in 0% strained SL-MoS2 at 14.49 and 15.36 eV, and in +2% strained SL-MoS2 at 14.32 and 15.2 eV.
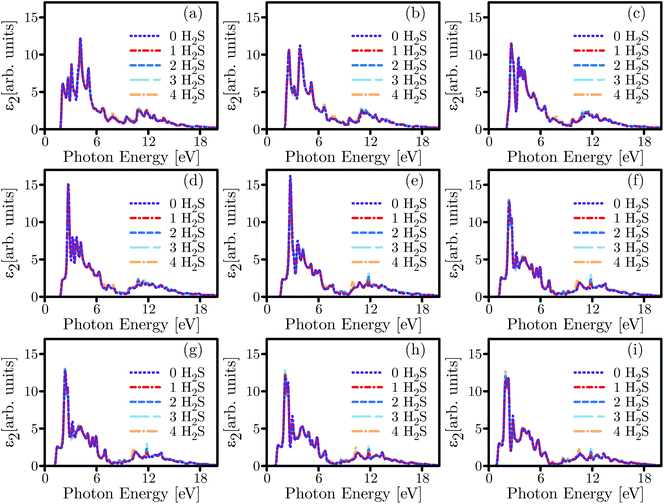
Considering the calculated ε2 shown in Fig. 10, it can be deduced that the main adsorption peak is both attenuated and divided into several weaker peaks under exertion of different quantities of biaxial strains. However, the adsorption of more gas molecules amplifies the main peak under tensile strains while it slightly modulates the peak under biaxially compressive strains. Additionally, the ε2 spectra are reduced to zero in a lower energy range under higher tensile strains. The concentration of gas molecules resulted in minor but noticeable disharmonies and strengthened two peaks near 10 eV and 12 eV in almost every case of the exerted strains.
Electron energy loss (EEL) spectra have long been employed to investigate the electronic properties of materials. Remarkably, the distinct peaks in the EEL spectra, which are attributed to the existence of plasma oscillations, play a significant role in determining the optical properties in semiconductors and metals. Therefore, to study the feasibility of SL-MoS2 as an optical sensor, the EEL spectra are calculated both under strain and at various concentrations of the H2S molecule using the following equation:
 | (4) |
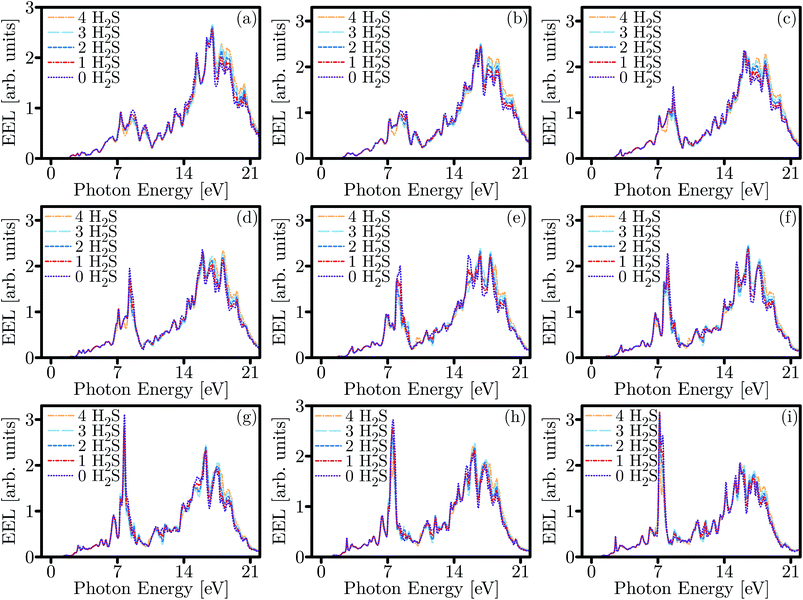
For unstrained SL-MoS2 at zero-concentration, the sharp EEL peaks attributed to the plasmonic excitations emerge at 15.52 eV and 15.64 eV which are in excellent agreement with previous reports.73,74 From the EEL spectra in Fig. 11, it is evident that, unlike the dielectric function, the adsorption of more than one gas molecule results in noticeable modulations in the plot. The intensities of almost all peaks are affected upon the adsorption of the H2S molecules and the peaks are either attenuated or divided into several peaks. Trends of the spectra are distinguishably altered as higher concentrations of the H2S are adsorbed for unstrained SL-MoS2. For instance, the previous main peak in unstrained SL-MoS2 at zero-concentration experiences 25% attenuation upon adsorption of various concentrations of the H2S molecule. Also, the intensity of the new main peak upon adsorption of the gas molecules is increased up to 7% in unstrained SL-MoS2.
For SL-MoS2 at zero-concentration, tensile biaxial strains redshift the main peak's energy to almost half its initial energy. However, the main peak has a drastic intensity which is increased by as much as 27% compared to the unstrained SL-MoS2 at zero-concentration. On the other hand, exerting compressive strains blueshifts the energy of the main peak by 0.28 eV in −8% biaxially strained SL-MoS2 at zero-concentration while the intensity is increased by 11%. Next, probing how adsorption of several gas molecules influences the EEL spectra of biaxially strained SL-MoS2, we begin with compressive strains. Under compressive strains, introducing four H2S molecules into the SL-MoS2 results in a severe blueshift of the energy value of the main peak. For instance, the adsorption of 4 gas molecules shifts the energy of the main peak by 1.96 eV and 2.16 eV in −2% and −4% strained SL-MoS2, respectively, which is comparable to the obtained peaks for the adsorption of only one gas molecule. Nevertheless, the intensities of the main peaks are negligibly changed upon adsorption of multiple H2S molecules under almost every biaxial compressive strain. In contrast, as the tensile strains are applied, the adsorption of several gas molecules brings about severe modulations in a few cases. Under +4% biaxial strain, the energy at which the main peak emerges is increased more than two-fold as 3 and 4 H2S molecules are adsorbed on the SL-MoS2. The same is observed in the +6% biaxially strained SL-MoS2 when 4 molecules are adsorbed. Besides, the intensity of the main peak is attenuated monotonically upon adsorption of several gas molecules under +4%, +6%, and +8% strains which is comparable to the increase at +2% strain.
Finally, it is noteworthy that investigating the optical and electronic properties of materials in experimental setups is carried out using a transmission electron microscope which is equipped with an EELS spectrometer. Also, optical responses upon adsorption of gas molecules may be recorded employing ellipsometry measurement. Hence, the modulations in optical and electronic properties upon adsorption of single or multiple H2S molecules on strained or unstrained SL-MoS2 demonstrated in this study can be applied, at least in principle, to design electro-optical H2S sensors based on SL-MoS2.
4 Conclusion
We have comprehensively studied the electronic and optical adsorption characteristics of the hydrogen sulfide (H2S) molecule on single-layer molybdenum disulfide (SL-MoS2) substrates for different concentrations of the gas molecule and under biaxial strains ranging from −8% to +8%. It is found that the electron transfer from the molecule to the substrate is significantly reduced from about 0.06e− under both no-strain and tensile strain conditions to about 0.03e− for the compressive strains. Moreover, the real and imaginary parts of the dielectric function are calculated for the minimum energy configurations. It is observed that although the concentration of H2S molecules does not considerably affect the spectra, compressive and tensile strains disturb their outline noticeably. Additionally, we have found that the electron energy loss (EEL) spectra are remarkably influenced both under exertion of strain and upon increasing gas molecule concentration. Hence, our theoretical findings may set the stage for electronic and optical gas sensing devices which employ SL-MoS2 as the platform material.Conflicts of interest
There are no conflicts to declare.Acknowledgements
The authors acknowledge the partial support provided by the Nanoelectronics Center of Excellence, School of Electrical and Computer Engineering, University of Tehran.References
- K. S. Novoselov, A. K. Geim, S. V. Morozov, D. Jiang, Y. Zhang, S. V. Dubonos, I. V. Grigorieva and A. A. Firsov, Science, 2004, 306, 666–669 CrossRef CAS.
- Q. H. Wang, K. Kalantar-Zadeh, A. Kis, J. N. Coleman and M. S. Strano, Nat. Nanotechnol., 2012, 7, 699 CrossRef CAS.
- H. S. Lee, S.-W. Min, Y.-G. Chang, M. K. Park, T. Nam, H. Kim, J. H. Kim, S. Ryu and S. Im, Nano Lett., 2012, 12, 3695–3700 CrossRef CAS.
- M. Buscema, M. Barkelid, V. Zwiller, H. S. van der Zant, G. A. Steele and A. Castellanos-Gomez, Nano Lett., 2013, 13, 358–363 CrossRef CAS.
- R. Kumar, N. Goel, M. Mishra, G. Gupta, M. Fanetti, M. Valant and M. Kumar, Adv. Mater. Interfaces, 2018, 1800071 CrossRef.
- H. Zhao, Q. Guo, F. Xia and H. Wang, Nanophotonics, 2015, 4, 128–142 Search PubMed.
- M. Liu, X. Yin, E. Ulin-Avila, B. Geng, T. Zentgraf, L. Ju, F. Wang and X. Zhang, Nature, 2011, 474, 64 CrossRef CAS PubMed.
- A. Pospischil, M. Humer, M. M. Furchi, D. Bachmann, R. Guider, T. Fromherz and T. Mueller, Nat. Photonics, 2013, 7, 892 CrossRef CAS.
- S. Das, H.-Y. Chen, A. V. Penumatcha and J. Appenzeller, Nano Lett., 2012, 13, 100–105 CrossRef.
- Y. Cai, J. Lan, G. Zhang and Y.-W. Zhang, Phys. Rev. B: Condens. Matter Mater. Phys., 2014, 89, 035438 CrossRef.
- X. Liu, G. Zhang, Q.-X. Pei and Y.-W. Zhang, Appl. Phys. Lett., 2013, 103, 133113 CrossRef.
- Y. Cai, G. Zhang and Y.-W. Zhang, J. Am. Chem. Soc., 2014, 136, 6269–6275 CrossRef CAS.
- N. Djavid, K. Khaliji, S. M. Tabatabaei and M. Pourfath, IEEE Trans. Electron Devices, 2014, 61, 23–29 CAS.
- B. Radisavljevic and A. Kis, Nat. Mater., 2013, 12, 815 CrossRef CAS.
- J. Guo, R. Wen, Y. Liu, K. Zhang, J. Kou, J. Zhai and Z. L. Wang, ACS Appl. Mater. Interfaces, 2018, 10, 8110–8116 CrossRef CAS.
- A. Sharma, M. S. Khan, M. Husain, M. S. Khan and A. Srivastava, IEEE Sens. J., 2018, 18, 2853–2860 CAS.
- D. Wu, Z. Lou, Y. Wang, T. Xu, Z. Shi, J. Xu, Y. Tian and X. Li, Nanotechnology, 2017, 28, 435503 CrossRef.
- Y. Tong, Y. Liu, Y. Zhao, J. Thong, D. S. Chan and C. Zhu, Sens. Actuators, A, 2017, 255, 28–33 CrossRef CAS.
- J. Baek, D. Yin, N. Liu, I. Omkaram, C. Jung, H. Im, S. Hong, S. M. Kim, Y. K. Hong and J. Hur, Nano Res., 2017, 10, 1861–1871 CrossRef CAS.
- S.-M. Tabatabaei, M. Pourfath and M. Fathipour, J. Appl. Phys., 2018, 124, 134501 CrossRef.
- S. Mohammad Tabatabaei, M. Noei, K. Khaliji, M. Pourfath and M. Fathipour, J. Appl. Phys., 2013, 113, 163708 CrossRef.
- T. Xue, K. Qi and C. Hu, Sens. Actuators, B, 2019, 284, 589–594 CrossRef CAS.
- Y. Zhao, B. Yang and J. Liu, Sens. Actuators, B, 2018, 271, 256–263 CrossRef CAS.
- G. U. Siddiqui, M. Sajid, J. Ali, S. W. Kim, Y. H. Doh and K. H. Choi, Sens. Actuators, B, 2018, 266, 354–363 CrossRef.
- G. Eda and S. A. Maier, ACS Nano, 2013, 7, 5660–5665 CrossRef CAS.
- Y. Zhou, C. Gao and Y. Guo, J. Mater. Chem. A, 2018, 6, 10286–10296 RSC.
- B. Liu, L. Chen, G. Liu, A. N. Abbas, M. Fathi and C. Zhou, ACS Nano, 2014, 8, 5304–5314 CrossRef CAS.
- N. Yamazoe, Sens. Actuators, B, 2005, 108, 2–14 CrossRef CAS.
- S. Z. Butler, S. M. Hollen, L. Cao, Y. Cui, J. A. Gupta, H. R. Gutiérrez, T. F. Heinz, S. S. Hong, J. Huang and A. F. Ismach, ACS Nano, 2013, 7, 2898–2926 CrossRef CAS.
- K. Y. Ko, J.-G. Song, Y. Kim, T. Choi, S. Shin, C. W. Lee, K. Lee, J. Koo, H. Lee and J. Kim, ACS Nano, 2016, 10, 9287–9296 CrossRef CAS.
- V. Gunasekaran, M. Devaraju, S. Yuvaraj, V. Surya, V. Singh, K. Karthikeyan and S.-J. Kim, Mater. Sci. Semicond. Process., 2017, 66, 81–86 CrossRef CAS.
- C. Rao, U. Maitra and U. V. Waghmare, Chem. Phys. Lett., 2014, 609, 172–183 CrossRef CAS.
- X. Xu, X. Dong, Z. Bao, R. Wang, J. Hu and H. Zeng, J. Mater. Chem. A, 2017, 5, 22654–22661 RSC.
- Y. Pi, Z. Li, D. Xu, J. Liu, Y. Li, F. Zhang, G. Zhang, W. Peng and X. Fan, ACS Sustainable Chem. Eng., 2017, 5, 5175–5182 CrossRef CAS.
- J. Shan, J. Li, X. Chu, M. Xu, F. Jin, X. Wang, L. Ma, X. Fang, Z. Wei and X. Wang, RSC Adv., 2018, 8, 7942–7948 RSC.
- Y. H. Kim, K. Y. Kim, Y. R. Choi, Y. S. Shim, J. M. Jeon, J. H. Lee, S. Y. Kim, S. Han and H. W. Jang, J. Mater. Chem. A, 2016, 4(16), 6070–6076 RSC.
- H. Li, Z. Yin, Q. He, H. Li, X. Huang, G. Lu, D. W. H. Fam, A. I. Y. Tok, Q. Zhang and H. Zhang, Small, 2011, 8, 63–67 CrossRef.
- Q. He, Z. Zeng, Z. Yin, H. Li, S. Wu, X. Huang and H. Zhang, Small, 2012, 8, 2994–2999 CrossRef CAS.
- J. Jiang, A. Chan, S. Ali, A. Saha, K. J. Haushalter, W.-L. M. Lam, M. Glasheen, J. Parker, M. Brenner and S. B. Mahon, Sci. Rep., 2016, 6, 20831 CrossRef CAS.
- R. Reiffenstein, W. C. Hulbert and S. H. Roth, Annu. Rev. Pharmacol. Toxicol., 1992, 32, 109–134 CrossRef CAS.
- M. F. Fellah, Fuel Process. Technol., 2016, 144, 191–196 CrossRef CAS.
- Y. Gui, D. Liu, X. Li, C. Tang and Q. Zhou, Results Phys., 2019, 102225 CrossRef.
- H. Qian, W. Lu, X. Wei, W. Chen and J. Deng, Results Phys., 2019, 12, 107–112 CrossRef.
- H. Wei, Y. Gui, J. Kang, W. Wang and C. Tang, Nanomaterials, 2018, 8, 646 CrossRef.
- X. Zhang, L. Yu, X. Wu and W. Hu, Adv. Sci., 2015, 2, 1500101 CrossRef.
- Q. Zhou, X. Su, W. Ju, Y. Yong, X. Li, Z. Fu and C. Wang, RSC Adv., 2017, 7, 31457–31465 RSC.
- X. Gao, Y. Sun, C. Zhu, C. Li, Q. Ouyang and Y. Chen, Sens. Actuators, B, 2017, 246, 662–672 CrossRef CAS.
- D. Fu, C. Zhu, X. Zhang, C. Li and Y. Chen, J. Mater. Chem. A, 2016, 4, 1390–1398 RSC.
- B. Radisavljevic, M. B. Whitwick and A. Kis, ACS Nano, 2011, 5, 9934–9938 CrossRef CAS.
- E. Scalise, M. Houssa, G. Pourtois, V. Afanasév and A. Stesmans, Nano Res., 2012, 5, 43–48 CrossRef CAS.
- Q. Yue, J. Kang, Z. Shao, X. Zhang, S. Chang, G. Wang, S. Qin and J. Li, Phys. Lett. A, 2012, 376, 1166–1170 CrossRef CAS.
- Y. Ding, Y. Wang, J. Ni, L. Shi, S. Shi and W. Tang, Phys. B, 2011, 406, 2254–2260 CrossRef CAS.
- Y. Y. Hui, X. Liu, W. Jie, N. Y. Chan, J. Hao, Y.-T. Hsu, L.-J. Li, W. Guo and S. P. Lau, ACS Nano, 2013, 7, 7126–7131 CrossRef CAS.
- T. Li, Phys. Rev. B: Condens. Matter Mater. Phys., 2012, 85, 235407 CrossRef.
- W. S. Yun, S. Han, S. C. Hong, I. G. Kim and J. Lee, Phys. Rev. B: Condens. Matter Mater. Phys., 2012, 85, 033305 CrossRef.
- S. Mohammad Tabatabaei, M. Noei, K. Khaliji, M. Pourfath and M. Fathipour, J. Appl. Phys., 2013, 113, 163708 CrossRef.
- M. P. K. Sahoo, J. Wang, Y. Zhang, T. Shimada and T. Kitamura, J. Phys. Chem. C, 2016, 120, 14113–14121 CrossRef CAS.
- W. Kohn, Phys. Rev., 1965, 140, A1133 CrossRef.
- P. Hohenberg, Phys. Rev., 1964, 136, B864 CrossRef.
- J. P. Perdew, K. Burke and M. Ernzerhof, Phys. Rev. Lett., 1996, 77, 3865 CrossRef CAS.
- J. M. Soler, E. Artacho, J. D. Gale, A. García, J. Junquera, P. Ordejón and D. Sánchez-Portal, J. Phys.: Condens. Matter, 2002, 14, 2745 CrossRef CAS.
- N. Troullier and J. L. Martins, Phys. Rev. B: Condens. Matter Mater. Phys., 1991, 43, 1993 CrossRef CAS.
- M. Gajdoš, K. Hummer, G. Kresse, J. Furthmüller and F. Bechstedt, Phys. Rev. B: Condens. Matter Mater. Phys., 2006, 73, 045112 CrossRef.
- F. L. Hirshfeld, Theor. Chim. Acta, 1977, 44, 129–138 CrossRef CAS.
- Y. Jing, X. Tan, Z. Zhou and P. Shen, J. Mater. Chem. A, 2014, 2, 16892–16897 RSC.
- T. Li, Phys. Rev. B: Condens. Matter Mater. Phys., 2012, 85, 235407 CrossRef.
- L. Kou, A. Du, C. Chen and T. Frauenheim, Nanoscale, 2014, 6, 5156–5161 RSC.
- C. Lu, Y. Liu, Y. Ying and J. Liu, Langmuir, 2017, 33, 630–637 CrossRef CAS.
- K. Jin, L. Xie, Y. Tian and D. Liu, J. Phys. Chem. C, 2016, 120, 11204–11209 CrossRef CAS.
- B. L. Li, H. L. Zou, L. Lu, Y. Yang, J. L. Lei, H. Q. Luo and N. B. Li, Adv. Funct. Mater., 2015, 25, 3541–3550 CrossRef CAS.
- P. T. K. Loan, W. Zhang, C. Lin, K. Wei, L. Li and C. Chen, Adv. Mater., 2014, 26, 4838–4844 CrossRef CAS PubMed.
- J.-H. Yang, Y. Zhai, H. Liu, H. Xiang, X. Gong and S.-H. Wei, J. Am. Chem. Soc., 2012, 134, 12653–12657 CrossRef CAS.
- S. Sharma, A. Kumar, N. Singh and D. Kaur, Sens. Actuators, B, 2018, 275, 499–507 CrossRef CAS.
- A. Kumar and P. Ahluwalia, Mater. Chem. Phys., 2012, 135, 755–761 CrossRef CAS.
Footnote |
| † Electronic supplementary information (ESI) available: The zero-crossing energies in the real part of dielectric function (ε1) spectra for pristine and H2S adsorbed SL-MoS2 under different strains and concentrations of gas molecules. In addition, coordinates of the first ten peaks in the EEL spectra are given for different strains and concentrations of H2S molecules on the SL-MoS2. See DOI: 10.1039/c9na00069k |
| This journal is © The Royal Society of Chemistry 2019 |

