 Open Access Article
CdS nanodroplets over silica microballs for efficient room-temperature LPG detection†
Nupur
Saxena
 *a,
Pragati
Kumar
 *b and
Vinay
Gupta
 c
c
aDepartment of Physics & Astronomical Sciences, Central University of Jammu, Rahya-Suchani (Bagla), Samba, 181 143 Jammu, J&K, India. E-mail: n1saxena@gmail.com; Tel: +91-9797872397
bDepartment of Nano Sciences and Materials, Central University of Jammu, Rahya-Suchani (Bagla), Samba, 181 143 Jammu, J&K, India. E-mail: pkumar.phy@gmail.com; Tel: +91-9055180885
cDepartment of Physics & Astrophysics, University of Delhi, Delhi-110 007, India
First published on 25th April 2019
Abstract
An efficient room-temperature sensor for liquified petroleum gas (LPG) is demonstrated by employing CdS:SiO2 nanocomposite thin films (CdS:SiO2 NCTFs) for the first time. CdS:SiO2 NCTFs exhibiting the morphology of CdS nanodroplets on micron-sized spherical balls of SiO2 were deposited using the pulsed laser deposition (PLD) method, followed by thermal annealing. The targets of chemically synthesized CdS nanoparticles and commercially procured SiO2 were used to deposit CdS:SiO2 NCTFs by swapping them at a frequency ratio of 2![[thin space (1/6-em)]](https://www.rsc.org/images/entities/char_2009.gif) :
:![[thin space (1/6-em)]](https://www.rsc.org/images/entities/char_2009.gif) 8 laser pulses per second, which was selected to ensure nearly the same ratio of CdS to SiO2 in NCTFs and was confirmed by X-ray photoelectron spectroscopy. Sensor fabrication was carried out on bare CdS thin films and as-grown and annealed CdS:SiO2 NCTFs using an Ag paste over Pt interdigitated electrodes to measure the resistance of the films in air and in the presence of reducing gases, viz., LPG, H2, H2S, NO2 and CO2. The present sensor showed the highest response for LPG and the observed value was ∼71% for 1000 ppm at RT with the response time and recovery time of 91 s and 140 s, respectively. The response of the sensor was sustainable up to 75 °C and then decreased, which suggested its promising usage for low-temperature regions as well. A low detection limit of 20 ppm at RT for LPG was determined; however, a significant response was observed only at 50 ppm. The sensor retained ∼96% of its initial response even after 8 weeks and that too at 100 °C. The present LPG sensor is highly promising due to its high sensitivity, low detection limit, low response and recovery times, good reproducibility, RT operation and simple fabrication technique.
8 laser pulses per second, which was selected to ensure nearly the same ratio of CdS to SiO2 in NCTFs and was confirmed by X-ray photoelectron spectroscopy. Sensor fabrication was carried out on bare CdS thin films and as-grown and annealed CdS:SiO2 NCTFs using an Ag paste over Pt interdigitated electrodes to measure the resistance of the films in air and in the presence of reducing gases, viz., LPG, H2, H2S, NO2 and CO2. The present sensor showed the highest response for LPG and the observed value was ∼71% for 1000 ppm at RT with the response time and recovery time of 91 s and 140 s, respectively. The response of the sensor was sustainable up to 75 °C and then decreased, which suggested its promising usage for low-temperature regions as well. A low detection limit of 20 ppm at RT for LPG was determined; however, a significant response was observed only at 50 ppm. The sensor retained ∼96% of its initial response even after 8 weeks and that too at 100 °C. The present LPG sensor is highly promising due to its high sensitivity, low detection limit, low response and recovery times, good reproducibility, RT operation and simple fabrication technique.
1. Introduction
Liquefied petroleum gas (LPG) is one of the highly flammable gases and its usage as a fuel gas in homes, workplaces, and industries including those of automobiles is increasing day by day all over the world. Evidently, the casualties are also increasing and are manifold due to its leakage/bursting. According to a report by the National Fire Protection Association (NFPA), USA, in 2007–2011, U.S. municipal fire departments responded to an estimated average of 51![[thin space (1/6-em)]](https://www.rsc.org/images/entities/char_2009.gif) 600 fires per year involving the ignition of a flammable gas as the type of material first ignited; these cases included 20
600 fires per year involving the ignition of a flammable gas as the type of material first ignited; these cases included 20![[thin space (1/6-em)]](https://www.rsc.org/images/entities/char_2009.gif) 260 fires per year in homes and 31
260 fires per year in homes and 31![[thin space (1/6-em)]](https://www.rsc.org/images/entities/char_2009.gif) 340 fires per year at other properties. These fires cause an estimated 168 civilian deaths per year, 1029 civilian injuries per year, and losses of $644 million per year in direct property damage.1
340 fires per year at other properties. These fires cause an estimated 168 civilian deaths per year, 1029 civilian injuries per year, and losses of $644 million per year in direct property damage.1
As far as India is concerned, the total number of accidental deaths by cooking gas cylinder/stove explosions was 3525 in 2014, which increased to 3667 in 2015 according to the National Crime Records Bureau. More than 3 lakh deaths were reported due to fire-related incidents, with an average of 59 deaths per day between 2000 and 2016 in India.2Fig. 1 shows the fact sheets of fires caused by flammable gases in the USA, which indicates that an average of 28% fire accidents in home and non-home structures is due to the leakage of LPG only, whereas 17% fire accidents are due to the bursting of cylinder/stoves in India. The pie chart in Fig. 1b shows the causes responsible for fires in India in percentage. The percentages of civilian deaths, injuries and property damages are depicted in Fig. 1a as a bar diagram. The statistics of deaths caused by fire from 2000 to 2016 in the USA, UK and India are shown in Fig. 1b. Indeed, the number of deaths in India is quite high with respect to that in developed countries such as the USA and UK; however, these data are comparable with respect to the population of the respective countries. For illustration, the fire death rate in India is twice that in the USA. However, the fire death rate in Russia is 3.5 times that in India; also, in European countries like Belarus and Lithuania, it is 4 times and 2.5 times, respectively, than that in India.3 Therefore, fire safety is a critical issue not just in developing countries such as India but all over the world.
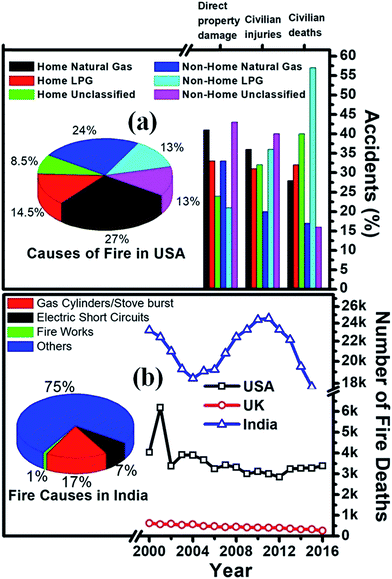 | ||
| Fig. 1 (a) Fact sheet of fires caused with flammable gases in the USA and (b) year-wise fire deaths in USA, UK and India. Pie charts of fire causes in (a) USA and (b) India. | ||
To monitor, detect and precisely measure trace levels of LPG in the environment and for early warning systems, the development of a reliable sensor with improved sensitivity and selectivity is crucial for preventing fatal accidents. Another crucial parameter, particularly for a flammable gas sensor, is its operating temperature. The operating temperature of such a sensor should be preferably low as a high operating temperature will require a complex sensing platform and may lead to explosion due to the presence of explosive gases in the confined area. In contrast, a low operating temperature will help the superficial fabrication of portable gadgets with the least chance of detonation.
It has been proven that nanoscale materials have the potential for chemical, gas and biological sensing due to their highly tunable size- and shape-dependent chemical and physical properties.4 Principally, their large surface areas and high pore volumes per unit mass increase the sensitivity and the response times of sensors. Enormous efforts have been made to develop a gas sensor with high sensitivity, high selectivity, short response and recovery times and most importantly a low operating temperature using diverse materials to detect noxious, explosive, inflammable and pollutant gases.5–10 However, the invention of semiconductor-based sensing devices with identical desired parameters to identify hazardous gases for a healthy ambience is still an open challenge for researchers. Many successful efforts have been made to achieve a low operating temperature using a variety of nanomaterials; their hybrid structures and composite materials have even been demonstrated to work at room temperature (RT).6–11 This particular feature is typically observed in CdS nanocomposites or CdS heterostructures. Nevertheless, the other sensing parameters, viz., the response and recovery times, sensitivity, and detection limit depend on other composite or heterostructure materials. Dhawale et al.6 fabricated an LPG sensor based on an n-CdS/p-polyaniline thin film heterojunction using a simple inexpensive electrodeposition technique. Their sensor could detect LPG at RT with a gas response of 80% and it exhibited 95% stability on exposure to 1040 ppm concentration of gas. A comparative assessment of the performances of CdS/polyacrylamide and Cd(NO3)2·(AAm)4·2H2O thick films for LPG sensing at RT was investigated by Singh et al.7 They observed maximum sensitivities of 1.3 and 3.7 GΩ min−1 for CdS/polyacrylamide and Cd(NO3)2·(AAm)4·2H2O, respectively. The response and recovery times were recorded as 2 and 8 min, respectively, for 5 vol% (50![[thin space (1/6-em)]](https://www.rsc.org/images/entities/char_2009.gif) 000 ppm) of LPG. Surface-coated PbS nanoparticles on CdS nanowires with a high-surface-area nano-heterojunction were synthesized chemically and exposed to LPG at RT by Sonawane et al.8 The architecture exhibited a gas response of 60% on exposure to 1200 ppm of LPG; the response and recovery times were 120 s and 105 s, respectively, and a stable response of 93% for up to 10 days was observed. In another study on a chemically synthesized PEDOT:PSS shell on CdS nanowires reported by Sonawane et al.,9 they observed almost the same gas response (58.9%) and response and recovery times of 126 s and 109 s, respectively, under exposure to a relatively low gas concentration (900 ppm). Lokhande et al.10 examined the performance of a Cu2SnS3 (CTS)/CdS heterojunction for LPG sensing and observed a maximum LPG response of 56% at RT after exposure to 780 ppm gas with 31 s and 56 s response and recovery times, respectively. This device retained 95% gas sensing stability after a time period of 60 days. The existing literature indicates that the manipulation with diverse materials/compositions can improve a few parameters with the compensation of other desired parameters. Therefore, the fabrication of sensors using a variety of materials to achieve superior properties is a subject of constant research interest. To the best of our knowledge, bare CdS thin films and CdS:SiO2 nanocomposite thin films (CdS:SiO2 NCTFs) have never been tested using such gases.
000 ppm) of LPG. Surface-coated PbS nanoparticles on CdS nanowires with a high-surface-area nano-heterojunction were synthesized chemically and exposed to LPG at RT by Sonawane et al.8 The architecture exhibited a gas response of 60% on exposure to 1200 ppm of LPG; the response and recovery times were 120 s and 105 s, respectively, and a stable response of 93% for up to 10 days was observed. In another study on a chemically synthesized PEDOT:PSS shell on CdS nanowires reported by Sonawane et al.,9 they observed almost the same gas response (58.9%) and response and recovery times of 126 s and 109 s, respectively, under exposure to a relatively low gas concentration (900 ppm). Lokhande et al.10 examined the performance of a Cu2SnS3 (CTS)/CdS heterojunction for LPG sensing and observed a maximum LPG response of 56% at RT after exposure to 780 ppm gas with 31 s and 56 s response and recovery times, respectively. This device retained 95% gas sensing stability after a time period of 60 days. The existing literature indicates that the manipulation with diverse materials/compositions can improve a few parameters with the compensation of other desired parameters. Therefore, the fabrication of sensors using a variety of materials to achieve superior properties is a subject of constant research interest. To the best of our knowledge, bare CdS thin films and CdS:SiO2 nanocomposite thin films (CdS:SiO2 NCTFs) have never been tested using such gases.
In this article, we explored pulsed laser-deposited nanocrystalline CdS thin films (nc-CdS) and CdS:SiO2 NCTFs for LPG sensing. The gas sensing properties of the films were explored for a variety of gases, viz., LPG, H2, H2S, NO2, and CO2 at RT = 20 °C. All the films showed significant responses for LPG; indeed, the response of CdS:SiO2 NCTF annealed at 400 °C was much higher than those of others with significantly smaller response and recovery times due to the presence of CdS nanodroplets (NDs) on silica microballs (MBs).
2. Experimental section
2.1 Thin film deposition
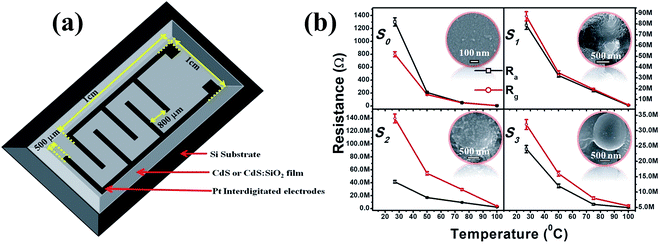
The procedure used here for the growth of nc-CdS and CdS:SiO2 NCTFs by pulsed laser deposition (PLD) setup is fully described elsewhere.12,13 All the samples investigated were synthesized by PLD by guiding and focusing the third harmonic of a continuum Nd:YAG laser of energy 220 mJ at a wavelength of 355 nm with a repetition rate of 10 Hz and a pulse width of 10 ns onto the rotating target mounted at an oblique angle of 30° to the direction of the incident laser beam. For CdS thin film deposition, chemically synthesized CdS quantum dot (QD)14 pellets were used as a target, whereas a commercially purchased (Sigma Aldrich Ltd., USA) SiO2 target was also used along with a CdS target to deposit CdS:SiO2 NCTFs. N-type 〈100〉 Si wafers and carbon-coated Cu TEM grids were used as substrates for deposition and stored at room temperature inside a clean stainless steel vacuum chamber at a base pressure of 5 × 10⁻⁶ mbar. CdS:SiO2 NCTFs of thickness ∼500 nm were deposited by exposing the CdS and SiO2 targets alternatively for 2 and 8 shots of the laser, respectively. The distance between the target and the substrate was 4 cm. The deposition rate of CdS:SiO2 NCTFs in this configuration was about ∼0.20 nm per pulse. Furthermore, thermal annealing of the films was carried out at temperatures of 400 °C and 500 °C for 3 h in an Ar environment to evolve the structural phase of CdS. The sensors fabricated using nc-CdS, CdS:SiO2 NCTFs pristine annealed at 400 °C and 500 °C temperatures are referred as S0, S1, S2 and S3, respectively, hereafter2.2 Characterizations
Structural and optical studies were carried out using basic characterization techniques, viz., glancing angle X-ray diffraction with Cu Kα of wavelength 1.54 Å, micro-Raman spectroscopy, transmission electron microscopy (TEM), X-ray photoelectron spectroscopy (XPS) and photoluminescence (PL) spectroscopy and are reported elsewhere in detail.12,13 The temperature-dependent photoluminescence study in the temperature range of 20–560 K was carried out to explore the temperature sensing properties of the nanocomposite films.15In the present study, the surface morphology and microstructure of the films were analyzed using scanning electron microscopy (SEM), MIRA\\TESCAN FESEM.
2.3 Gas-sensing measurements
The Pt interdigitated electrodes (IDEs) are patterned over the CdS or CdS:SiO2 films using conventional photolithography to form a metal–semiconductor–metal (MSM) structure. The gas sensing measurements were carried out. The LPG gas sensing characteristics of the fabricated sensors were studied at RT = 20 °C and relative humidity of ≈60% in a specially designed “Gas Sensor Measurement and Calibration system (GSMCS)” having a glass test chamber of 11 liter volume. Different concentrations of the LPG gas (1 to 1000 ppm) were introduced into the glass test chamber using calibrated leaks through needle valves. A pressure of ≈10−3 torr was first created in the test chamber using a rotary pump and was measured by a Pirani gauge; subsequently, a mixture of the known concentrations of the target gas and clean (dry synthetic) air were introduced till the test chamber acquired atmospheric pressure. At the time of recovery of the sensor, the target gas was flushed out of the test chamber and clean dry air was introduced.The gas-sensing characteristics were recorded with reference to time at different operating temperatures and gas concentrations. The change in the electrical resistance was recorded after every second using a data acquisition system consisting of a digital multi-meter (model: Keithley 2400) interfaced with a computer and used as a measure of the gas response at various temperatures. The sensor response (% S) for a gas is defined as follows:5,7,11
 | (1) |
3. Results and discussion
3.1 Surface morphological studies
The surface micrographs of nc-CdS and CdS:SiO2 NCTFs are depicted in Fig. 2(a) and (b–d), respectively. It is evident from Fig. 2(a) that the surface of the nc-CdS thin film is very smooth with negligible porosity and it is difficult to estimate the particle size. However, the average particle size (APS) values estimated by other techniques such as AFM and TEM are ∼9.4 nm and 9.16 nm, respectively, and reported elsewhere12 (please see ESI Fig. S1†). The morphology of the pristine CdS:SiO2 nanocomposite film shows micron-sized balls of SiO2 covered with gel-like CdS or web-like structures (Fig. 2(b)). The growth of CdS NDs can be seen over silica MBs inside the web-like structure in the case of CdS:SiO2 NCTFs annealed at 400 °C (Fig. 2(c)). It is evident from Fig. 2(c) that SiO2 MBs are covered/decorated with highly dense CdS NDs with good porosity. Furthermore, the rise in the annealing temperature from 400 °C to 500 °C results in reduction in the density of CdS NDs on the surface of SiO2 MBs along with reduction in the porosity and evaporation of the web-like structures.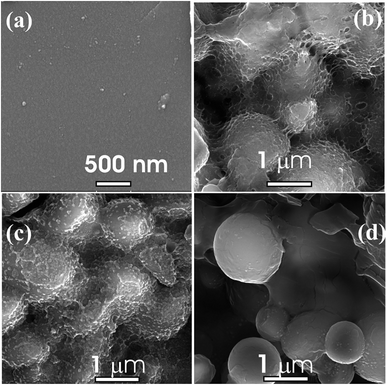 | ||
| Fig. 2 FESEM micrographs of (a) nc-CdS and (b–d) pristine, annealed at 400 °C and anealed at 500 °C CdS:SiO2 NCTFs respectively. | ||
The energy-dispersive X-ray (EDX) spectra of CdS:SiO2 NCTFs annealed at 400 °C and 500 °C taken at different regions are shown in Fig. 3(a–d). As illustrated in Fig. 3(a–d), we have recorded EDX at two different positions: one on the nanodroplet-rich region and the other on the microball. We found that the elemental atomic percentage for both the samples was nearly the same when EDX was recorded at either the nanodroplet-rich region or the microball. However, the atomic percentages of elements were different at different points of measurement, i.e., nanodroplet and microball. The atomic percentages of elements like Si and O were relatively higher for the microballs than that for the nanodroplet-rich region. The atomic percent values of Cd, S, O and Si were estimated to be ∼4.2, 3.8, 63.7, and 28.3, respectively, for the nanodroplets; moreover, these values were ∼3.0, 2.5, 65.8, and 28.7, respectively, for the microballs more or less irrespective of the annealing temperature. The presence of Au was due to the coating of gold (Au) on the samples for SEM measurements.
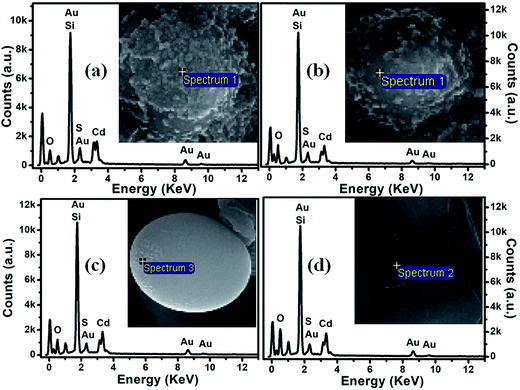 | ||
| Fig. 3 EDX spectra for CdS:SiO2 films annealed at 400 °C (a and b) and 500 °C (c and d). Inset: FESEM images with a pointer from where the EDX is taken. | ||
3.2 Gas sensing performance of the sensor
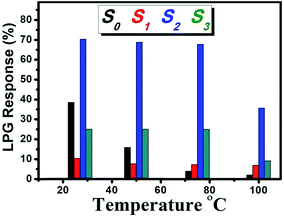
Fig. 5 shows the temperature-dependent LPG responses of different sensors under 1000 ppm gas concentration. The highest response observed was ∼71% for S2 at room temperature (RT); it remained constant up to the operating temperature (OT) of 75 °C and then decreased to ∼35% at OT of 100 °C, which is approximately seven times and three times the responses of S1 and S3, respectively, over the entire range of OT. Here, it is noticeable that the responses of all the composite films remained nearly stable up to OT of 75 °C. Although the response from S0 at RT was almost half (∼38%) the response of S2, it was still quite good compared to those of other composite films. However, the problem with S0 is the consistent weakening of response with OT, which limits its performance as a gas sensor above RT. The response from S0 remained roughly one third at OT of 50 °C and only 2% at OT of 100 °C. In contrast, S1, S2, and S3 could work up to OT of 75 °C with a negligible drop in the response, which indicated the capability of the sustainable gas response of the SiO2 matrix as far as OT is concerned.
This inquisitive behavior of S1, S2, and S3 towards LPG depends on the microstructures of the films and can be explained as follows: the highest response shown by S2 is because of high porosity due to the presence of CdS NDs, which offers a high surface area for the reaction with a target gas that correlates with the high response. Furthermore, the web-like structure may lead to significant enhancement in the dangling bonds or improved surface activity for the reaction of the reducing gas with the adsorbed oxygen molecules. In addition, a fast transport of gas molecules is feasible through the porous structures; thereby, the sensor responds faster. The degradation in the response observed for pristine S1 relative to that observed for S2 is because of the absence of no clear evolution of CdS nanoparticles (Fig. 2(b) and ESI Fig. S2†) or the generation of the crystalline phase of CdS, as observed by XRD and Raman spectroscopy (please see ESI Fig. S3†). However, S3 exhibits a lower response due to a lack of the web-like structure along with reduction in the density of CdS droplets/particles on the surface of SiO2 balls (Fig. 2(d)). Moreover, the diminished response monitored from S0 compared to that of S2 is due to the exposure of less surface to the targeting gas, which is due to the smooth/nonporous surface of the film (Fig. 2(a)). Therefore, only S2 was used to carry out further gas sensing studies.
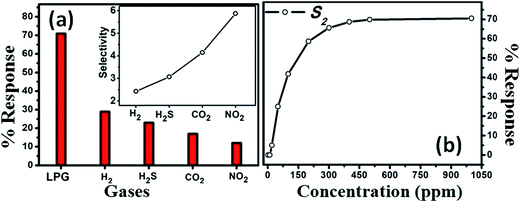
To estimate the selectivity of S2 to LPG at optimum OT, i.e., RT, the gas responses towards H2, H2S, CO2, and NO2 at a concentration of 1000 ppm each were also measured, as shown in the inset of Fig. 6a. The selectivity coefficient for S2 was the lowest for H2 (∼2.5) and highest for NO2 (∼5.9). A higher K value implies a more selective response to LPG under exposure to other gases. For instance, the gas response to LPG was ∼5.9 times higher than that for NO2. Thus, the experimental results indicate that the sensor presented here has good selectivity for LPG.
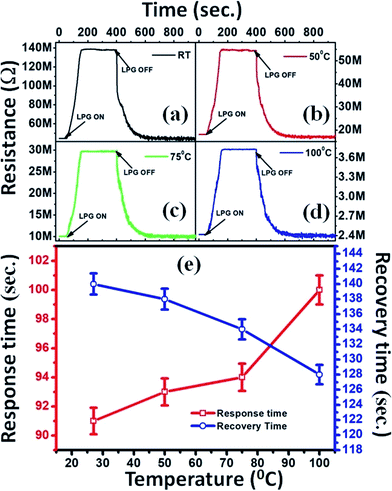 | ||
| Fig. 7 (a–d) Reproducibility curves at different operating temperatures and (e) variation of response and recovery times with operating temperatures of LPG sensor under 1000 ppm concentration. | ||
The response and recovery times are crucial parameters for a sensor. The response time (tr) is measured as the time taken by the sensor to acquire 90% of its maximum resistance value in the presence of the target gas. In contrast, the time taken by the sensor to reacquire about 10% of the higher value of its initial resistance in the absence of gas is considered as the recovery time (td).9Fig. 7(e) demonstrates the variation in tr and td as a function of OT under exposure to 1000 ppm of LPG. It is observed that tr and td follow opposite trends: the former consistently increases, whereas the latter decreases with an increase in OT. The optimal tr value observed here is 91 s at RT, whereas td is 128 s at OT of 100 °C. However, td at RT is slightly larger (∼140 s) than optimal td. For comparison, we have also recorded the reproducibility curve for S0 (ESI Fig. S4†); we found that the values of tr and td for S2 are much better than those (tr = 256 s and td = 466 s) estimated for S0.
| Sensing material | Sensitivity/% response | Response/recovery time (s) | LPG conc. (ppm) | Detectivity (ppm)/stability (%) | Ref. |
|---|---|---|---|---|---|
| n-CdS/p-polyaniline heterojunction | 80 | 105/165 | 1040 | 95% after 30 days | 6 |
| CdS/polyacrylamide and Cd(NO3)2·(AAm)4·2H2O thick films annealed at 450 °C for 2 h | 3.7 GΩ min−1 | 120/480 | 50![[thin space (1/6-em)]](https://www.rsc.org/images/entities/char_2009.gif) 000 000 |
97% after 30 days | 7 |
| CdS nanowires with PbS nanoparticle surface | 60 | 102/75 | 1200 | 93% after 10 days | 8 |
| PEDOT:PSS shell on CdS nanowires | 58.9 | 126/109 | 900 | 94% after 10 days | 9 |
| Cu2SnS3/CdS | 56 | 31/56 | 780 | 95% after 60 days | 10 |
| ZnSnO3/ZnO nanowire | 11 | ||||
| n-CdTe/p-polyaniline | 67.7 | 80/200 | 1400 | 16 | |
| Copper ferrite system (CuFe2O4) | 0.70 MV min−1 & 2.6 | 30/200 | 10![[thin space (1/6-em)]](https://www.rsc.org/images/entities/char_2009.gif) 000 000 |
17 | |
| Perovskite type neodymium iron oxide film (NdFeO3) | 0.47 MΩ s−1 | 60/90 | 50![[thin space (1/6-em)]](https://www.rsc.org/images/entities/char_2009.gif) 000 000 |
18 | |
| Nanorods and mixed shaped copper ferrite (CuFe2O4) | 2.6 | 150/510 | 10![[thin space (1/6-em)]](https://www.rsc.org/images/entities/char_2009.gif) 000 000 |
19 | |
| p-Polyaniline/n-TiO2 heterojunction | 63 | 140/180 | 1000 | 20 | |
| p-Polyaniline/n-ZnO thin film heterojunction | 81 | 100/150 | 1040 | 90% after 30 days | 21 |
| SnO2 thin film sensor loaded with Pt catalyst clusters under UV radiation | 44 | 520/620 | 200 | No significant change after 60 days | 22 |
| Nanonail-structured ferric oxide thick film | 50 | 120/150 | 20![[thin space (1/6-em)]](https://www.rsc.org/images/entities/char_2009.gif) 000 000 |
23 | |
| Polypyrrole (Ppy)/TiO2 heterojunction | 55 | 112/131 | 1040 | 24 | |
| Conductive cotton threads functionalized using carbon nanotubes (CNTs) and PANI/g-Fe2O3 nanostructures | 0.91 | 25/40 | 50 | 50 ppm | 25 |
| Cu2ZnSnS4 (CZTS) | 19.3 | 70/40 | 1200 | 96% after 50 days | 26 |
| n-Bi2S3-p-CuSCN heterojunction | 70 | 180/142 | 1370 | 93% after 14 days | 27 |
| p-Polyaniline/n-PbS heterojunction | 70 | 125/200 | 600 | 28 | |
| p-Polyaniline/n-PbS heterojunction | 70 | 780 | 260 ppm | 29 | |
| ZnS/polyacrylamide and PbS/polyacrylamide nanocomposites. | 62 and 285 | 180/480 and 120/300 | 50![[thin space (1/6-em)]](https://www.rsc.org/images/entities/char_2009.gif) 000 000 |
83% and 91% after 90 days | 30 |
| Zinc ferrite nanorods | 140 | 60/300 | 2000 | 93% after 60 days | 31 |
| CdO necklace-like nanobeads decorated with PbS nanoparticles | 51 | 150/134 | 1176 | 94.5% after 8 days | 32 |
| ZnO–TiO2-PANI composite | 87 | 99/118 | 2000 | 33 | |
| CdS:SiO2 NCTF annealed at 400 °C (S2) | 71 | 91/140 | 1000 | 20 ppm/97% after 60 days | Present work |
| O2↑ ↔ O2(ads) | (2) |
| O2(ads) + e− ↔ O2(ads)− | (3) |
| O2(ads)− + e− → 2O(ads)− | (4) |
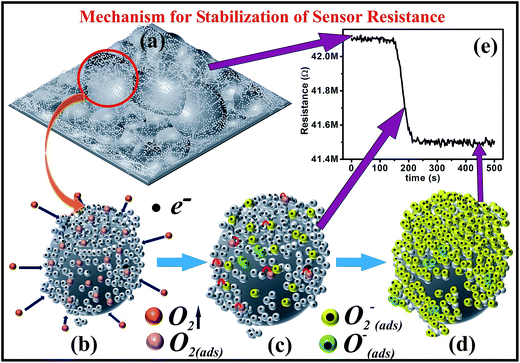
In this way, the channel conduction is reduced due to the generation of a low-conductive depletion layer near the surface. For sensors that are operable at RT, adsorbed O2− ions on the sensor's surface are crucial to improve the receptor capacity of the sensor and thereby its sensing response.33 The equilibrium of the chemisorption process (state of saturation) is achieved as a result of the stabilization of surface resistance (Ra). The procedure for the stabilization of a sensors' resistance (for S2) is shown in Fig. 9 through different steps. A schematic of the surface morphology of S2 is shown in Fig. 9a; Fig. 9b shows magnification of the encircled portion (CdS NDs over SiO2 MB) with the adsorption of oxygen molecules from the ambient and thermally excited conduction electrons. The electron donation by the sensor to the oxygen and chemisorption of the oxygen molecules/atoms on the surface of the sensor result in a transient state in the resistance, as represented by Fig. 9c. Fig. 9d shows the state when all the conduction electrons are captured by oxygen molecules, i.e., the saturation state of the sensor's resistance. Finally, Fig. 9e shows the stabilization curve of the sensor's resistance with time.
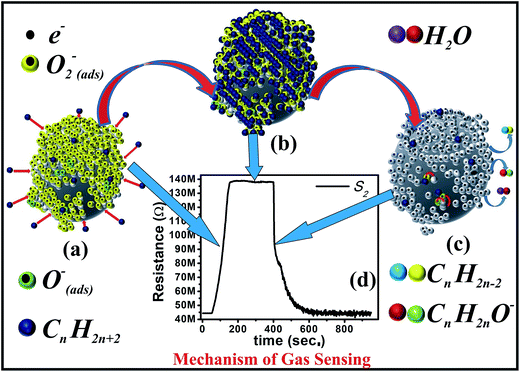
The reducing hydrogen species is bound to the carbon in the constituent molecules such as CH4, C3H8, and C4H10 of LPG; therefore, LPG dissociates into the reactive reducing components on the sensor's surface. Once the sensor is exposed to a reducing gas like LPG, the gas will react with the adsorbed O2− or O−, as shown in eqn (5) and (6) and release the trapped electrons back to the conduction band. This leads to an increased carrier concentration in the n-type semiconductor nc-CdS, which results in decrease in the resistance of the sensor S0; however, the released electrons from the reaction recombine with the holes in the p-type semiconductors S1, S2, and S3, which increases the resistance.33,34
| CnH2n+2 + O2− → 2H2O + CnH2n−2 + e− | (5) |
| CnH2n+2 + 2O− → H2O + CnH2nO− + e− | (6) |
Fundamentally, the adsorption/desorption of gas molecules on the surface of a sensor is responsible for the change in the resistance of the film. Here, the highest response was exhibited by sensor S2 as compared to those of others, which can be explained as follows: the smooth surface and highly packed CdS nanoparticles construct a nonporous surface and the relatively large particle size reduces the surface-to-volume ratio (Fig. S1 and S3†). As a fused effect, S0 offers less reactive sites for the target gas, which is reflected in terms of the response. The web- or gel-like structure with large porosity in S1 also cannot offer a large surface area to the target gas for the reaction due to the absence of CdS NDs. In contrast, the reduced density of CdS NDs over the surface of SiO2 MBs and reduced porosity are jointly responsible for the less reaction sites for the target gas in S3, which results in a low response. Furthermore, most of the sensors reported in literature are fabricated with the aim of operating either at RT (20 °C) or at a higher temperature. Nevertheless, the sensors that can operate even at lower temperatures than RT are equally important in the perspective of colder regions. The insightful observation of the current study appreciably demonstrates that the sensor presented here may operate at lower OT with either a better or equal response and accomplish the necessity of people residing in relatively colder provinces and save them from LPG leakage-induced fire accidents.
4 Conclusions
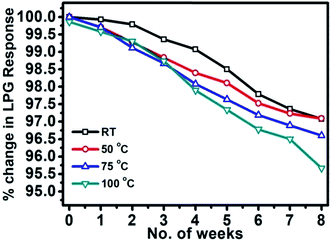
The gas sensing characteristics have been inspected for pulsed laser-deposited nc-CdS and CdS:SiO2 NCTFs. The highest response achieved was ∼71% for CdS:SiO2 NCTF annealed at 400 °C (S2) at room temperature (27 °C) with relative humidity of ≈60% under exposure to 1000 ppm LPG due to the presence of CdS nanodroplets on micron-sized spherical balls of SiO2. The sensor presented here demonstrated fast response and recovery times of 91 s and 140 s, respectively. It exhibited high selectivity for LPG and an outstanding detection limit of up to ∼20 ppm with a response of 5%. The sensor response was sustained up to OT of 75 °C and it showed enduring stability of ∼96% till 8 weeks. The present sensor exhibited either comparable or superior sensing features to those of the sensors reported in literature for LPG detection at room temperature. The performance parameters accomplished here by the sensor are moderately appreciable for practical applications, particularly for the detection of inflammable and hazardous gases such as LPG. The outstanding feature of the present sensor is that it may operate even at lower temperatures than RT (20 °C) with same or higher response, which can save the lives and wealth of the inhabitants of colder areas.Conflicts of interest
There are no conflicts to declare.Acknowledgements
The author NS is grateful to the Council for Scientific and Industrial Research (CSIR), New Delhi, India for providing Senior Research Associateship under the Scientists' Pool Scheme (Pool no. 8920-A). One of the author PK is thankful to Science and Engineering Research Board (SERB), New Delhi, India for providing funding under the project ECR/2016/001468 and University Grants Commission, New Delhi, India for providing financial assistance under the UGC Start-Up scheme (30-352/2017(BSR)).References
- www.nfpa.org .
- http://ncrb.gov.in .
- http://www.academygps.ru .
- Nanomaterials Chemistry: Recent Developments and New Directions, ed. C. N. R. Rao, A Müller, and A. K. Cheetham, Wiley-VCH Verlag GmbH & Co. KGaA, Weinheim, 2007 Search PubMed.
- P. Wang, P. Deng, Y. Nie, Y. Zhao, Y. Zhang, L. Xing and X. Xue, Synthesis of CdS nanorod arrays and their applications in flexible piezo-driven active H2S sensors, Nanotechnology, 2014, 25, 075501 CrossRef PubMed.
- D. S. Dhawale, D. P. Dubal, V. S. Jamadade, R. R. Salunkhe, S. S. Joshi and C. D. Lokhande, Room temperature LPG sensor based on n-CdS/p-polyaniline heterojunction, Sens. Actuators, B, 2010, 145, 205–210 CrossRef CAS.
- S. Singh, M. Singh, B. C. Yadav, P. Tandon, S. I. Pomogailo, G. I. Dzhardimalieva and A. D. Pomogailo, Experimental investigations on liquefied petroleum gas sensing of Cd(NO3)2·(AAm)4·2H2O and CdS/polyacrylamide synthesized via frontal polymerization, Sens. Actuators, B, 2011, 160, 826–834 CrossRef CAS.
- N. B. Sonawane, K. V. Gurav, R. R. Ahire, J. H. Kim and B. R. Sankapal, CdS nanowires with PbS nanoparticles surface coating as room temperature liquefied petroleum gas sensor, Sens. Actuators, A, 2014, 216, 78–83 CrossRef CAS.
- N. B. Sonawane, R. R. Ahire, K. V. Gurav, J. H. Kim and B. R. Sankapal, PEDOT:PSS shell on CdS nanowires: room temperature LPG sensor, J. Alloys Compd., 2014, 592, 1–5 CrossRef CAS.
- A. C. Lokhande, A. A. Yadav, Ju Y. Lee, M. He, S. J. Patil, V. C. Lokhande, C. D. Lokhande and J. H. Kim, Room temperature liquefied petroleum gas sensing using Cu2SnS3/CdS heterojunction, J. Alloys Compd., 2017, 709, 92–103 CrossRef CAS.
- Y. Fu, Y. Nie, Y. Zhao, P. Wang, L. Xing, Y. Zhang and X. Xue, Detecting liquefied petroleum gas (LPG) at room temperature using ZnSnO3/ZnO nanowire piezo-nanogenerator as self-powered gas sensor, ACS Appl. Mater. Interfaces, 2015, 7, 10482–10490 CrossRef CAS.
- P. Kumar, N. Saxena, S. Dewan, F. Singh and V. Gupta, Giant UV-sensitivity of ion beam irradiated nanocrystalline CdS thin films, RSC Adv., 2016, 6, 3642–3649 RSC.
- N. Saxena, P. Kumar and V. Gupta, Target swapping in PLD: An efficient approach for CdS/SiO2 and CdS:Ag(1%)/SiO2 nanocomposite thin films with enhanced luminescent properties, J. Lumin., 2017, 186, 62–67 CrossRef CAS.
- P. Kumar, N. Saxena, F. Singh and A. Agarwal, Nanotwinning in CdS quantum dots, Phys. B, 2012, 407, 3347–3351 CrossRef CAS.
- N. Saxena, P. Kumar and V. Gupta, CdS:SiO2 nanocomposite as a luminescence-based wide range temperature sensor, RSC Adv., 2015, 5, 73545–73551 RSC.
- S. S. Joshi, T. P. Gujar, V. R. Shinde and C. D. Lokhande, Fabrication of n-CdTe/p-polyaniline heterojunction-based room temperature LPG sensor, Sens. Actuators, B, 2008, 132, 349–355 CrossRef CAS.
- S. Singh, B. C. Yadav, V. D. Gupta and P. K. Dwivedi, Investigation on effects of surface morphologies on response of LPG sensor based on nanostructured copper ferrite system, Mater. Res. Bull., 2012, 47, 3538–3547 CrossRef CAS.
- S. Singh, A. Singh, B. C. Yadav and P. K. Dwivedi, Fabrication of nanobeads structured perovskite type neodymium iron oxide film: its structural, optical, electrical and LPG sensing investigations, Sens. Actuators, B, 2013, 177, 730–739 CrossRef CAS.
- S. Singh, B. C. Yadav, R. Prakash, B. Bajaj and J. Rock lee, Synthesis of nanorods and mixed shaped copper ferrite and their applications as liquefied petroleum gas sensor, Appl. Surf. Sci., 2011, 257, 10763–10770 CrossRef CAS.
- D. S. Dhawale, R. R. Salunkhe, U. M. Patil, K. V. Gurav, A. M. More and C. D. Lokhande, Room temperature liquefied petroleum gas (LPG) sensor based on p-polyaniline/n-TiO2 heterojunction, Sens. Actuators, B, 2008, 134, 988–992 CrossRef CAS.
- D. S. Dhawale, D. P. Dubal, A. M. More, T. P. Gujar and C. D. Lokhande, Room temperature liquefied petroleum gas (LPG) sensor, Sens. Actuators, B, 2010, 147, 488–494 CrossRef CAS.
- D. Haridas, A. Chowdhuri, K. Sreenivas and V. Gupta, Enhanced room temperature response of SnO2 thin film sensor loaded with Pt catalyst clusters under UV radiation for LPG, Sens. Actuators, B, 2011, 153, 152–157 CrossRef CAS.
- B. C. Yadav, S. Singh and A. Yadav, Nanonails structured ferric oxide thick film as room temperature liquefied petroleum gas (LPG) sensor, Appl. Surf. Sci., 2011, 257, 1960–1966 CrossRef CAS.
- R. N. Bulakhe, S. V. Patil, P. R. Deshmukh, N. M. Shinde and C. D. Lokhande, Fabrication and performance of polypyrrole (Ppy)/TiO2 heterojunction for room temperature operated LPG sensor, Sens. Actuators, B, 2013, 181, 417–423 CrossRef CAS.
- N. G. Shimpi, D. P. Hansora, R. Yadav and S. Mishra, Performance of hybrid nanostructured conductive cotton threads as LPG sensor at ambient temperature: preparation and analysis, RSC Adv., 2015, 5, 99253–99269 RSC.
- K. V. Gurav, S. W. Shin, U. M. Patil, P. R. Deshmukh, M. P. Suryawanshi, G. L. Agawane, S. M. Pawar, P. S. Patil, J. Y. Lee, C. D. Lokhande and J. H. Kim, Cu2ZnSnS4 (CZTS)-based room temperature liquefied petroleum gas (LPG) sensor, Sens. Actuators, B, 2014, 190, 408–413 CrossRef CAS.
- R. D. Ladhe, P. K. Baviskar, W. W. Tan, J. B. Zhang, C. D. Lokhande and B. R. Sankapal, LPG sensor based on complete inorganic n-Bi2S3-p-CuSCN heterojunction synthesized by a simple chemical route, J. Phys. D: Appl. Phys., 2010, 43, 245302 CrossRef.
- S. V. Patil, P. R. Deshmukh and C. D. Lokhande, Fabrication and liquefied petroleum gas (LPG) sensing performance of p-polyaniline/n-PbS heterojunction at room temperature, Sens. Actuators, B, 2011, 156, 450–455 CrossRef CAS.
- R. N. Bulakhe and C. D. Lokhande, Chemically deposited cubic structured CdO thin films: use in liquefied petroleum gas sensor, Sens. Actuators, B, 2014, 200, 245–250 CrossRef CAS.
- S. Singh, A. Singh, B. C. Yadav, P. Tandon, S. Kumar, R. R. Yadav, S. I. Pomogailo, G. I. Dzhardimalieva and A. D. Pomogailo, Frontal polymerization of acrylamide complex with nanostructured ZnS and PbS: their characterizations and sensing applications, Sens. Actuators, B, 2015, 207, 460–469 CrossRef CAS.
- A. Singh, A. Singh, S. Singh, P. Tandon, B. C. Yadav and R. R. Yadav, Synthesis, characterization and performance of zinc ferrite nanorods for room temperature sensing applications, J. Alloys Compd., 2015, 618, 475–483 CrossRef CAS.
- N. B. Sonawane, P. K. Baviskar, R. R. Ahire and B. R. Sankapal, CdO necklace like nanobeads decorated with PbS nanoparticles room temperature LPG sensor, Mater. Chem. Phys., 2017, 191, 168–172 CrossRef CAS.
- R. K. Sonker, B. C. Yadav, V. Gupta and M. Tomar, Fabrication and characterization of ZnO-TiO2-PANI (ZTP) micro/nanoballs for the detection of flammable and toxic gases, J. Hazard. Mater., 2019, 370, 126–137 CrossRef CAS PubMed.
- K. R. Nemade and S. A. Waghuley, LPG sensing application of graphene/Bi2O3 quantum dots composites, Solid State Sci., 2013, 22, 27–32 CrossRef CAS.
Footnote |
| † Electronic supplementary information (ESI) available. See DOI: 10.1039/c9na00053d |
| This journal is © The Royal Society of Chemistry 2019 |

