 Open Access Article
Creative Commons Attribution 3.0 Unported Licence
Correction: Near-infrared light triggered photothermal therapy and enhanced photodynamic therapy with a tumor-targeting hydrogen peroxide shuttle
Bing
Wang
*a,
Weiming
Lin
a,
Zhengwei
Mao
*b and
Changyou
Gao
b
aDepartment of Polymer Materials, Zhejiang Sci-Tech University, Hangzhou 310018, China. E-mail: wbing388@163.com
bMOE Key Laboratory of Macromolecular Synthesis and Functionalization, Department of Polymer Science and Engineering, Zhejiang University, Hangzhou 310027, China. E-mail: zwmao@zju.edu.cn
First published on 12th September 2024
Abstract
Correction for ‘Near-infrared light triggered photothermal therapy and enhanced photodynamic therapy with a tumor-targeting hydrogen peroxide shuttle’ by Bing Wang et al., J. Mater. Chem. B, 2018, 6, 3145–3155, https://doi.org/10.1039/C8TB00476E.
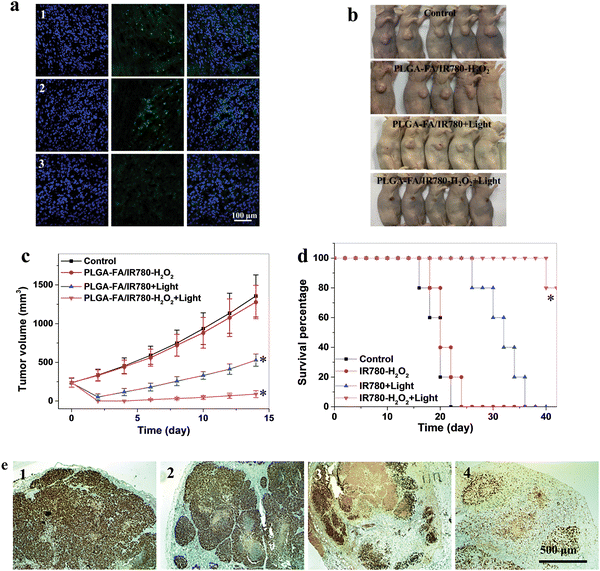
The authors regret errors in two figures in the published article: the Ki67 images of groups “1” and “4” in Fig. 9e, and the H&E images of liver in Fig. 10b were incorrect. The corrected images for Fig. 9 and 10 are shown here (the captions remain unchanged). The authors declare that these errors do not impact the overall findings and conclusions of the article.
The Royal Society of Chemistry apologises for these errors and any consequent inconvenience to authors and readers.
| This journal is © The Royal Society of Chemistry 2024 |


