 Open Access Article
Mint leaf derived carbon dots for dual analyte detection of Fe(III) and ascorbic acid
Varsha
Raveendran
,
Adukamparai Rajukrishnan
Suresh Babu
and
Neeroli Kizhakayil
Renuka
 *
*
Department of Chemistry, University of Calicut, Kerala-673 635, India. E-mail: nkrenu@gmail.com; Fax: +914942400269; Tel: +914942407413
First published on 16th April 2019
Abstract
Highly luminescent carbon dots (CDs) are obtained from mint leaves adopting a simple and cost effective route devoid of additional chemical reagents and functionalization. The as-synthesized CDs are characterized by TEM, FE-SEM, XRD analysis, FTIR, Raman, UV-visible and photoluminescence spectral studies. The results reveal that the CDs have an average diameter of 4 nm with a hydroxyl-rich surface. The luminescence of the dots was excitation dependent and was stable towards variation in the medium. The system could perform as a promising on–off–on fluorescent sensor for the selective and sensitive dual analyte recognition of Fe3+ and AA with a detection limit of 374 nM and 79 nM, respectively. The mechanism of ascorbic acid sensing by the CD–Fe3+ unit is established by identifying the binding sites of the biomolecule with the metal ion by examining the behaviour of the sensor in the presence of ascorbic acid derivatives.
1 Introduction
As a new nanocarbon member, carbon dots (CDs) have evoked much excitement among researchers due to their unique properties including high aqueous solubility, tunable luminescence, facile modification, favourable electronic properties, good conductivity, etc.1–5 Most of the implemented applications of this carbon family member are centred on the unique feature of intense and stable luminescence, which other carbon allotropes lack. The bioimaging field has experienced a leap with the advent of these soluble biocompatible particles. Another area that exploits the said luminescence nature to the maximum is the field of optical sensors. The synthetic routes to obtain CDs come under two categories, namely top down and bottom up methods. The bottom up method refers to the fabrication of CDs from molecular precursors by high temperature and pressure, thermal pyrolysis, etc.2 The top down approach involves cleavage of larger carbon sources into nanosized carbon dots.4 Hydrothermal treatment, the solvothermal method, microwave irradiation, laser ablation, ultrasonication, chemical oxidation, arc discharge, etc constitute different approaches adopted for the fabrication of CDs.1,5 During the last few years researchers have been exploring readily available natural carbon sources like lemon juice,6 tomato,7 pomegranate,8 waste biomass,9 potato,10etc. for the fabrication of carbon dots.CDs, due to the presence of surface functionalities (preferably hydroxyls), can interact with a number of analyte molecules, including biomolecules, metal ions, etc. which in turn modifies the luminescence character, thereby sensing the analyte. Present report is on the application of carbon dots derived from fresh mint leaves as optical sensor for the dual analyte detection of Fe3+ and ascorbic acid (AA), both being significant from the physiological point of view. Iron is the metal present in heme group and plays a vital role in various cell functions11–13 and any abnormality in ferric ion level in blood causes several serious metabolic disorders.14,15 The second analyte, ascorbic acid (vitamin C) is an important vitamin in the human diet which comes under the class of butenolides (a class of lactones) with a four carbon heterocyclic ring structure. They are sometimes considered as oxidized derivatives of furan. The butenolides and their analogues constitute a wide range of the natural compounds of medical and biological importance.16 Ascorbic acid has been employed for the curing of several diseases17,18 and it decreases the risk of free radical damage.14,19 AA has also finds applications in chemical, pharmaceutical and food industries.20 Among the various analytical techniques for monitoring Fe3+ and ascorbic acid, fluorimetric approach is often preferred for its simplicity, convenience and efficiency of the technique.21–26 So far, fluorescent sensing probes like organic dyes, semiconducting quantum dots, metal nanoclusters etc. have been used for the selective and sensitive determination of Fe3+ and AA. Due to their fine luminescent features, carbon dots, have drawn much attention as a novel probe compared to other fluorescent sensors in terms of its accuracy, safe detection, feasible real sample analysis etc.21,22
Fabrication of carbon dot based fluorescent sensors for dual analyte detection has attracted enormous interest. Xu et al. have reported the synthesis of nitrogen doped graphene quantum dots for the dual function determination of Fe3+ and AA through a nanospace confined preparation strategy.14 Ionic liquid functionalized CDs were synthesised from citric acid for the same application.11 Former method demands tedious preparation steps involving strong nitric acid, while the latter is marked by both difficult synthesis strategy as well as higher limit of detection. Shamsipur et al. synthesized green emitting CDs for the same application by employing chemical precursors such as para amino salicylic acid and ethylene glycol dimethacrylate.27 Reports on dual analyte determination of Fe3+ and AA using CDs derived from natural precursors are rare in literature. Here in this work, a facile, cost effective and greener approach is adopted to obtain cyan luminescent CDs from fresh mint leaves by hydrothermal treatment (Fig. 1). Mint leaf also known as mentha is a tender herb which is widely being used all over the world for various health benefits includes aiding digestion, treat dizziness, treating nausea, and headaches. Moreover mint essential oil and menthol are employed commonly in breath fresheners, drinks, antiseptic mouth rinses, desserts, candies etc.28,29 Mint leaves are highly carbonaceous in nature and mainly comprised of large amount of hydrocarbons, which appears to be an ideal carbon source for CDs synthesis. Besides this fact, they are low cost and green in nature.
The as-prepared CDs could serve as an effective sensor for the selective detection of Fe3+ ions through fluorescence quenching, and the luminescence of the combination is enhanced in presence of ascorbic acid. The mechanism of ascorbic acid sensing by the CDs–Fe3+ unit is established by identifying the binding sites of the biomolecule with the metal ion by examining the behaviour of the sensor in presence of ascorbic acid derivatives, namely, 5,6-O-isopropylidene-L-ascorbic acid (b) and 2,3-dimethoxy-5,6-O-isopropylidene-L-ascorbic acid (c) respectively.
2 Experimental section
2.1 Materials
Fresh mint leaves were obtained from a local market and were washed thoroughly before use. Cobalt(II) nitrate hexahydrate, ferrous sulphate heptahydrate, anhydrous ferric chloride, zinc nitrate hexahydrate, lead(II) nitrate, ferrous sulphate and mercury(II) chloride were purchased from Himedia Laboratories Pvt. Ltd, India. Copper chloride, calcium chloride, magnesium chloride and sodium chloride were purchased from Sisco Research Laboratories (SRL) Pvt. Ltd, India. Silver nitrate and cadmium nitrate tetrahydrate, manganous chloride, nickel nitrate, aluminium nitrate nonahydrate, potassium nitrate, potassium carbonate and sodium hydroxide were supplied by Merck Ltd, India. Ascorbic acid, citric acid, methionine, L-glutamic acid, L-cysteine, glycine, glucose and urea were purchased from Himedia Laboratories Pvt. Ltd. Solvents such as acetone, acetyl chloride, hexane, dimethyl sulfoxide were purchased from Merck Ltd, India. Methyl iodide, tetra butyl ammonium bromide and tetra ethyl acetate were supplied by SRL Pvt. Ltd, India. All the commercially available reagent grade chemicals were used as – received.2.2 Synthesis of CDs
5 g of the fresh mint leaves were washed with deionized water and crushed by using a mortar and pestle. The water soluble portion was extracted by dissolving in 40 mL of deionized water aided by stirring for 30 minutes. The solution was subjected to hydrothermal treatment in an autoclave at 200 °C for 5 h. The solution was then cooled and centrifuged for 1 h at 2500 rpm. The brown supernatant containing fluorescent CDs was isolated and kept at 4 °C.2.3 Characterization
The absorbance and fluorescence spectra of the prepared CDs were recorded by using JASCO V-550 spectrophotometer and Cary Eclipse (Agilent Technology) fluorescence spectrophotometer respectively. LZC-4X photoreactor was used for the observation of luminescence nature of the prepared sample. X-ray diffraction (XRD) pattern of the sample was recorded using Rigaku Miniflex-II diffractometer using CuKα radiation, in the scan range of 2θ, 20–80°. The morphology and the particle size were obtained by transmission electron microscopy, TEM (JEOL JEM 2100). Sample for TEM analysis was prepared by dropping aqueous solution of carbon dots on copper grid coated with carbon. The surface morphology and the particle size were further confirmed by field emission scanning electron microscopy (Model: Carl Zeiss Gemini 300 FESEM). Fourier Transmission Infra-Red (FTIR) spectra were obtained using JASCO FTIR-4100 instrument using KBr disc method. Raman spectrum was obtained using LabRam HR-Horiba Jobinyvon Spectrometer using a Raman Microprobe with 532 nm Nd:YAG excitation source.2.4 Procedure for analyte sensing
2.5 Procedure for the synthesis of ascorbic acid derivatives
The two derivatives of L-ascorbic acid namely, 5,6-O-isopropylidene-L-ascorbic acid (Fig. 8b) and 2,3-dimethoxy-5,6-O-isopropylidene-L-ascorbic acid (Fig. 8c) were synthesized and characterized as per the literature procedure.30![[thin space (1/6-em)]](https://www.rsc.org/images/entities/char_2009.gif) :
:![[thin space (1/6-em)]](https://www.rsc.org/images/entities/char_2009.gif) 1), K2CO3 (3.2 g, 23 mM) methyl iodide (1.5 mL, 23 mM) was added dropwise. To this reaction mixture, tetra butyl ammonium bromide (2.0 g) was added and stirring was continued for 14 h. After the completion of the reaction as evidenced by TLC analysis, the solvent was removed under reduced pressure and the crude reaction mixture was portioned between ethyl acetate (15 mL) and water (10 mL). The organic layer was dried over anhydrous Na2SO4 and evaporated under reduced pressure to give a crude mass, which was then chromatographed over silica gel (230–400 mesh) using a gradient of hexane-ethyl acetate (17
1), K2CO3 (3.2 g, 23 mM) methyl iodide (1.5 mL, 23 mM) was added dropwise. To this reaction mixture, tetra butyl ammonium bromide (2.0 g) was added and stirring was continued for 14 h. After the completion of the reaction as evidenced by TLC analysis, the solvent was removed under reduced pressure and the crude reaction mixture was portioned between ethyl acetate (15 mL) and water (10 mL). The organic layer was dried over anhydrous Na2SO4 and evaporated under reduced pressure to give a crude mass, which was then chromatographed over silica gel (230–400 mesh) using a gradient of hexane-ethyl acetate (17![[thin space (1/6-em)]](https://www.rsc.org/images/entities/char_2009.gif) :
:![[thin space (1/6-em)]](https://www.rsc.org/images/entities/char_2009.gif) 3) as eluent to give (c) as pale yellow solid.
3) as eluent to give (c) as pale yellow solid.
3 Results and discussions
3.1 Characterizations of carbon dots
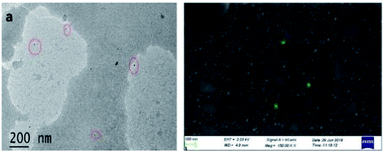
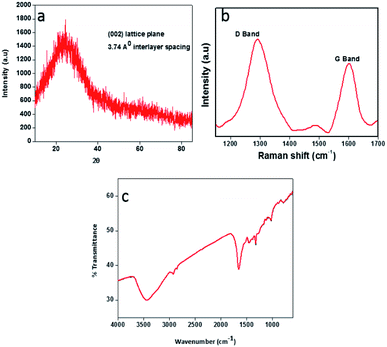
The brownish yellow powder of carbon dots obtained after the freeze drying process transforms in to a hygroscopic brown coloured sticky liquid upon exposure to atmosphere. Such hygroscopic nature of carbon dots has already been discussed in the literature.37–39 The prepared CDs were examined by transmission electron microscopy (TEM) to determine the morphology and core size. TEM image of the CDs is displayed in Fig. 2a. The particle size is observed to be in the range 4–9 nm, with spherical shape. The FE-SEM image (Fig. 2b) also confirms the spherical nature of CDs with an average diameter of particles in the said range.X-ray diffraction (XRD) pattern of the CDs (Fig. 3a) showed a single broad peak centred at 2θ = 23.58°, which is consistent with the (002) lattice spacing of carbon-based materials with abundant sp3 disorder. The interlayer spacing of 3.74 Å indicates poor crystallization and the presence of more oxygen containing functional groups in the CDs.31–33 The Raman spectrum of the CDs exhibits two peaks at 1293 cm−1 and 1603 cm−1, corresponding to the D and G bands respectively (Fig. 3b). The D band is associated with the vibrations of carbon atoms with dangling bonds in the termination plane of the disordered graphite. The G band is associated with the vibration of sp2 carbon atoms in a two-dimensional (2D) hexagonal lattice. The ratio of ID/IG is 1.30, which is characteristic of the disorder extent and the ratio of sp3/sp2 carbon, implying that there are plenty of structural defects in the CDs.31 Further, the obtained ratio clearly depicts that the nanoparticles formed are amorphous CDs and not graphene quantum dots. FTIR spectrum (Fig. 3c) gives information about surface functionalities of the prepared CDs. The band at 3439 cm−1 is attributed to the O–H stretching vibrations of the surface hydroxyl groups, whereas the bands at 2918 cm−1 and 777 cm−1 correspond to C–H stretching and bending vibrations respectively. The band at 1643 cm−1 and the weak one at 1319 cm−1 arise due to C![[double bond, length as m-dash]](https://www.rsc.org/images/entities/char_e001.gif) O and C–O stretching vibrations of carboxylic ester group, respectively.1,34 The band at 1017 cm−1 signifies to C
O and C–O stretching vibrations of carboxylic ester group, respectively.1,34 The band at 1017 cm−1 signifies to C![[double bond, length as m-dash]](https://www.rsc.org/images/entities/char_e001.gif) O vibrations.35,36
O vibrations.35,36
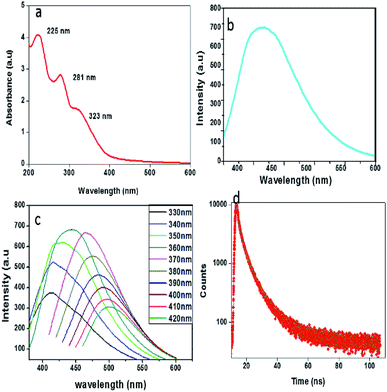
To explore the optical properties of the prepared CDs, UV-visible absorption and photoluminescence spectra were recorded. As depicted in Fig. 4a, the absorption spectrum shows three bands at 225 nm, 281 nm and 323 nm. The absorption peaks at 225 nm and 281 nm are assigned to π–π* transitions of C![[double bond, length as m-dash]](https://www.rsc.org/images/entities/char_e001.gif) C bonds and that at 323 nm corresponds to the n–π* transitions of C
C bonds and that at 323 nm corresponds to the n–π* transitions of C![[double bond, length as m-dash]](https://www.rsc.org/images/entities/char_e001.gif) O bonds.40 The system shows an intense PL emission peak centred at 441 nm (cyan colour) when excited at 360 nm (Fig. 4b), indicating the typical luminescent character of the carbon dots. Like most of the CDs, these CDs also exhibit an excitation-dependent photoluminescence (PL) behaviour (Fig. 4c), and it may have resulted from the optical selection of differently sized particles and surface defects.41 The PL decay curve (Fig. 4d) measured at room temperature enables the analysis of the lifetime of the CDs. The calculated average lifetime, τavg (4.93 ns) suggests that the synthesized CDs are suitable for optoelectronic fields as well as biological applications.32 The quantum yield was calculated to be 7.64% by using quinine sulphate as the standard.
O bonds.40 The system shows an intense PL emission peak centred at 441 nm (cyan colour) when excited at 360 nm (Fig. 4b), indicating the typical luminescent character of the carbon dots. Like most of the CDs, these CDs also exhibit an excitation-dependent photoluminescence (PL) behaviour (Fig. 4c), and it may have resulted from the optical selection of differently sized particles and surface defects.41 The PL decay curve (Fig. 4d) measured at room temperature enables the analysis of the lifetime of the CDs. The calculated average lifetime, τavg (4.93 ns) suggests that the synthesized CDs are suitable for optoelectronic fields as well as biological applications.32 The quantum yield was calculated to be 7.64% by using quinine sulphate as the standard.
The dependence of ionic strength on the fluorescence intensity of the as-prepared CDs was estimated in NaCl solutions of different concentrations (0–100 mM). As shown in Fig. 5a, the PL intensity is almost the same in the above range of ionic concentration. This is particularly a merit for the measurement under high ionic strength conditions, which ensures that CDs have great potential in sensing fields under more complicated conditions and physiological conditions.42 The pH dependence of the fluorescence intensity was studied in the pH range of 3 to 13. The fluorescence intensity of CDs is found to depend strongly on the pH value.43 The emission intensity first increases as the pH value increases from 3, rises and is almost stable in the range of 5–7. The intensity decreases gradually, thereafter. Fig. 5b shows the pH dependence of the luminescence.
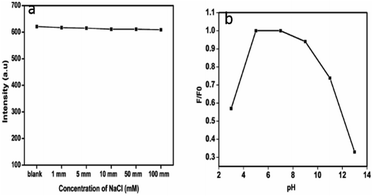 | ||
| Fig. 5 (a) Variation in luminescence of the CDs with different concentrations of NaCl, (b) pH dependence of CDs fluorescence intensity. | ||
3.2 Determination of ferric ion
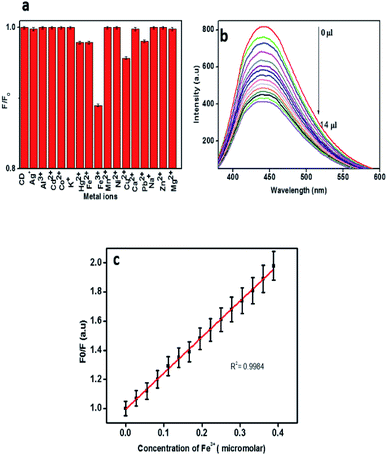
The development of fluorescence based sensors for selective and sensitive detection of metal ions has been chased by various research groups. Carbon dots are excessively used as fluorescence probes for the determination of many of the biologically and environmentally relevant metal ions due to their good biocompatibility, excellent photo stability and low toxicity.5 In order to apply the CDs obtained from mint leaves for analytical purposes, their fluorescence intensity in the presence of different metal ions was monitored. Fig. 6a shows the relative change in the fluorescence intensity of CDs in the presence of various metal ions. Out of the 17 types of metal ions, Cu2+, Hg2+, Fe2+ and Pb2+ caused slight reduction in the fluorescence intensity. Fe3+ ions caused the strongest fluorescence quenching effect on CDs, thereby depicting higher selectivity towards Fe3+ ions than other metal ions. This may be due to the non-specific interactions between the functional groups and the metal ions.1 It is reported that Fe(III) could react with the hydroxyl groups of CDs to form the complex by a special coordination.11,44Fig. 6b shows a steady decline in fluorescence intensity of the carbon dot solution with increasing Fe3+ concentration. The relative fluorescence response of CDs (F0/F) versus concentration of Fe3+ is presented in Fig. 6c, where F0 and F are the fluorescence intensities of CDs in the absence and presence of Fe3+. The correlation coefficient 0.9984 indicates a very good linear relationship. The limit of detection (LOD) was estimated to be 374 nM based on 3σ/slope method, where σ represents the standard deviation. The LOD value obtained for the system for Fe3+ is comparable with those of previously reported systems.
A comparison of the present system with other such sensors is shown in Table 1. Further the analytical application of the as prepared CDs was carried out by employing the CDs as fluorescence probes for the detection of ferric ion in tap water and well water samples by standard addition method. The results are presented in Table 2. The recoveries varied in the range of 90.3–101.6% which demonstrates the applicability and reliability of Fe3+ detection by the CDs sensor.
| Sensing probe for Fe3+ | Linear range (μM) | LOD (μM) | Ref. |
|---|---|---|---|
| Banana derived CDs | 0–50 | 0.21 | 32 |
| Aspartic acid derived GQDs | 0–16 | 0.26 | 45 |
| DL-Malic acid derived CDs | 0–200 | 0.8 | 46 |
| CDs derived from coriander leaf | 0–60 | 0.4 | 1 |
| Tea | 0.25–60 | 0.25 | 44 |
| N,S co doped CDs | 0–3.5 | 0.017 | 47 |
| Mint leaf derived CDs | 0–0.38 | 0.37 | This work |
| Water sample | Added Fe3+ (μM) | Found (μM) | Error (%) | Recovery (%) |
|---|---|---|---|---|
| Tap water | 0.0279 | 0.0256 | 8.2 | 91.75 |
| 0.0558 | 0.0567 | 1.6 | 101.6 | |
| 0.0837 | 0.0849 | 8.1 | 101.43 | |
| Well water | 0.0279 | 0.0252 | 9.6 | 90.3 |
| 0.0558 | 0.0518 | 7.1 | 92.83 | |
| 0.0837 | 0.0769 | 8.12 | 91.8 |
3.3 Determination of ascorbic acid via the fluorescence enhancement of the CDs–Fe3+ probe
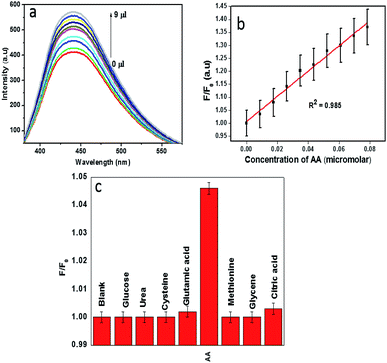
Recent studies reveal that the metal ion based quenched fluorescence of CDs can be effectively recovered by specific biomolecules. Kang's group reported that the quenched fluorescence of GQDs by Cu2+ can be recovered by the addition of ascorbic acid which removes the coordinate bond between Cu2+ and the dots.48,49 We demonstrate CDs–Fe3+ system as an efficient sensor for the sensitive detection of ascorbic acid. Until now, very few works have been carried out in the area of ascorbic acid detection based on a naturally derived carbon dot–Fe3+ system.11,14Fig. 7a shows the fluorescence restoration of CDs–Fe3+ system via the addition of ascorbic acid. As reported by Xu et al., AA is known to remove the coordinate bond between ferric ion and hydroxyl moieties of CDs, thereby restoring the luminescence.14 By monitoring the restored fluorescence of CDs, it is easy to detect ascorbic acid selectively and sensitively. The fluorescence restoration of CDs–Fe3+ system increases linearly with increasing concentration of AA (Fig. 7b). The relative fluorescence intensity (F/F0) versus AA concentration is presented in the Fig. 7c, where F0 and F are the fluorescence intensities of the CDs–Fe3+ system in the absence and presence of ascorbic acid respectively. The linear correlation coefficient value, 0.985 was observed. The limit of detection for AA by this system is estimated to be 79 nM at a signal to-noise ratio of 3.The selective detection of ascorbic acid by the system from a group of biomolecules, urea, glucose, cysteine, glycine, methionine, L-glutamic acid and citric acid is depicted in Fig. 7c. It can be observed that only ascorbic acid can recover the PL intensity up to a significant extent, which clearly indicates that the constructed fluorescent probe was highly selective towards ascorbic acid. A comparison of the performances of this sensor with other relevant sensors was presented in Table 3. To indicate the reliability of CDs–Fe3+ system in AA detection, this sensor was employed for the detection of AA in orange and lemon. The detection results were displayed in Table 4 in which the spiked recoveries are in the range of 89.62–103.4%.
| Sample | Added amount (μM) | Found (μM) | Error (%) | Recovery (%) |
|---|---|---|---|---|
| Orange | 0.0874 | 0.0852 | 2.5 | 97.4 |
| 0.135 | 0.1336 | 10.3 | 98.9 | |
| 0.203 | 0.21 | 3.4 | 103.4 | |
| 0.270 | 0.248 | 8.1 | 91.8 | |
| Lemon | 0.0874 | 0.0837 | 4.2 | 95.7 |
| 0.135 | 0.124 | 8.1 | 91.8 | |
| 0.203 | 0.187 | 7.8 | 92.1 | |
| 0.270 | 0.242 | 10.3 | 89.62 |
3.4 Mode of binding of Fe3+ and ascorbic acid
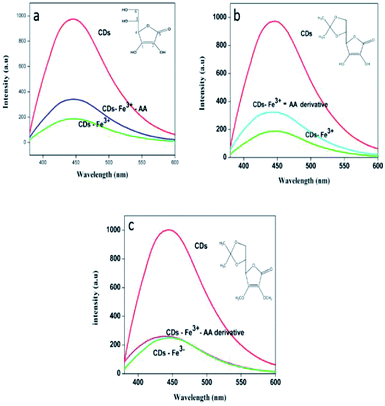
Encouraged by the results obtained, an attempt is made to identify the mode of interaction between ferric ions and the ascorbic acid that enabled the sensing of the latter. To this effect, two derivatives of ascorbic acids, vis. 5,6-O-isopropylidene-L-ascorbic acid, (Fig. 8b), and 2,3-dimethoxy-5,6-O-isopropylidene-L-ascorbic acid (Fig. 8c) were synthesized as mentioned earlier. The fluorescence response of the CDs–Fe3+ system towards AA and their derivatives is shown in the Fig. 9. The PL figures clearly depicts that the quenched fluorescence of CDs by ferric ion is restored in the presence of 5,6-O-isopropylidene-L-ascorbic acid. No change occurred with the derivative 2,3-dimethoxy-5,6-O-isopropylidene-L-ascorbic acid. Thus it is assumed that hydroxyl groups at the sp2 carbon (1 and 2 in a, Fig. 8) atoms of the lactone ring are necessary for the chelation with Fe3+ system55 and thereby leading to photoluminescence enhancement of the system. These hydroxyl groups may be inducing a stronger chelation to Fe3+ thus releasing the CDs free. 2,3-Dimethoxy-5,6-O-isopropylidene-L-ascorbic acid lacks these hydroxyl groups for chelation with Fe3+, owing to which the fluorescence of the sensing unit remain unaltered.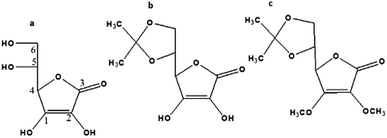 | ||
| Fig. 8 Structure of (a) L-ascorbic acid, (b) 5,6-O-isopropylidene-L-ascorbic acid, (c) 2,3-dimethoxy-5,6-O-isopropylidene-L-ascorbic acid. | ||
4 Conclusions
An on–off–on fluorescent probe for the dual analyte detection of biologically relevant ferric ion and ascorbic acid has been successfully prepared using CDs achieved via a simple green hydrothermal route from mint leaves as the carbon precursor. The prepared CDs are bright cyan luminescent and demonstrated excitation dependent emission behaviour. They are almost stable in high ionic strength environment. Fluorescence of the CDs was quenched by Fe3+ through the coordination between the two, and the quenched fluorescence of the system was restored by the addition of ascorbic acid which removes the coordinate bond between CDs and ferric ion. The limit of detection of ferric ion and AA were 374 nM and 0.079 μM respectively. The mechanism of fluorescence enhancement of CDs–Fe3+ system by AA was confirmed by conducting the fluorescence study with two derivatives of AA. This selective sensing can be applied to detect such butenolides in natural products and further work in this direction is in progress.Conflicts of interest
There are no conflicts to declare.Acknowledgements
VR thank Kerala state council for science and technology (KSCSTE) for their financial support. ARS thank University Grants Commission (UGC) for support under UGC-FRP scheme & University of Calicut, NKR thank Calicut University & CSIF, Calicut University for FE-SEM analysis.References
- A. Sachdev and P. Gopinath, Analyst, 2015, 140, 4260–4269 RSC.
- X. T. Zheng, A. Ananthanarayanan, K. Q. Luo and P. Chen, Small, 2015, 11, 1620–1636 CrossRef CAS.
- Y. Wang and A. Hu, J. Mater. Chem. C, 2014, 2, 6921–6939 RSC.
- V. Sharma, P. Tiwari and S. M. Mobin, J. Mater. Chem. B, 2017, 5, 8904–8924 RSC.
- M. Z. Xie, D. Qu, D. Li, P. Du, X. Jing and Z. Sun, ACS Appl. Mater. Interfaces, 2013, 5, 13242–13247 CrossRef.
- A. Barati, M. Shamsipur, E. Arkan, L. Hosseinzadeh and H. Abdollahi, Mater. Sci. Eng., C, 2015, 47, 325–332 CrossRef CAS.
- H. Miao, L. Wang, Y. Zhuo, Z. Zhou and X. Yang, Biosens. Bioelectron., 2016, 86, 83–89 CrossRef CAS.
- B. Saineelima, S. L. D'souz, S. Jha, R. K. Singhal, H. Basu and S. K. Kailasa, Anal. Methods, 2015, 7, 2373–2378 RSC.
- S. Y. Park, H. U. Lee, E. S. Park, S. C. Lee, J. W. Lee, S. W. Jeong, C. H. Kim, Y. C. Lee, Y. S. Huh and J. Lee, ACS Appl. Mater. Interfaces, 2014, 6, 3365–3370 CrossRef CAS.
- V. N. Mehta, S. Jha, R. K. Singhal and S. K. Kailasa, New J. Chem., 2014, 38, 6152–6160 RSC.
- Z. Xie, X. Sun, J. Jiao and X. Xin, Colloids Surf., A, 2017, 52, 38–44 CrossRef.
- S. Virtanen, A. Simojoki, H. Hartikainen and M. Yli-Halla, Sci. Total Environ., 2014, 485–486 Search PubMed.
- K. Qu, J. Wang, J. Ren and X. Qu, Chem.–Eur. J., 2013, 19, 7243–7249 CrossRef CAS.
- H. Xu, S. Zhou, J. Liu and Y. Wei, RSC Adv., 2018, 8, 5500–5508 RSC.
- Y. Su, B. Shi, S. Liao, Y. Qin, L. Zhang, M. Huang and S. Zhao, Sens. Actuators, B, 2016, 225, 334–339 CrossRef CAS.
- Y. S. Rao, Chem. Rev., 1964, 64(4), 353–388 CrossRef CAS.
- J. S. A. Devi, S. Salini, A. H. Anulekshmi, G. L. Praveen and G. Sony, Sens. Actuators, B, 2017, 246, 943–951 CrossRef.
- J. Liu, Y. Chen, W. Wang, J. M. Liang, S. Ma and X. Chen, J. Agric. Food Chem., 2016, 64(1), 371–380 CrossRef CAS.
- S. H. Zhou, H. B. Xu, W. Gan and Q. H. Yuan, RSC Adv., 2016, 6, 110775–110788 RSC.
- J. Scremin, E. C. M. Barbosa, C. A. R. S. Neto, P. H. C. Camargo, E. Romão Sartori, H. Obata and C. M. G. van den Berg, Anal. Chem., 2001, 73, 2522–2528 CrossRef.
- S. C. Hsu, H. T. Cheng, P. X. Wu, C. J. Weng, K. S. Santiago and J. M. Yeh, Electrochim. Acta, 2017, 238, 246–256 CrossRef CAS.
- M. G. Gioia, P. Andreatta, S. Boschetti and R. Gatti, J. Pharm. Biomed. Anal., 2008, 48, 331–339 CrossRef CAS.
- L. L. Feng, Y. X. Wu, D. L. Zhang, X. X. Hu, J. Zhang, P. Wang, Z. L. Song, X. B. Zhang and W. H. Tan, Anal. Chem., 2017, 89, 4077–4084 CrossRef CAS.
- X. Gao, C. Du, Z. Zhuang and W. Chen, J. Mater. Chem. C, 2016, 4, 6927–6945 RSC.
- A. Sachdev, I. Matai and P. Gopinath, RSC Adv., 2014, 4, 20915–20921 RSC.
- S. Zhao, M. Lan, X. Zhu, H. Xue, T. Ng, X. Meng, C. S. Lee, P. Wang and W. Zhang, ACS Appl. Mater. Interfaces, 2015, 7, 17054–17060 CrossRef CAS.
- M. Shamsipur, K. Molaei, F. Molaabasi, M. Alipour, N. Alizadeh, S. Hosseinkhani and M. Hosseini, Talanta, 2018, 183, 122–130 CrossRef CAS.
- A. Hasani, J Altern. Complement. Med., 2003, 9(2), 243–249 CrossRef.
- H. Guanying, Y. Xing, S. Zhang, R. Wang, M. Yang, C. Wu, Z. Wu and K. Xiao, Int. Immunopharmacol., 2015, 191–197 Search PubMed.
- E. Michael Jung and J. Teresa Shaw, J. Am. Chem. Soc., 1980, 20, 6304–6311 CrossRef; K. Biswajit Singh, S. SurendraBisht and P. Rama Tripath, Beilstein J. Org. Chem., 2006, 24, 1–6 Search PubMed.
- V. Ramanan, S. K. Thiyagarajan, K. Raji, R. Suresh, R. Sekar and P. Ramamurthy, ACS Sustainable Chem. Eng., 2016, 4, 4724–4731 CrossRef CAS.
- R. Vikneswaran, S. Ramesh and R. Yahya, Mater. Lett., 2014, 136, 179–182 CrossRef CAS.
- J. Wei, X. Zhang, Y. Sheng, J. Shen, P. Huang and S. Guo, New J. Chem., 2014, 38, 906–909 RSC.
- V. N. Mehta, S. Jha, R. K. Singhal and S. K. Kailasa, New J. Chem., 2014, 38, 6152–6160 RSC.
- A. E. Tomskaya, M. N. Egorova, A. N. Kapitonov, D. V. Nikolaev, V. I. Popov, A. L. Fedorov and S. A. Smagulova, Phys. Status Solidi B, 2017, 1700222 Search PubMed.
- Z. L. Wu, P. Zhang and M. X. Gao, J. Mater. Chem. B, 2013, 1, 2868 RSC.
- G. Hutton, B. Reuillard, B. C. M. Martindale, C. A. Caputo, W. J. Lockwood, J. N. Butt and E. Reisner, J. Am. Chem. Soc., 2016, 138, 16722–16730 CrossRef CAS.
- S. Hill, D. Alifonso, S. Davis, D. Morgan, M. Berry and M. Galan, Sci. Rep., 2018, 8, 12234 CrossRef.
- T. Meiling, R. rmann, S. Vogel, K. Ebel, C. Nicolas, A. Milosavljević and I. Bald, J. Phys. Chem., 2018, 122, 10217–10230 CAS.
- A. M. Alam, B. Y. Park, Z. K. Ghouri, M. Park and H. Y. Kim, Green Chem., 2015, 17, 3791–3797 RSC.
- J. Peng, W. Gao, B. K. Gupta, Z. Liu, R. Romero-Aburto, L. Ge, L. Song, L. B. Alemany, X. Zhan, G. Gao, S. A. Vithayathil, B. A. Kaipparettu, A. A. Marti, T. Hayashi, J. J. Zhu and P. M. Ajayan, Nano Lett., 2012, 12, 844 CrossRef CAS.
- J. Feng, Y. Ju, J. Liu, H. Zhang and X. Chen, Anal. Chim. Acta, 2015, 857, 153–160 CrossRef.
- S. Sahu, B. Behera, K. T. Maitib and S. Mohapatra, Chem. Commun., 2012, 48, 8835–8837 RSC.
- P. Song, L. Zhang, H. Long, M. Meng, T. Liu, Y. Yi and R. Xi, RSC Adv., 2017, 7, 28637–28646 RSC.
- C. Zhang, Y. Cui, L. Song, X. Liu and Z. Hu, Talanta, 2016, 150, 54–60 CrossRef CAS.
- W. J. Lu, X. J. Gong, M. Nan, Y. Liu, S. M. Shuang and C. Dong, Anal. Chim. Acta, 2015, 898, 116–127 CrossRef CAS.
- C. Bolm, J. Legros, J. L. Paih and L. Zani, Chem. Rev., 2004, 104, 6217–6254 CrossRef CAS PubMed.
- S. Benitez-Martinez and M. Valcarcel, Trends Anal. Chem., 2015, 72, 93–113 CrossRef CAS.
- J. J. Liu, Z. T. Chen, D. S. Tang, Y. B. Wang, L. T. Kang and J. N. Yao, Sens. Actuators, B, 2015, 212, 214–219 CrossRef CAS.
- H. Liu, W. D. Na, Z. P. Liu, X. Q. Chen and X. G. Su, Biosens. Bioelectron., 2017, 92, 229–233 CrossRef CAS.
- Q. Ma, Y. Li, Z. H. Lin, G. C. Tang and X. G. Su, Nanoscale, 2013, 5, 9726–9731 RSC.
- H. J. Meng, D. Q. Yang, Y. F. Tu and J. L. Yan, Talanta, 2017, 165, 346–350 CrossRef CAS.
- M. Ganiga and J. Cyriac, Anal. Bioanal. Chem., 2016, 408, 3699–3706 CrossRef CAS.
- W. J. Niu, D. Shan, R. H. Zhu, S. Y. Deng, S. Cosnier and X. J. Zhang, Carbon, 2016, 96, 1034–1042 CrossRef CAS.
- P. Martinez and D. Uribe, Z. Naturforsch., 1982, 37, 1446–1449 Search PubMed.
| This journal is © The Royal Society of Chemistry 2019 |


