
Improved propane photooxidation activities upon nano Cu2O/TiO2 heterojunction semiconductors at room temperature†
Dan Wangab,
Xiaoyang Panb,
Guangtao Wanga and
Zhiguo Yi*b
aCollege of Physics and Information Engineering, Henan Normal University, Xinxiang, Henan 453007, China
bKey Laboratory of Design and Assembly of Functional Nanostructures & Fujian Provincial Key Laboratory of Nanomaterials, Fujian Institute of Research on the Structure of Matter, Chinese Academy of Sciences, Fuzhou 350002, China. E-mail: zhiguo@fjirsm.ac.cn; Fax: +86-591-83714946; Tel: +86-591-83806523
First published on 10th February 2015
Abstract
Nano Cu2O/TiO2 heterojunctions with different weight percentage of Cu2O were fabricated by a facile impregnating method for propane oxidation at room temperature. The results indicate that the as-formed Cu2O/TiO2 heterojunctions can remarkably improve the propane photooxidation activity. Especially, for the 0.1 wt% Cu2O decorated TiO2 junctions, the activity was triple of that of the commercial P25. Moreover, the stability of Cu2O was significantly improved during the HC photooxidation. A direct Z scheme electrons and holes transfer mode was suggested to account for the improved activity as well as stability of the junctions. This study may provide a new way to improve photocatalytic activities by utilizing cheap and less stable materials.
Introduction
The hydrocarbons (HC) emitted from automobile exhaust is one of the main sources of atmospheric pollutants.1–6 It is manifest that the presence of HC in the environment has an adverse effect on our health. In certain conditions it can generate irritating photochemical smog as well as other more noxious compounds. Although the application of three-way catalysts has achieved great success in removing the emissions from automobile exhausts, unburned HC are still released during the cold start and frequent start of vehicles. This problem is particularly serious in some big cities because of huge vehicle population. Therefore, it is imperative to develop techniques to treat HC pollutants in the atmosphere under ambient conditions.Considering that external energy input is necessary to break the inert C–H and C–C bonds, therefore far much attention has been paid to the development of photocatalytic techniques, which utilizes sunlight as a green and free energy source.7–9 TiO2 is the most intensively investigated photocatalyst.1,3,5,7–9 However, owing to its large band gap as well as the fast charge recombination rate of the photogenerated electron–hole pairs, the activity of TiO2 is still limited for HC cleansing though tremendous efforts10–12 have been made to overcome its drawbacks. Consequently, it continues to be a challenging task to find ways to improve the HC photo-oxidative activity of TiO2.
As is well known, making heterojunction semiconductors will result in “internal electric field” in the junction regions and thus promote charge transfer in the interfacial space. Therefore, coupling the n-type TiO2 with a p-type semiconductor to form p–n junctions is an efficient strategy to improve photoreactions.13–15 Among the p-type semiconductors, Cu2O is highlighted because of its non-toxicity, wide availability, strong reducibility as well as sunlight harvesting ability.16–18 Several examples of Cu2O/TiO2 nanocomposites for either liquid phase degradation or water splitting have been reported.19–24 However, methods to prolong the durability of Cu2O are still widely studied since Cu2O is very unstable when illuminated in aqueous solutions.
In view of the differences of band edge potentials between TiO2 and Cu2O21,23,24 as well as the fact that the generation of active oxygen species ˙O2− and ˙OH radicals is a fundamentally important step for organics photodegradation,25 if we couple the n-type TiO2 with p-type Cu2O with elegantly controlled interface structures and apply the composite to non-aqueous reactions such as the aforementioned HC photooxidation, we may obtain highly efficient HC photooxidation activity with prolonged durability. This method has never been explored, to the best of our knowledge.
Based on the aforementioned considerations, we demonstrate in this study HC photooxidation upon the Cu2O–TiO2 heterojunction structures with two typical HC molecules propane and ethylene. It is found that both the photoactivity of TiO2 and the photo-stability of Cu2O are indeed significantly improved. Moreover, a direct Z scheme electrons and holes transfer mode was suggested for the first time to account for the improved activity as well as stability of the samples.
Experimental section
2.1. Preparation
2.2. Characterization
The crystalline structures of the samples were identified by an X-ray diffraction (XRD) equipment (Rigaku Miniflex II) with Cu Kα radiation. The morphology, composition and microstructure of the samples were investigated by high-resolution transmission electron microscopy (TEM, JEM-2010) with an energy-dispersive X-ray (EDX) analysis attachment. X-ray photoelectron spectroscopy (XPS) was employed to characterize the chemical states of the sample surfaces. UV-visible diffusive reflectance spectra were collected on a Perkin-Elmer Lamda 900 UV/VIS/NIR spectrometer equipped with an integrating sphere assembly using BaSO4 as a reflectance sample. The surface areas of the samples measured by a TriStar II 3020-BET/BJH surface area analyzer varied from 49.6 to 52.4 m2 g−1. In situ diffuse reflectance Fourier transform infrared (FTIR) spectroscopy study was performed on the spectrometer Nexus FT-IR (Thermo Nicolet) by using a diffusive reflectance attachment equipped with a reaction chamber. 128 single beam spectra had been co-added at a resolution of 4 cm−1 and the spectra were presented as Kubelka–Munk function referred to adequate background spectra. The background and sample spectra were taken (the average of 32 accumulated scans) over the frequency range 4000–600 cm−1. The photoluminescence (PL) spectra of the photocatalysts were obtained by a Varian Cary Eclipse spectrometer with an excitation wavelength of 325 nm.2.3. Photocatalytic measurement
Photocatalytic propane and ethylene degradation was carried out in a custom-modified Pyrex reaction cell (volume: 450 mL) under simulated solar light irradiation by a 300 W Xe lamp. In a typical procedure, 0.15 g photocatalysts were spread uniformly on the bottom of the reactor then the reactor was flushed with N2 repeatedly to remove water and CO2 that was adsorbed on the catalyst and the inner wall of the reactor. Subsequently, 5 mL O2 and 90 μL HC were injected into the reactor by a micro-syringe. The initial concentration of HC is 225 ppm (by volume). Prior to the irradiation, the reactor was kept in dark for 2 h to ensure the establishment of an adsorption–desorption equilibrium between the photocatalyst and reactants. The reactor was then irradiated by a 300 W Xe lamp (The Xe lamp spectrum is provided in Fig. S1†) from the top with light intensity of ∼200 mW cm−2. At a certain time interval, 4 mL gas was sampled from the reactor and analyzed by gas chromatographer (GC9720 Fuli) equipped with a HP-Plot/U capillary column, a molecular sieve 13X column, a flame ionization detector (FID) and a thermal conductivity detector (TCD). The degradation percentage of propane is indicated as C/C0. Herein, C is the concentration of propane at sampling time, and C0 is the initial concentration of propane injected.Results and discussion
The XRD patterns of the as-synthesized samples are shown in Fig. 1. The broad diffraction peaks of the samples prepared without the addition of TiO2 (P25) indicate that Cu2O nanocrystals with a cubic structure type were successfully obtained.18 For the Cu2O/TiO2 composites, however, only the diffraction peaks of anatase and rutile TiO2 were detected owing to the low volume fraction of Cu2O.26,27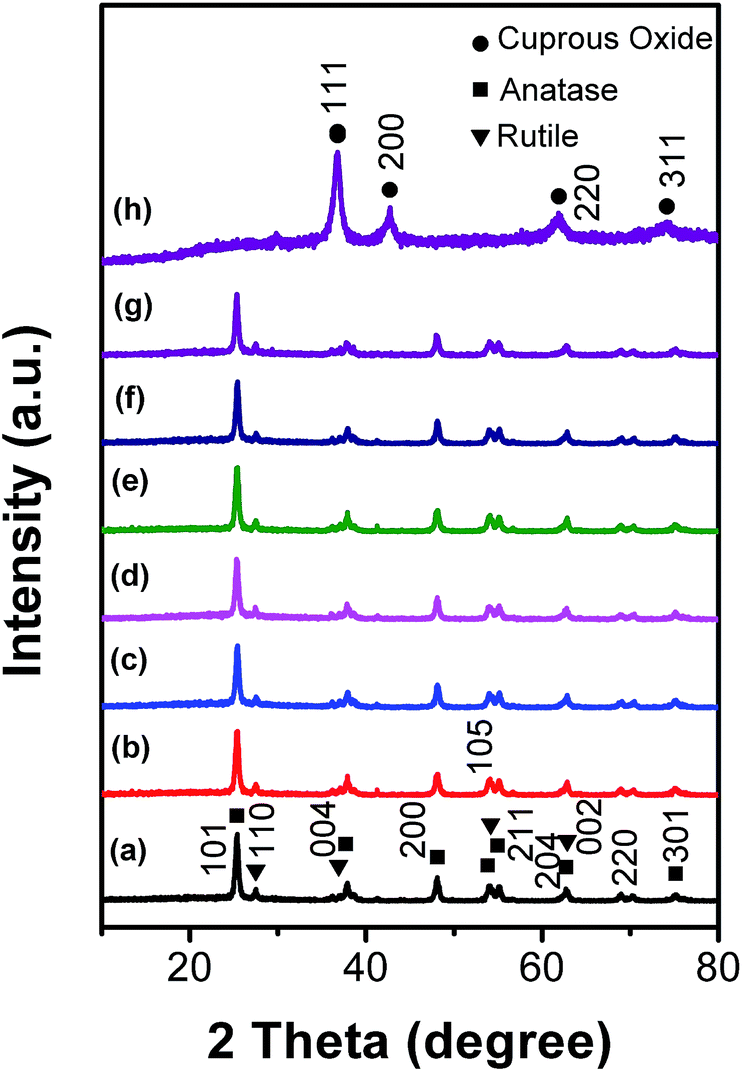 | ||
| Fig. 1 XRD patterns of the Cu2O/TiO2 hetero-structures with different Cu2O weight percentage: (a) 0.0, (b) 0.1, (c) 0.3, (d) 0.5, (e) 1.0, (f) 1.5, (g) 2.0 and (h) 100%. | ||
TEM observation shows uniform polycrystal particles with particle size of ∼25 nm (Fig. 2a). The p–n junction structure of Cu2O/TiO2 was identified by high resolution TEM characterization. As shown in Fig. 2b, the lattice fringes of 0.35 nm and 0.24 nm, corresponding to the (101) plane of anatase TiO2 and (111) plane of cubic phase Cu2O,23,28 were clearly observed. EDX analysis with Mo grids further revealed that the nanoparticles contain the elements of Ti, Cu and O (Fig. 2c).
 | ||
| Fig. 2 Microstructures analysis of the 0.1 wt% Cu2O loaded TiO2 (0.1 CT) sample: (a) TEM. Inset: SAED; (b) HRTEM; (c) EDX. | ||
XPS was employed to further analyze the surface elements' composition as well as their valance states in the samples (Fig. 3). The characteristic signals of Cu 2p, Ti 2p and O 1s were unambiguously identified from the survey spectrum of the 0.1 CT sample, and the surface composition deviates slightly from the normal composition. In addition, the characteristic XPS peaks at 932.8 eV (Cu 2p3/2) and 952.5 eV (Cu 2p1/2) are well consistent with Cu(I) in the Cu2O nanocrystals.23 These results further confirmed that the Cu2O nanocrystals are successfully decorated on the surface of the TiO2 (P25).
 | ||
| Fig. 3 XPS spectra of the 0.1 CT sample before and after the photocatalytic tests: (a) survey; (b) Cu 2p. | ||
Fig. 4 shows the UV-visible diffusive reflectance spectra of TiO2 (P25), Cu2O and Cu2O/TiO2 nanocomposites. The sharp basal absorption edge located at ∼416 nm is consistent with the pristine bandgap of P25 (3.2 eV), while Cu2O shows intensive interband absorption (<∼630 nm) and obvious intraband absorption (>∼630 nm). The Cu2O/TiO2 composites with different mass ratio show three-stage absorption features. The absorption edges close to 410 nm are ascribed to the interband absorption of P25, the absorption bands from 410 to 630 nm are consistent with the interband absorption of Cu2O and the absorption for wavelength greater than ∼630 nm correlate with the intraband absorption of the semiconductors. The difference between the absorption spectra of P25, Cu2O and their composites show that the Cu2O/TiO2 p–n junction structures significantly modify the band edge structures of P25 and Cu2O.
 | ||
| Fig. 4 UV-visible diffusive absorption spectra of commercial TiO2 (P25) and the as prepared Cu2O/TiO2 samples 0.1 CT, 0.3 CT, 0.5 CT, 1.0 CT, 1.5 CT, 2.0 CT, and Cu2O along the arrow. | ||
C3H8 and C2H4 photooxidation were chosen as typical reactions to evaluate performance of the as fabricated samples. Fig. 5a shows the time courses of propane photooxidation upon the as-synthesized Cu2O/TiO2 semiconductors under simulated sunlight illumination. It is known that propane is very stable under normal conditions because of its weak polarity as well as the inert C–C and C–H bonds.1,2,18 The adsorption of propane upon the samples in the dark is negligible. Under illumination, the Cu2O shows almost no photocatalytic activity and P25 shows mild activity for propane photooxidation. However, for the Cu2O decorated samples 0.1 CT, 0.3 CT and 0.5 CT, their activities are obviously improved. Especially, the activities of the 0.1 CT and 0.3 CT samples nearly tripled in comparison with that of the P25. These results indicate that the loading ratio of Cu2O is crucial to optimize the photoactivity of the nanocomposites. The further analysis of the photooxidation processes of propane indicated the reactions follow pseudo-first order reaction kinetics,9 as shown in Fig. 5b. The 0.1 CT sample has the highest apparent rate constant (Fig. S2†).
 | ||
| Fig. 5 (a) Time courses of propane photooxidation upon the as-synthesized Cu2O/TiO2 samples under simulated sunlight illumination; (b) pseudo-first-order kinetic analysis of (a); (c) propane photooxidation upon the 0.1 CT catalyst in a flow mode; (d) in situ IR spectra of propane photooxidation upon the 0.1 CT catalyst collected at different simulated sunlight illumination time. | ||
To examine the mineralization rate, the nanocomposite of 0.1 CT was chosen to carry out the propane photooxidation experiment in a flow mode. In this mode, the sample was put in a quartz reactor with nitrogen–oxygen (20% O2/N2) as a carrier gas and propane (225 ppm) as a reactant gas. The flow rate was maintained at 10 mL min−1. The intensity of the simulated sunlight on the catalyst surface is approximately 200 mW cm−2, which was measured using a calibrated light intensity detector. Before illumination, CO2 in the reaction system was removed by flowing carrier gas. When the lamp is turned on, the amount of propane decreases rapidly to zero. Simultaneously, the concentration of CO2 increases quickly to over 500 ppm (Fig. 5c). When the light is turned off, the concentration of CO2 rapidly decreases to zero; moreover, the amount of propane comes back to a constant value. These results confirmed that propane oxidation is truly driven by a photodriven process. The mineralization rate of propane is identified to be 67% in this reaction. The C2H4 photooxidation experiments showed enhanced activity as well (Fig. S3 and 4†).
In situ FTIR is one of the most powerful techniques for tracing and identifying reaction intermediates adsorbed on the surface of a catalyst.9 Fig. 5d shows the time course of the in situ FTIR spectra collected upon the 0.1 CT catalyst surface during the photo-oxidization of propane. With increasing irradiation time, the intensity of the bands at 2967, 2902, and 2874 cm−1 that are assigned to v(C–H) of C3H8 decreases5 and, the intensity of the bands at 2360 and 2340 cm−1 that correspond to the character mode of CO2 and the 3610 cm−1 band corresponding to water molecules5 gradually increase. These results indicate that propane is oxidized to CO2 during the photocatalytic reaction. In addition, the typical v(C![[double bond, length as m-dash]](https://www.rsc.org/images/entities/char_e001.gif) O) adsorption bands at ∼1700–1710 cm−1 corresponding to carbonyls5,9 indicate that intermediate species, such as acetone, may be formed during the photocatalytic reaction.
O) adsorption bands at ∼1700–1710 cm−1 corresponding to carbonyls5,9 indicate that intermediate species, such as acetone, may be formed during the photocatalytic reaction.
Fig. 6 shows the durability test of propane photooxidation upon the 0.1 CT catalyst under simulated sunlight illumination. Within six cycle reactions, the Cu2O/TiO2 nanocomposite shows almost no deactivation.
 | ||
| Fig. 6 Durability test of propane photooxidation upon the 0.1 CT catalyst under simulated sunlight illumination. | ||
To learn if there is a change in the crystal structure and surface state, the 0.1 CT sample before and after the photooxidation experiments was investigated by XRD and XPS analysis. As presented in Fig. S5,† there is no difference detected in the XRD patterns before and after the photooxidation reactions. In addition, the contrast XPS spectra of Ti 2p and O 1s (Fig. S6†) in conjunction with the results of Cu 2p shown in Fig. 3b (where the binding energy of 932.8 and 932.3 eV is correlated to Cu1+ according to the ref. 23) further indicate that the samples before and after the experiments have less changes and no metallic Cu or Cu2+ (CuO) species were detected.
It is known that the potentials of the reduction and oxidation of Cu2O into Cu0 and CuO lie within its band gap (Fig. 7); moreover, Cu2O often suffers serious photo-corrosion in a liquid phase environment.18,29 However, in our gaseous photooxidation experiments, the Cu2O/TiO2 nanocomposite is rather stable without deactivation. How can we understand this?
 | ||
| Fig. 7 The redox potentials of the photocorrosion reaction of Cu2O with respect to its band edges. | ||
During the photocatalytic reaction, the photogenerated electrons in Cu2O can be efficiently captured by molecular oxygen.29 The reduction potential of O2/OH− (+0.4 V) is far below the edge level of the conduction band of Cu2O, which is also much higher than the reduction potential of Cu+ (Cu+/Cu0: 0.05 V).29 This indicates that the reduction of O2 by the photogenerated electrons of Cu2O is more favorable than that of the self-reduction reaction (Cu+ reduced to Cu0).29 Therefore, the self-reduction reaction of Cu2O reduced to Cu by one electron is restrained.29 In this regard, the limiting factor for the photo-stability of Cu2O is how to effectively consume the photo-excited holes so as to mitigate the self-oxidation reaction (the valence band maximum of Cu2O is +0.6 V vs. NHE).
To examine this point, the photostability of the Cu2O was investigated for comparison purposes. As shown in Fig. S7,† after the gas-phase HC photocatalytic reaction, the red color of Cu2O changed to black color, showing an obvious self-oxidation of Cu2O to CuO. Accompanied with the self-oxidation process, there is less propane oxidation activity (Fig.5). Therefore, we can conclude that the photo-stability of Cu2O can be significantly improved by fabricating the nano Cu2O/TiO2 heterojunction structures. The photogenerated holes of Cu2O must be effectively scavenged by the TiO2 through the interfacial charge transfer.
With regard to the charge transfer mechanism in the Cu2O/TiO2 nanocomposite, two processes may be involved. One is that the photogenerated electrons of the Cu2O are transferred to the conduction band of the TiO2, while the photoexcited holes of TiO2 are migrated to the valence band of TiO2 (Fig. 8a, process I);13–15 The other is that the photogenerated electrons of TiO2 recombine directly with the photogenerated holes of Cu2O through their interfaces (Fig. 8b, process II). If the charge transfer in the Cu2O/TiO2 nanocomposite follows process I, the migration of photogenerated holes of TiO2 to Cu2O will accelerate the photo-corrosion process of Cu2O and ultimately result in the decrease of the photoactivity as well as deactivation of the catalyst, which is incompatible with the experimental results. Therefore, the charge transfer must follow process II.
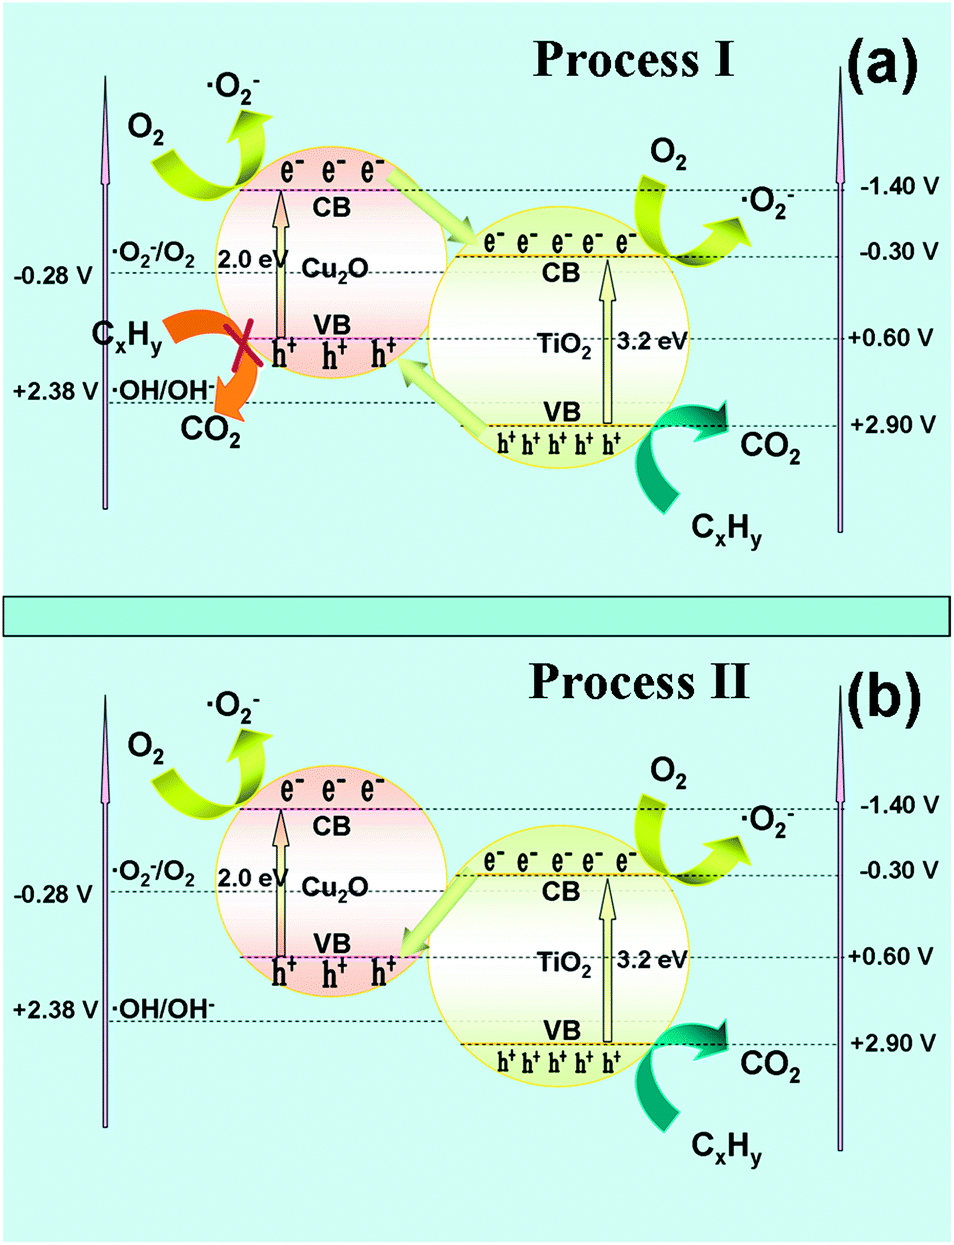 | ||
| Fig. 8 Schematic showing the band edge potentials, the charge transfer and reactions in the Cu2O/TiO2 nanocomposite: process I (a) and process II (b). | ||
Based on the abovementioned results, a scenario for the transfer and reaction of photogenerated electrons and holes in the Cu2O decorated TiO2 junctions is suggested (Fig. 8b) to account for the experimental results. That is, the photogenerated electrons in the Cu2O and most of the electrons in the TiO2 migrate to the surface and reduce oxygen to generate ˙O2−; moreover, the photogenerated holes in the TiO2 oxidize propane to produce CO2. The holes in the valance band of Cu2O and part of the electrons in the conduction band of TiO2 recombine directly at their interfacial region, completing the relay of the “Z scheme”. As a result, the photoactivity of TiO2 and photostability of Cu2O is simultaneously improved based on this charge transfer mode.
The above explanation was further supported by the photoluminescence (PL) spectra measurements. As shown in Fig. 9, the PL peak of TiO2 (P25) centered at ∼410 nm is attributed to the charge recombination between the photogenerated electrons and holes.30,31 By coupling 0.1 wt% Cu2O with the TiO2, the PL intensity of the resultant 0.1 CT is much weaker than that of the same weight of TiO2 (P25), which suggests a weaker recombination of photogenerated electrons and holes in the 0.1 CT sample. The improved activity of the 0.1 CT is thus ascribed to the less recombination of photogenerated charge carriers in TiO2 as well as the stronger reduction activity of Cu2O component. Obviously, the activity differences between the samples can be explained by their differences in photo-excitation as well as carrier transfer processes. Prolonged stability is obtained only when the decoration ratio of Cu2O is such that its photogenerated holes are largely consumed by the photogenerated electrons of TiO2.
 | ||
| Fig. 9 Photoluminescence spectra of the TiO2 (P25) and 0.1 wt% Cu2O/TiO2 (0.1 CT) sample. | ||
Conclusions
In conclusion, using a facile impregnation strategy, Cu2O decorated TiO2 nano junction samples were successfully fabricated and showed efficient propane photodegradation activity and stability under simulated solar light irradiation in ambient conditions. In comparison to the pure Cu2O and TiO2, the Cu2O/TiO2 nanocomposites with certain compositions exhibit improved photoactivity and photostability than that of the two individual components. The enhanced photocatalytic performance is attributed to the efficient charge transfer in the junction regions and the stronger reduction activity of Cu2O. The current study provides a method to improve photocatalytic activity by utilizing cheap and less stable materials.Acknowledgements
This study was financially supported by the National Key Project on Basic Research (Grant no. 2013CB933203), the Natural Science Foundation of China (Grants no. 21373224 and 11274095), and the One Hundred Talent Program of the Chinese Academy of Sciences.Notes and references
- C. T. Brigden, S. Poulston, M. V. Twigg, A. P. Walker and A. J. J. Wilkins, Appl. Catal., B, 2001, 32, 63–71 CrossRef CAS.
- M. Cargnello, J. J. D. Jaén, J. C. H. Garrido, K. Bakhmutsky, T. Montini, J. J. C. Gámez, R. J. Gorte and P. Fornasiero, Science, 2012, 337, 713–717 CrossRef CAS PubMed.
- N. Djeghri, M. Formenti, F. Juillet and S. J. Teichner, Faraday Discuss. Chem. Soc., 1974, 58, 185–193 RSC.
- H. S. Gandhi, G. W. Graham and R. W. McCabe, J. Catal., 2003, 216, 433–442 CrossRef CAS.
- C. Hägglund, B. Kasemo and L. Österlund, J. Phys. Chem. B, 2005, 109, 10886–10895 CrossRef PubMed.
- M. V. Twigg, Appl. Catal., B, 2007, 70, 2–15 CrossRef CAS PubMed.
- M. S. Hamdy, O. Berg, J. C. Jansen, T. Maschmeyer, J. A. Moulijn and G. Mul, Chem.–Eur. J., 2006, 12, 620–628 CrossRef PubMed.
- T. M. Twesme, D. T. Tompkins, M. A. Anderson and T. W. Root, Appl. Catal., B, 2006, 64, 153–160 CrossRef CAS PubMed.
- T. van der Meulen, A. Mattson and L. Österlund, J. Catal., 2007, 251, 131–144 CrossRef CAS PubMed.
- M. A. Fox and M. T. Dulay, Chem. Rev., 1993, 93, 341–357 CrossRef CAS.
- A. Fujishima and X. Zhang, C. R. Chim., 2006, 9, 750–760 CrossRef CAS PubMed.
- K. Woan, G. Pyrgiotakis and W. Sigmund, Adv. Mater., 2009, 21, 2233–2239 CrossRef CAS.
- Y. Liu, Y.-X. Yu and W.-D. Zhang, J. Phys. Chem. C, 2013, 117, 12949–12957 CAS.
- L. Yang, S. Luo, Y. Li, Y. Xiao, Q. Kang and Q. Cai, Environ. Sci. Technol., 2010, 44, 7641–7646 CrossRef CAS PubMed.
- Z. Zhang, C. Shao, X. Li, C. Wang, M. Zhang and Y. Liu, ACS Appl. Mater. Interfaces, 2010, 2, 2915–2923 CAS.
- A. Paracchino, V. Laporte, K. Sivula, M. Grätzel and E. Thimsen, Nat. Mater., 2011, 10, 456–461 CrossRef CAS PubMed.
- W. Siripala, A. Ivanovskaya, T. F. Jaramillo, S.-H. Baeck and E. W. McFarland, Sol. Energy Mater. Sol. Cells, 2003, 77, 229–237 CrossRef CAS.
- P. D. Tran, S. K. Batabyal, S. S. Pramana, J. Barber, L. H. Wong and S. C. J. Loo, Nanoscale, 2012, 4, 3875–3878 RSC.
- W.-Y. Cheng, T.-H. Yu, K.-J. Chao and S.-Y. Lu, ChemCatChem, 2014, 6, 293–300 CrossRef CAS.
- Q. Huang, F. Kang, H. Liu, Q. Li and X. Xiao, J. Mater. Chem. A, 2013, 1, 2418–2425 CAS.
- L. Liu, X. Gu, C. Sun, H. Li, Y. Deng, F. Gao and L. Dong, Nanoscale, 2012, 4, 6351–6359 RSC.
- M. Nolan, Chem. Commun., 2011, 47, 8617–8619 RSC.
- M. Wang, L. Sun, Z. Lin, J. Cai, K. Xie and C. Lin, Energy Environ. Sci., 2013, 6, 1211–1220 CAS.
- Y.-G. Zhang, L.-L. Ma, J.-L. Li and Y. Yu, Environ. Sci. Technol., 2007, 41, 6264–6269 CrossRef CAS.
- C. S. Turchi and D. F. Ollis, J. Catal., 1990, 122, 178–192 CrossRef CAS.
- X. Pan and Y.-J. Xu, ACS Appl. Mater. Interfaces, 2014, 6, 1879–1886 CAS.
- X. Pan and Y.-J. Xu, J. Phys. Chem. C, 2013, 117, 17996–18005 CAS.
- X. Pan and Y.-J. Xu, Appl. Catal., A, 2013, 459, 34–40 CrossRef CAS PubMed.
- L. Huang, F. Peng, H. Yu and H. Wang, Solid State Sci., 2009, 11, 129–138 CrossRef CAS PubMed.
- V. R. de Mendonça, O. F. Lopes, R. P. Fregonesi, T. R. Giraldi and C. Ribeiro, Appl. Surf. Sci., 2014, 298, 182–191 CrossRef PubMed.
- C. Wang, C. Shao, X. Zhang and Y. Liu, Inorg. Chem., 2009, 48, 7261–7268 CrossRef CAS PubMed.
Footnote |
| † Electronic supplementary information (ESI) available: The Xe lamp spectrum; apparent rate constants of propane degradation; time course of C2H4 photodegradation; kinetics of C2H4 degradation; C2H4 degradation and CO2 generation in a flow mode; recycle test of C2H4 degradation; apparent rate constants of C2H4 degradation; XRD patterns of 0.1 CT before and after the HC photodegradation; XPS spectra of the 0.1 CT sample before and after the photodegradation; photograph of the Cu2O before and after the gas phase HC photoreactions. See DOI: 10.1039/c4ra15215h |
| This journal is © The Royal Society of Chemistry 2015 |