
 Open Access Article
 This Open Access Article is licensed under a Creative Commons Attribution-Non Commercial 3.0 Unported Licence
Sustainability of hydrogen manufacturing: a review
Satish
Vitta†

Indian Institute of Technology Bombay, Mumbai 400076, India. E-mail: satish.vitta@iitb.ac.in
First published on 9th September 2024
Abstract
Hydrogen is a highly versatile energy vector, and most importantly, its oxidation, which releases energy, is a green process with no associated emissions. Hence, it is considered a green alternative that can supply energy and simultaneously reduce global warming. This gas, however, does not occur naturally in sufficient quantities and needs to be synthesized using different resources. The two most feasible methods for producing H2 are steam methane reforming and water splitting via electrolysis. Therefore, these two processes were reviewed first, and subsequently, a complete sustainability analysis was performed using currently available data. It has been found that input raw materials such as methane and water will be required in ‘gigatonne’ quantity every year. Although availability of water does not pose supply risk, methane production falls far short of the requirement and becomes a supply risk. The conversion of these into H2 requires energy and results in the production of ‘Gt’ of CO2. For example, the production of 1 Gt of H2 using the steam methane reforming process requires ∼3.6 EJ of energy and releases ∼10 Gt of CO2. In contrast, water splitting electrolysis requires ∼198 EJ of energy and releases anywhere from 102 Gt to 220 Gt of CO2, depending on the electricity generation mix. Additionally, they have ecological impacts in the form of acidification, marine toxicity, particulate emissions and so on, which affect all life forms on the earth. This analysis clearly shows that complete transitioning to H2-based energy supply is unsustainable and only a fraction of the energy needs can be supplemented.
Sustainability spotlightHydrogen is a highly versatile energy vector, and its combustion to release energy produces water without any associated emissions. Hence, there has been a strong push to transition to hydrogen as the sole energy carrier which has the potential to limit/arrest the global warming phenomenon. This has essentially resulted in the term ‘hydrogen economy’, which is being discussed around the world. In this context and current scenario, it has become highly relevant and timely to assess the environmental and ecological sustainability of transitioning to this energy source. This review has therefore been undertaken to assess the sustainability of large-scale hydrogen production, which will be essential for energy transition. |
1. Introduction
1.1. Brief history
Hydrogen is the most abundant element on the earth and in the universe as far as current knowledge goes. On the earth, it is present mainly in a combined form with other elements, mostly oxygen and carbon. In the universe, it is present as a fuel that sustains and powers stars such as the sun. The presence of hydrogen on the earth was discovered way back in the 15th century, but it was only in the 18th century that it was called ‘hydrogen’, meaning ‘water former’, by the French chemist Antoine Lavoisier.1 All the elements in the periodic table originate from hydrogen, the building block. It is the starting element in the periodic table with just 1 electron and 1 proton and is commonly perceived to exist only as a gas. Yet, this gas has gained considerable interest lately across the world, and there are worldwide discussions regarding an economy that is powered solely by this element, a ‘hydrogen economy’.2–13 Therefore, the question arises—is this all only ‘empty talk’ or is there a solid substance behind these discussions. Before addressing this question, it is important to understand some basic aspects of this element hydrogen (H2).Hydrogen is the smallest and lightest element known, which is highly unstable in monoatomic form and hence exits in the diatomic form, H2, as a molecule. In the presence of elements such as oxygen and carbon, the monoatomic form is unstable and combines to form compounds such as water and hydrocarbons, and hence, it has been predicted to be not commonly occurring even in molecular form. This notion, however, has been recently challenged after the discovery of several naturally occurring sources/deposits as well as constantly forming sources.14,15 The exact amount of naturally occurring H2 is not clearly known as it is being actively explored, and the current estimates for the flux of gas that emanates from the geological formations vary from 0.1–10 Mt per year.14,16–18 Furthermore, H2 can and is produced from various sources – gas, liquid and solid, and it is used extensively in applications varying from fertilizers for agriculture to fuels for space shuttle. The growth in the consumption of H2 since 1975 for various applications is shown in Fig. 1. It can be seen that the use of H2 for methanol production, an alternate fuel, has been steadily increasing including for other applications. The amount of H2 produced from natural resources such as natural gas or biomass or coal for these applications has reached about 120 Mt in the year 2022 and is growing.
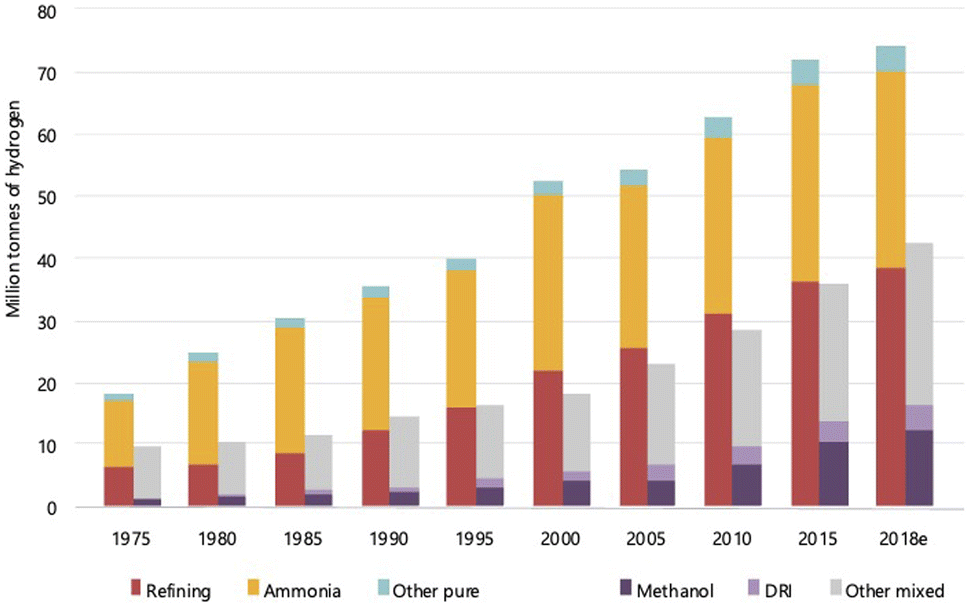 | ||
| Fig. 1 World consumption of H2 for different applications, ranging from ammonia manufacturing to direct reduction of iron ores (DRI). Refining is for petrochemicals, while methanol is an alternate fuel made using H2.6 The world consumption has increased steadily from ∼30 Mt in 1975 to 120 Mt in 2018 with refining and ammonia production being the major users. | ||
1.2. Colors of H2
Before we proceed to discuss the various aspects of H2, it is important to understand the different variants of H2 and their environmental connection. Since H2 can be produced from various sources, both non-renewable and renewable and the source of energy for this production can again be non-renewable or renewable, distinction has been made by attributing different colors.19–22 It should be noted that the color coding of H2 is not unique and there is no universal agreement for the color codes. This has been done primarily to distinguish the different ways of production. The different colors and attributes are shown schematically in Fig. 2. First, the naturally occurring H2 gas, its color coded ‘Gold’ as it is pristine, does not require any special processing, which results in environmental emissions. Another source of H2 which does not result in any emissions is the process of ‘serpentinization’, wherein water coming into contact with ferrous salts of Fe, FeO, leads to H2 release according to the following reaction:| 2FeO(s) + H2O(l) → Fe2O3(s) + H2(g) − ΔH | (1) |
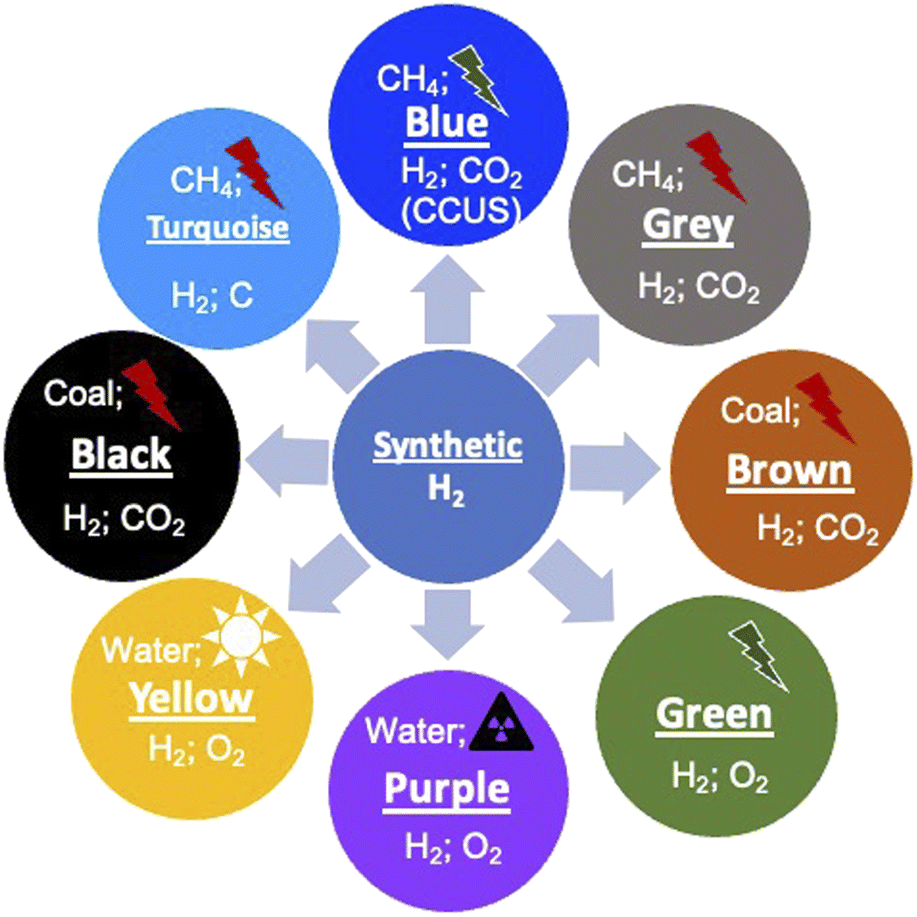 | ||
| Fig. 2 H2 can be produced from a wide variety of natural resources – non-renewable such as natural gas and coal and renewable such as water. Depending on the method of production and CO2(e) emission potential, it has been attributed different colors, which are shown here along with the method of production. Naturally occurring H2 can also be of different origins, and depending on this, it has also been color coded. The exact definition of each of these variants is given in the text. | ||
This reaction requires suitable temperature and pressure and has been known to occur in sub-surface terrains with Fe-containing rocks, typically magnesium silicates. This H2 is color coded as being ‘White’ and has been found in many locations across the earth. Since this is a naturally occurring reaction, the H2 content is generally low and is normally mixed with natural gas, CH4. If this process can be externally stimulated by pro-actively pursuing such rock formations, water hydrolysis can be performed naturally and this form of H2 is referred to as ‘Orange’. This method of production is being pursued and developed actively across the world and has the potential to become a major renewable source. Currently, H2 is produced on an industrial scale using naturally occurring methane gas as the source, and this process is generally termed the reforming process. Since this process results in the emission of 1 mole of CO2 for 2 moles of H2 produced, it is referred to as ‘Grey’ H2. However, if this CO2 is completely captured and sequestered or utilized (CCUS), the resulting H2 is referred to as ‘Blue’. A nearly emission-free process of producing H2 will be using renewable energy resources such as sun, wind and hydroelectricity to reform methane and subsequently sequester the emitted CO2. Currently, significant efforts are being made to scale up this process for large-scale production. If H2 is produced from coal using gasification as the process, it is colored either ‘Brown’ or ‘Black’ depending on whether the coal is lignitic or non-lignitic in nature, respectively. H2 can also be produced by the pyrolysis of natural gas without emitting CO2 but producing solid C and this is color coded ‘Turquoise’. The sources of H2 in the above-mentioned schemes are naturally occurring fossil fuels. Another nearly infinite source however is water (H2O), which can be split into its constituents. If the source of energy for this splitting is nuclear, the resulting H2 is referred to as ‘Purple/Pink’. Another most often discussed hydrogen production route is the splitting of water using completely renewable electricity generation schemes such as solar, wind or hydroelectric. This form is color coded ‘Green’ as it has emissions essentially due to the installation and operation of different electricity generation schemes. These color schemes indeed show the multiplicity of producing H2 and a variety of processes feasible to produce the gas. All the different forms have varying degrees of greenhouse gas emissions at different stages of production (Table 2), clearly showing that completely emission-free hydrogen is not possible. If one were to transition to H2 and a H2 economy, these production processes need to be significantly scaled up. The flip side however is that the environmental footprint of these technologies should be significantly reduced or even eliminated completely. This makes it imperative to understand these processes and evaluate their environmental impact and long-term sustainability. The different large-scale production processes that are known currently, which have the potential to be scaled-up, are discussed below.
1.3. Hydrogen – gas, liquid or solid
H2 as we know exists in a gaseous form under normal temperature and pressure conditions. Since this is the lightest element known with a density of 0.08 kg N m−3 under normal conditions, it becomes extremely ‘voluminous’ to handle large quantities required for large-scale utilization in a hydrogen economy scenario. Hence, it becomes important to understand the conditions under which it can exist in a higher density form than the gaseous state, such as a liquid or a solid.23,24 The pressure and temperature dependence of existence of the different forms – gas, liquid or solid, is shown in Fig. 3, the phase stability diagram.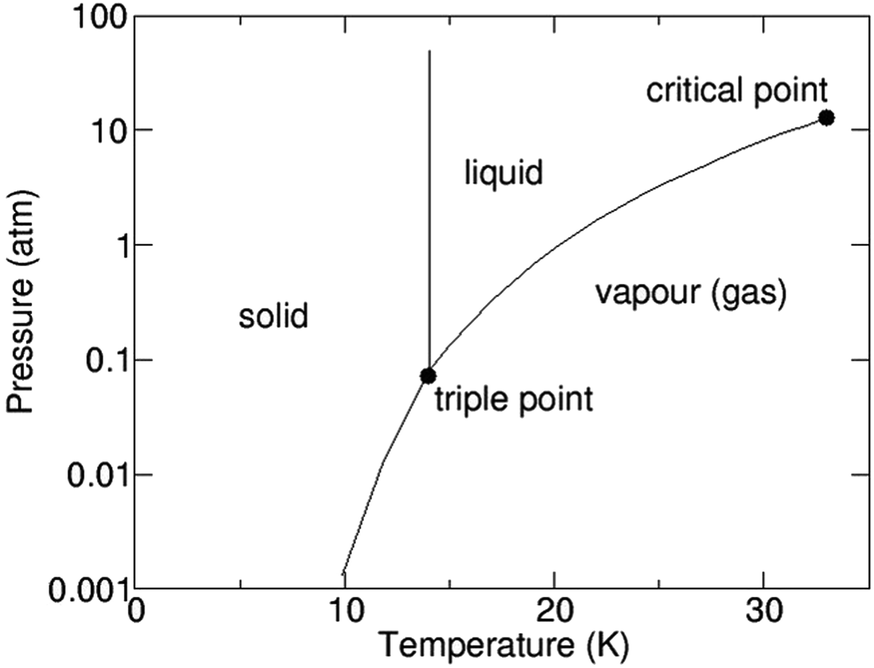 | ||
| Fig. 3 Pressure–temperature or phase stability diagram for H2 shows the temperature–pressure fields, where it exists as gas, liquid or solid. It can be seen that extremely low temperatures and high pressures will be required to transform from one phase to another, including the solid phase. There are several variants within the solid and liquid phases and these are not shown here for simplicity. At room temperature and atmospheric pressure, it exists in the gaseous state. | ||
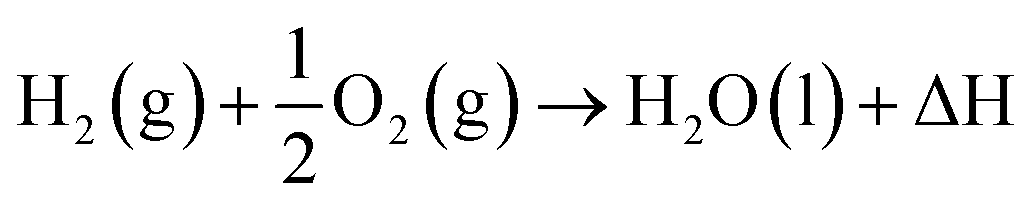
If the gas is cooled at an atmospheric pressure of 105 Pa (1 atm), it condenses into a liquid at ∼20 K (−253 °C), and if cooled further to <14 K (–259 °C), it undergoes transition to a solid state. These transition temperatures depend on pressure but require the gas to be cooled to at least 33 K (−240 °C) to transform at very high pressures. The density of H2 changes by about 3 orders of magnitude to ∼71 kg N m−3 on transforming to the liquid state (Table 1),25 and thus, enhances its transportability as well as its energy density. The energy content of H2, a technologically important parameter, is defined as the ‘heating value’ (HV) when it is converted into H2O upon exposure to oxygen. The corresponding exothermic chemical reaction is written as follows:
 | (2) |
| Property | Value |
|---|---|
| Density (gas) | 8.988 × 10⁻⁵ g cm−3 |
| Density (liquid) | 70.8 × 10⁻³ g cm−3 |
| Higher heating value (HHV) | 142 MJ kg−1/12.77 MJ m−3/39.45 kW h kg−1/3.946 kW h m−3 |
| Lower heating value (LHV) | 120 MJ kg−1/10.79 MJ m−3/33.33 kW h kg−1/2.99 kW h m−3 |
| Energy density of gasoline | 46 MJ kg−1/12.2 kW h kg−1/9.7 × 103 kW h m−3 |
| Heat of vaporisation | 444 kJ kg−1 |
| Ignition temperature | 585 °C |
| Lower flammability limit, in air | 4 vol% |
| Upper flammability limit, in air | 75 vol% |
| Pressure, MPa | Energy content, 103 MJ m−3 |
|---|---|
| 20 | 2.53 |
| 55 | 6.96 |
| 70 | 8.86 |
| 80 | 10.12 |
| Colour | GHG reduction potential | Comments |
|---|---|---|
| Gold | High | Naturally occurring; extraction related emissions only |
| White | High | Identification of geological formation; extraction related emissions only |
| Orange | High | Identification of suitable silicates; pumping water and extraction related emissions |
| Grey | Low | Source (methane) and energy are from fossil resources; both have associated emissions |
| Blue | Medium | Strongly dependent on emissions sequestration |
| Brown/black | Low | Source (coal) and energy from fossil resources; both have associated emissions |
| Turquoise | Medium | Pyrolysis of source; solid carbon hence no emissions; energy for pyrolysis has emissions |
| Purple/pink | Medium | Renewable source (water); nuclear energy (low carbon footprint) |
| Green | High | Renewable source (water); renewable energy resources |
The magnitude of heat released as a result of this exothermic reaction is termed the ‘highest heating value’ (HHV) and is found to be 142 MJ kg−1 (12.8 MJ N m−3) of H2. In most common practices, however, H2O is in the gaseous form (steam) and results in loss of heat or energy if this is not recovered. The corresponding energy released on transformation to steam is termed the ‘lower heating value’ (LHV) and is found to be ∼120 MJ kg−1 (10.8 MJ N m−3). Converting the gas into liquid increases the energy density by orders of magnitude but requires extraction of a large quantity of latent heat to cool the gas. Moreover, storing and transporting in the liquid state require the development of highly thermally insulating containers and pipelines. Hence, H2 is manufactured, stored and transported in a compressed gaseous state. Since the mass density in the gaseous state increases with the increase in pressure, the energy content increases upon increasing the pressure, as shown in Table 1, and hence, H2 is transported in pressurized form if not in the liquid state. This will increase the energy density although it is still far below that of gasoline, for example. The volumetric energy density of gasoline is ∼3 orders of magnitude higher than that of H2 gas but it is non-renewable.
1.4. Objectives of H2 economy
The current scenario of global warming due to emission of various greenhouse gases has necessitated a shift from energy sources such as coal, oil and natural gas to non-polluting alternatives such as sun and wind. In this context, H2 is proposed as a clean source of energy with minimal emissions. As an energy carrier it is extremely versatile and can substitute the fossil fuel-based energy carriers currently in use. If a transition to H2 should occur, then all the different energy requirements along with the current needs in various applications have to be fully met, which means that the demand will increase manifold from the current level of 120 Mt per year. Hence, it becomes imperative to understand and analyze all the different aspects of H2 – production to transport to utility. Most importantly, the true gain to the environment as well as its sustainability in the long run needs to be assessed. The sources of H2 can be broadly classified into non-renewable and renewable sources. The different non-renewable sources are hydrocarbon gases, coal, tar sands, heavy oils and so on. The renewable sources are different types of biomass and water. The most common non-renewable source that is currently used extensively is methane (CH4), as it has the highest H/C ratio of 4 and the most renewable source is water (H2O), which can be split using electricity. Hence, in the present work, the conversion of CH4 and H2O into H2 is discussed in detail, as they hold the highest potential for scaling up to extremely large quantity production. The objective of this work, therefore, is to review the different aspects of the supply chain and associate wherever possible environmental and ecological factors to these processes. It should be mentioned here that since most of these processes are not performed on a large scale, the environmental parameters and materials issues will either be extrapolations or estimates. These, however, will need to be refined/modified, as we gain experience in the future and development takes place.2. Hydrogen production
2.1. Natural hydrogen
Naturally occurring H2 deposits are currently not fully explored and mapped due to various reasons such as economic and geopolitical, including non-availability of accurate detection methods.15 The concentration of H2 gas in the naturally occurring deposits varies from region to region as the source is different in different locations. The concentration of H2 in these deposits can vary from 10% to >90%.14,15,20,26,27 The most common gases associated with H2 in these deposits are N2, CH4 and a combination of these gases. An interesting aspect of some of these deposits is that there is a constant production of fresh H2 due to reactions such as serpentinization, which means that it is a never-ending source. Although these sources exist and new deposits are being discovered, a challenge however is to separate H2 from the other gases and make it suitable for transportation and consumption. Current estimates show the naturally occurring H2 gas potential is ∼0.1–10 Mt per year. The industrial requirement, other than being an energy carrier alone, is ∼120 Mt per year, far in excess of current naturally occurring deposits. The current gas requirement is far in excess of naturally occurring resources. Recently, however, the US Department of Energy awarded a USD 20 million grant program to explore the possibility of extracting naturally occurring H2,20 bolstering the search for naturally occurring H2. Another source is freshly forming H2 as a byproduct of serpentinization reaction that occurs in ocean ridges. H2 yields of up to 300 mmol for every kilogram of rock are predicted due to this reaction and this has been detected along the mid-ocean ridges.28Historically, it has been produced from a range of sources such as natural gas to coal to meet the industrial needs. Synthesizing it however has the biggest advantage, as it results in nearly pure state with very low quantity of impurities and thus fit for direct use in many applications ranging from production of fertilizers to electricity generation. If one were to transition to H2 and a H2 economy, these industrial production processes need to be significantly scaled up. The flip side, however, is that the environmental foot print of these technologies should be significantly reduced or even eliminated completely. This makes it imperative to understand these processes and evaluate their environmental impact and long-term sustainability. The different large-scale production processes currently known which have the potential to be scaled-up are discussed below.
2.2. Reforming
Reforming is a process which converts naturally occurring hydrocarbons into H2 and CO2 (CO). The naturally occurring hydrocarbons can be gaseous – natural gas, liquid – wet biomass, or solid – coal.25,29,30 The most commonly used starting material, however, is natural gas (CH4). The main advantage of this source is that it generates 2 moles of H2 for every mole of CH4 and releases only 1 mole of CO2 and is therefore one of the main resources used currently for large-scale production.The steam-methane reforming (SMR) process, which is the most reliable process known, produces H2 in several steps or reaction vessels.25,29,30 The first step in this process is the conversion of CH4 into CO and H2 based on the following reaction:
| CH4(g) + H2O(l) → CO(g) + 3H2(g) − ΔH | (3) |
| CO(g) + H2O(g) → CO2(g) + H2(g) + ΔH | (4) |
The temperature of the incoming synthetic gas and steam should be maintained at ∼400 °C as the above reaction is exothermic in nature releasing 41 kJ per mole of CO. This reaction takes place under a pressure range of 0.1 MPa to 8 MPa. The reaction, however, does not really go to completion and the product gases will have ∼2 vol% of unreacted CO. If ultrapure H2 is required, the product gas is further subjected to 2 additional stages of WGS reaction at 200 °C and 100 °C to bring down the CO content to <0.002 vol%.
The main steam-methane reforming reaction (eqn (3)) is highly endothermic and also the conversion of water to steam requires heat input. In order to overcome some of these heat requisites, two alternatives are explored:
• Supplying the required heat by burning a fraction of incoming CH4, typically ∼25%. This is called allothermal reforming.
• Autothermal reforming – in this process, air/oxygen is added to the incoming reactants, which results in an exothermic methane oxidation reaction that supplies the heat needed to push the reaction forward. Both steam reforming and partial oxidation reactions occur simultaneously at ∼950–1100 °C and 10 MPa pressure in the presence of a catalyst. The net autothermal reaction is given as follows:
| 5CH4(g) + 3H2O + O2(g) → 5CO(g) + 13H2(g) | (5) |
This reaction involves a series of reactions, and controlling the mixture of reactants and maintaining proper steam-to-C ratio will be extremely crucial in this process. A reduced ratio of 0.6 and a correct fraction of oxygen/air supply the heat required and hence no external heat source will be needed to generate H2. Since no heat is required and all the reactions can occur in a single reactor, it will be a compact process with possibly low capital cost.32 The products of this process, however, are still a mixture of gases, and H2 needs to be separated. Moreover, if air is used, it will add N2 to the product gases while addition of pure O2 requires its cryogenic isolation from air.
An alternative to steam reforming is ‘dry’ reforming, wherein CO2 is used instead of H2O as follows:
| CH4(g) + CO2(g) → 2CO(g) + 2H2(g) + ΔH | (6) |
This is again an endothermic reaction requiring about 247 kJ per mole of CH4 and also a suitable catalyst. The main advantage of this method is that it does not require high-purity water and recycles existing CO2 without leading to any additional emissions. However, this reaction is not fully explored and needs research and development. If one considers the overall steam reforming reaction given by
| CH4(g) + 2H2O(g) → CO2(g) + 4H2(g) + ΔH | (7) |
Apart from the CH4 gas, materials such as coal and biomass (both dry and wet) have been proposed and also demonstrated as sources of H2. The gasification of coal, for example, does result in producing synthetic gas but the amount of H2 in this gas mixture is relatively low and does not exceed about 50% with majority of the cases yielding about 10–15%. This product gas however contains several harmful and toxic gases, metals and particulates. Similar is the case with biomass, both dry and wet. Therefore, from the perspective of large-scale production for H2 economy, these technologies do not really hold promise either from environmental or economic considerations, and hence, these will not be discussed in detail here.
The sources of H2 in the different processes discussed above are mainly fossil-based hydrocarbons including coal. The other main source of H2, as mentioned in the introduction section, is H2O. In the steam reforming process, water also undergoes hydrolysis but in the presence of, and together with, hydrocarbons. However, H2O itself can be a source of H2 when it is separated into components on supply of required amount of energy and in the presence of suitable catalysts. If one were to supply the required energy to split H2O in the form of heat, i.e., thermal decomposition, then heating to ∼3000 °C leads to about 50% of volume decomposition into H, H2, O, OH− and O2. The decomposed gases should be separated to avoid recombination, and separation at these elevated temperatures is extremely difficult. Hence, pure thermal decomposition is never practiced and alternate forms of energy are used to split H2O. The most versatile form of energy is electricity, i.e., electrolysis of water and this process is used industrially and is being developed for large-scale adaptation. Hence, the discussion on splitting H2O is limited to the various forms of electrolysis.
2.3. Water splitting by electrolysis
Electrolysis is a process wherein H2O is split into its components H2 and O2 using electricity as the source of energy for splitting, as shown in Fig. 4. The distinct advantage of this method of producing H2 is that it can be environmentally neutral, sustainable and completely circular in nature if the primary energy source is renewable in nature such as solar and wind. The splitting of water produces O2 which is environmentally friendly and this can be used for many applications including medical use. In a truly closed system, however, it can be used for oxidation of H2, which releases useful energy and will also result in the formation of H2O, which can either be used again for splitting or released into the atmosphere. | ||
| Fig. 4 Splitting of water (H2O) using renewable electricity is a net-zero emission process and is also circular in nature, becoming completely sustainable. This is because the product of H2 combustion will produce H2O, which can be reused if collected at the source and recovered completely. This process can be least harmful both environmentally and ecologically. | ||
Electrolysis can be performed under different conditions and in the presence of different electrodes and electrolytes, each of which will have differing physio-chemical and electrochemical aspects.35 There are mainly 4 different configurations of electrolysers, which are as follows:
• Alkaline (AEC),
• Proton Exchange/Polymer Electrolyte Membrane (PEM),
• Anion Exchange Membrane (AEM), and
• Sold Oxide Electrolyte (SOC).
The typical cell structure of these 4 different electrolysers is shown in Fig. 5.7 Irrespective of the type of configuration, H2 evolution occurs at the negative cathode while O2 evolution occurs at the positive anode. The half-cell reactions in the 4 electrolysers and the corresponding standard potentials are given as follows:
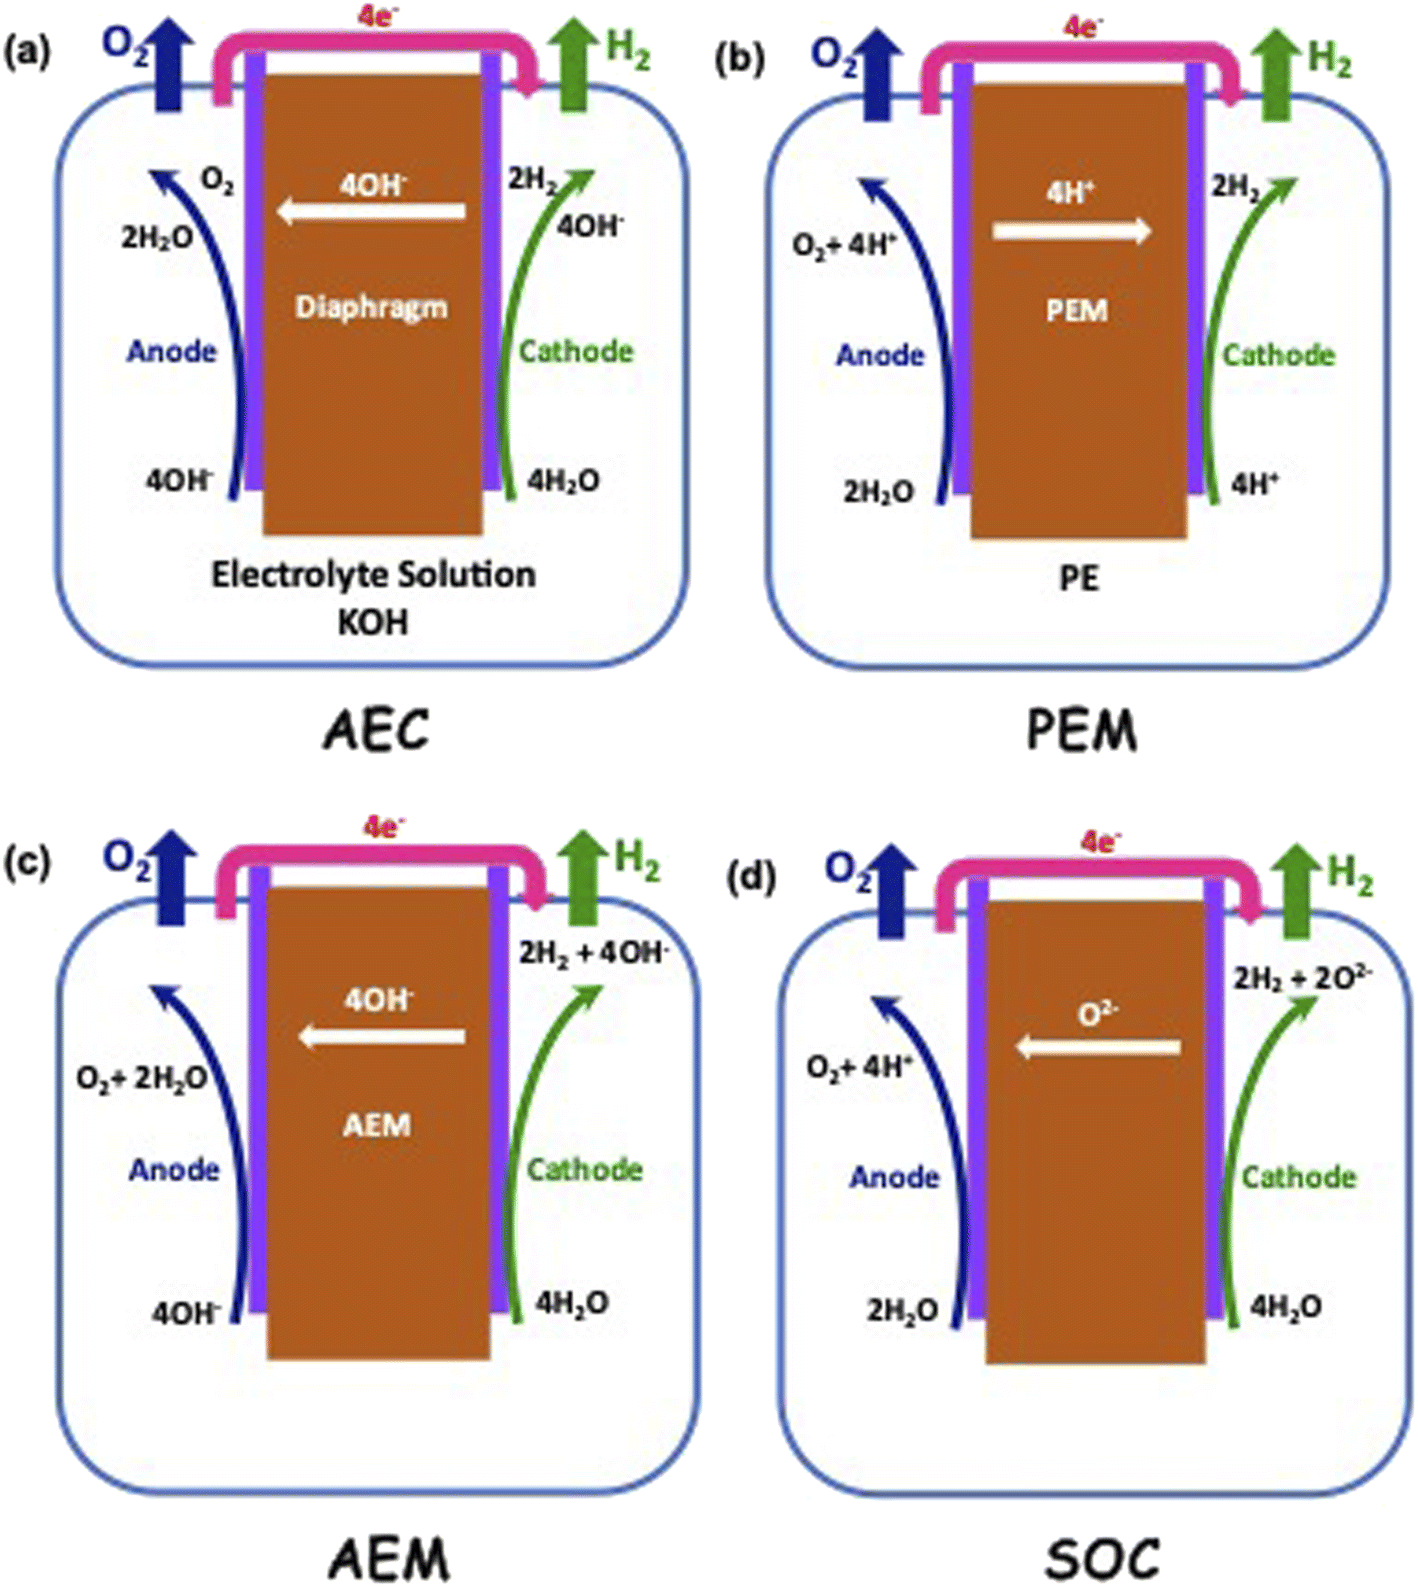 | ||
| Fig. 5 Different electrolysis processes with electrode reactions and dominant moving ions across the membranes are shown. (a) Alkaline liquid electrolyser cell (AEC) (b) polymer electrolyte membrane (PEM) electrolyser, (c) anion exchange membrane (AEM) electrolyser and (d) solid oxide electrolyte (SOC) electrolyser. Among the 4 different types of electrolytic cells, the AEC uses a liquid electrolyte, while the others use solid electrolytes/membranes. The SOC process essentially operates at elevated temperatures. | ||
Alkaline:
| 2H2O(l) + 2e− → H2(g) + 2OH−E0 = 0.828 V at negative cathode |

Proton Exchange/Polymer Electrolyte Membrane (PEM):
| 4H+ + 4e− → 2H2(g) E0 = 0 V at negative cathode |
| 2H2O(l) → O2(g) + 4H+ + 4e−E0 = 1.23 V at positive anode |
Anion Exchange Membrane (AEM):
| 2H2O(l) + 2e− → H2(g) + 2OH−E0 = 0.828 V at negative cathode |

Solid Oxide Electrolyte:
| 2H2O(g) + 4e− → 2H2(g) + 2O2−E0 = 1.23 V at negative cathode |
| 2O2− → O2(g) + 4e−E0 = 0.33 V at positive anode |
It can be seen that OH− ions are the migrating species in alkaline and anion exchange electrolysers, while both H+ and O2− ions are the migrating species in the case of PEM and Solid Oxide electrolysers respectively. This means that the nature and type of membrane that allows permeation of these differently charged ions in each case have to be different. The ideal thermodynamically reversible full-cell voltage varies from 1.23 V to 1.56 V depending on the type of electrolyser. The actual operating voltages Vop however will be higher than these values, as they operate under adiabatic conditions and the different losses such as electrolyte resistance, electrode overpotentials and electrolyte resistance have to be compensated. The resulting Vop value can therefore be written as follows:
| Vop = E0 + IRe + IRcathode/anode + ηcathode/anode | (8) |
| Condition | AEC | PEM |
|---|---|---|
| Temperature, °C | 70–90 | 50–80 |
| Pressure, MPa | 0.1–3 | <7 |
| Electrolyte | KOH (∼6 mol L−1) | PFSA membrane |
| Separator | ZrO2 with PPS mesh | Solid PFSA |
| Positive anode | Ni-coated stainless steel (perforated) | IrO2 |
| Porous O2 transport layer | Ni-mesh | Pt-coated Ti (porous) |
| Bipolar plate – anode | Ni-coated stainless steel | Pt-coated Ti |
| Negative cathode | Ni-coated stainless steel (perforated) | C@Pt nanoparticles |
| Porous H2 transport layer | Ni-mesh | Porous Ti or C-cloth |
| Bipolar plate – cathode | Ni-coated stainless steel | Au-coated Ti |
| Frames and sealing compounds | PSU, PTFE, EPDM | PTFE, PSU, ETFE |
Apart from steam reforming and electrolysis, H2 can be produced by splitting H2O using solar energy alone, i.e. photolysis. In this case, the required energy in the form of heat for splitting is provided by concentrated sun light produced using a number of heliostats. A variant of this process is photo-thermal electrolysis wherein the infra-red radiation of the solar spectrum is converted into heat, while the rest of the radiation is converted into electricity using a photovoltaic cell. The heat generated converts water into steam and the electricity is used to perform electrolysis of the steam. There are certain other processes which are a combination of chemical and thermal energies that are being developed to split water into H2 and O2. These thermochemical processes have highly acidic environments and are operated at highly elevated temperatures because of which they are currently not amenable to large-scale adaptation, particularly in the context of hydrogen economy. Hence, all these processes including photolysis and photo-thermal splitting will not be discussed and analyzed further.
3. Hydrogen separation
Irrespective of the reforming process used, H2 is produced together with CO2 and other impurity gases. Hence, separation from these other gases is mandatory to produce pure H2. Separation is achieved mainly by the following two different methods:• Pressurized adsorption of CO2 and other impurity gases onto a sorbent known as Pressure Swing Adsorption (PSA); and
• Selective diffusion of H2 across a membrane known as membrane separation.
In the case of PSA, the hot gases from the water–gas shift reactor are pressurized to ∼4 MPa and passed over a sorbent, which adsorbs CO2 and other gases by physisorption. The sorbent used is either a molecular sieve such as zeolite or activated carbon. The efficiency of separation reduces with time and the sorbent gets saturated with CO2 and other impurity gases. The separation occurs in a vertical packed bed column reactor and is a bath process. In large-scale production plants, multiple column reactors connected in parallel are used to enhance productivity and a semicontinuous production capacity, as shown in Fig. 6.36 Reducing the gas pressure in saturated sorbent columns in several discrete steps releases CO2 and other impurity gases and leads to revival of the sorbent material. Because of this, the separation efficiency is around 90%, while H2 produced will be 99.999% pure. Industrial units ranging in production capacity from 500 to 100000 N m3 h−1 having up to 12 column separators are currently being used.
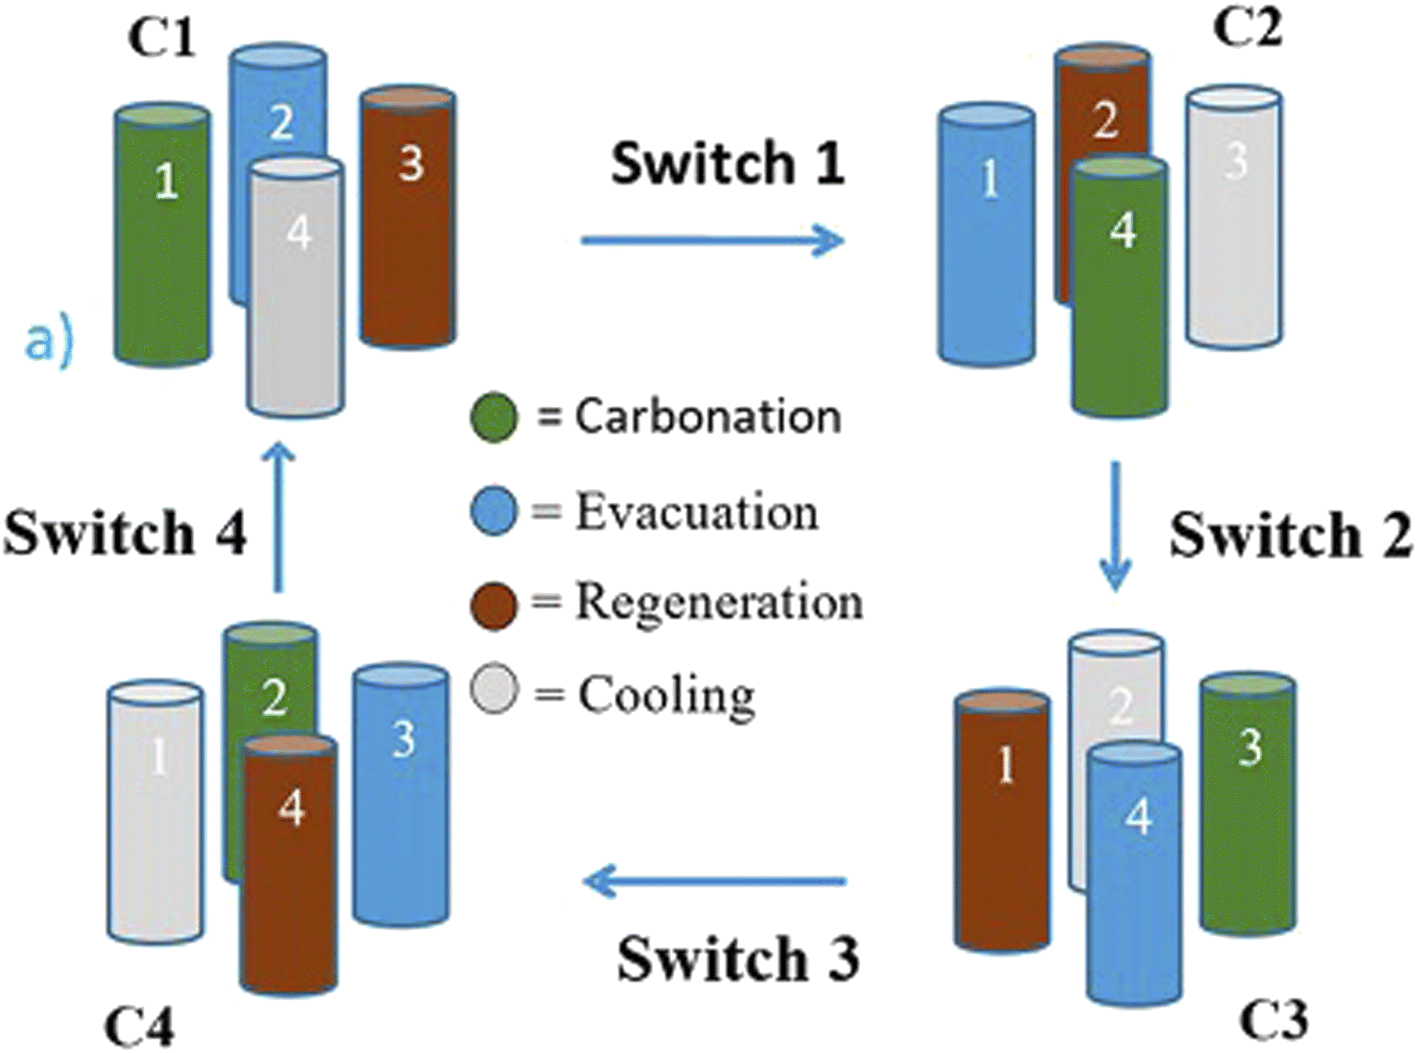 | ||
| Fig. 6 A typical 4-column configuration of pressure swing adsorption facilitates continuous operation of the process, leading to enhanced operation efficiency and regeneration of the catalyst. This is because multiple columns operate simultaneously and each of the columns has a different functionality leading to a continuous mode of operation as far as H2 separation is concerned. The different colors of the columns clearly indicate the different functions at any stage of the separation process. This configuration will be highly beneficial for large-scale gas production. | ||
Cryogenic separation of H2 by cooling the mixture of gases to <216 K (–57 °C) at a pressure of 0.5 MPa enables the liquefaction of CO2 and thus separates gaseous H2. This method however is energy intensive but has the advantage of converting CO2 into liquid, a dense form compared to gas and is more amenable to transportation in cryogenic containers and subsequent sequestration.
The separation of H2 can also be performed by pressurizing the gases to flow across a membrane. These membranes can be either non-porous or porous and separation occurs mainly due to the high diffusivity of H2 in the membrane due to its smallest size. Typical non-porous membranes are metallic in nature and the most commonly used metal membrane is made of Pd and its alloys. The non-porous membranes made of perovskite compounds such as SrCeO3 or BaCeO3 are also used for H2 separation at high temperatures, while the porous membranes are molecular sieves made of zeolites or silicates with pore sizes <1 nm. There are several polymeric as well as mixed membranes that have also been used for gas separation. These can be both porous and non-porous glass or rubbery polymers.37 The biggest advantage of polymeric membranes is their flexibility compared to inorganic membranes, which tend to be brittle in nature. The pure polymeric membranes, however, have low thermal stability compared to inorganic membranes, which can operate well even at 400 °C. In order to exploit the flexibility of polymeric membranes and the thermal stability and selectivity of inorganic membranes, mixed membranes made of both polymeric and inorganic materials have been developed and these have been found to exhibit good performance. Typical polymeric membranes are made of polyimide, polysulfone, polybenzimidazoles, polycarbonate, polyethersulfone and so on. Inorganic nanoparticles such as Pd, silica, and carbon nanotubes have been incorporated in these polymers to realize mixed membranes with separation properties better than polymer-based membranes. The gas flux Ji of the component i across the membrane is a diffusive phenomenon and is governed by the following equation:
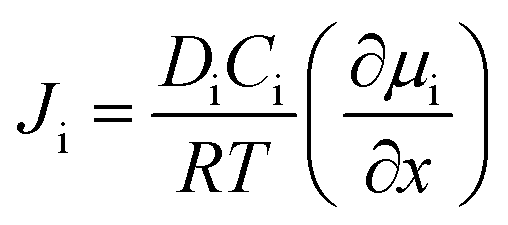 | (9) |
4. Sustainability evaluation
The concept of sustainable development encompasses the three most important aspects – planet, people and prosperity. These, in turn, have several components which deal with the environment, materials, economics, legislation and so on. The scope of this review is limited to discussion in detail of the technical aspects of H2 production and its environmental consequences defined in terms of embodied energy for the manufacture of H2 and associated emissions, ecological impact and materials required including input materials such as natural gas and water for the SMR process and electrolytic splitting respectively. The other components such as economics and legislation are equally important and a detailed discussion of these is beyond the scope of the current review. However, the important and essential economic and legislative components are mentioned without going into exhaustive details. A concise sustainability, circularity analysis of H2 production using any of the production methods has to clearly define the ‘System Boundaries’. These boundaries are extremely important and can make a considerable difference. In the present work system, boundaries are clearly defined and available data are analyzed within this boundary limit. The sustainability criteria can limit to environmental and ecological impact assessment or encompass the economic and social aspects of H2 production. The materials and various infrastructure facilities required are estimated using available data/information. The environmental and ecological parameters for the different processes are discussed together with economic factors where feasible.The projected global energy demand till the year 2050 based on past energy consumption has been estimated by the Energy Information Agency (EIA) in the International Energy Outlook 2023 report38 and this is shown in Fig. 7. It is seen that the energy demand increases from ∼650 EJ to 1000 EJ at an average rate of 2% per year. This energy demand can be translated into the amount of H2 gas requirement using the best case scenario of HHV, and this is also shown in Fig. 7. It is seen that the amount of H2 gas required to meet this energy demand increases correspondingly from 4.5 Gt to 7.5 Gt or 50 teraN m3 to 85 teraN m3 every year. This requirement is based on the assumption that the total energy requirement will be met solely by H2, which is not true as renewables are anticipated to directly contribute a significant fraction of the energy demand. Even if one assumes a 50% energy demand being met by alternatives such as renewables and nuclear, the H2 gas needed will still be in the range of 2.25 Gt to 3.75 Gt per year, which is enormous compared to 120 Mt produced in the year 2020, 3 orders of magnitude less than the requirement. This means that a significant expansion in production capacity has to be achieved at the earliest possible. As mentioned earlier, SMR and electrolysis of water using the alkaline electrolyte cell (AEC) are two processes that have the potential for expansion and large-scale production, and hence, the sustainability of these two processes is discussed below. Moreover, natural gas is a non-renewable fossil source, while water is a renewable source which is almost infinite on earth.
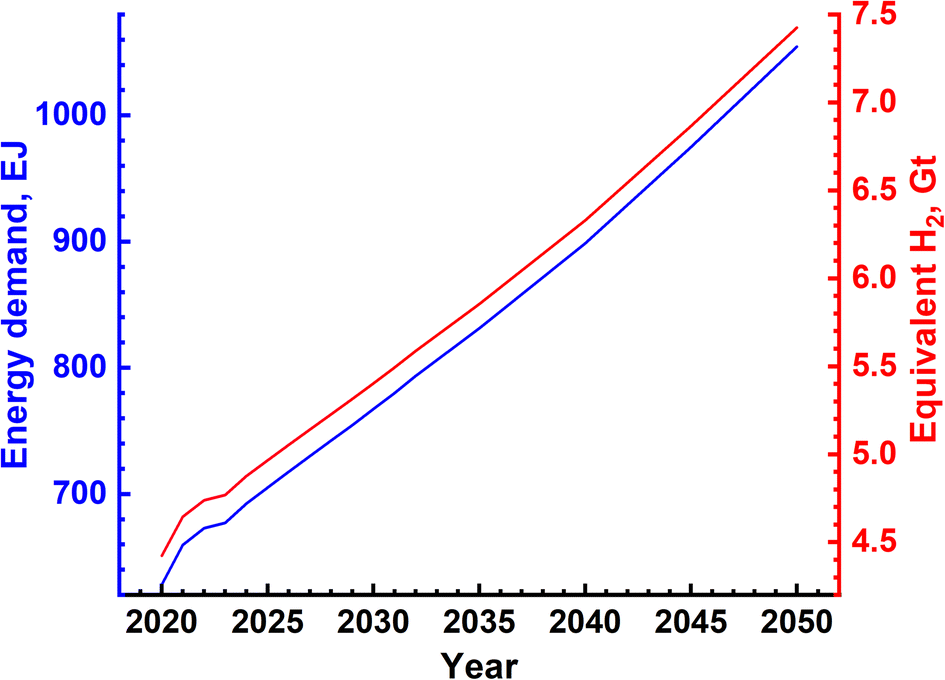 | ||
| Fig. 7 Energy demand till the year 2050 has been forecasted by the US Energy Information Agency's Energy outlook report of 2023 and is shown here together with the equivalent amount of H2 gas required to generate the yearly energy demand, assuming that complete energy requirement is met by H2. To convert the energy demand into equivalent H2 amount, the higher heating value has been used, which gives the lower limit of gas requirement. The actual requirement will be higher than the value shown here. | ||
4.1. System boundaries
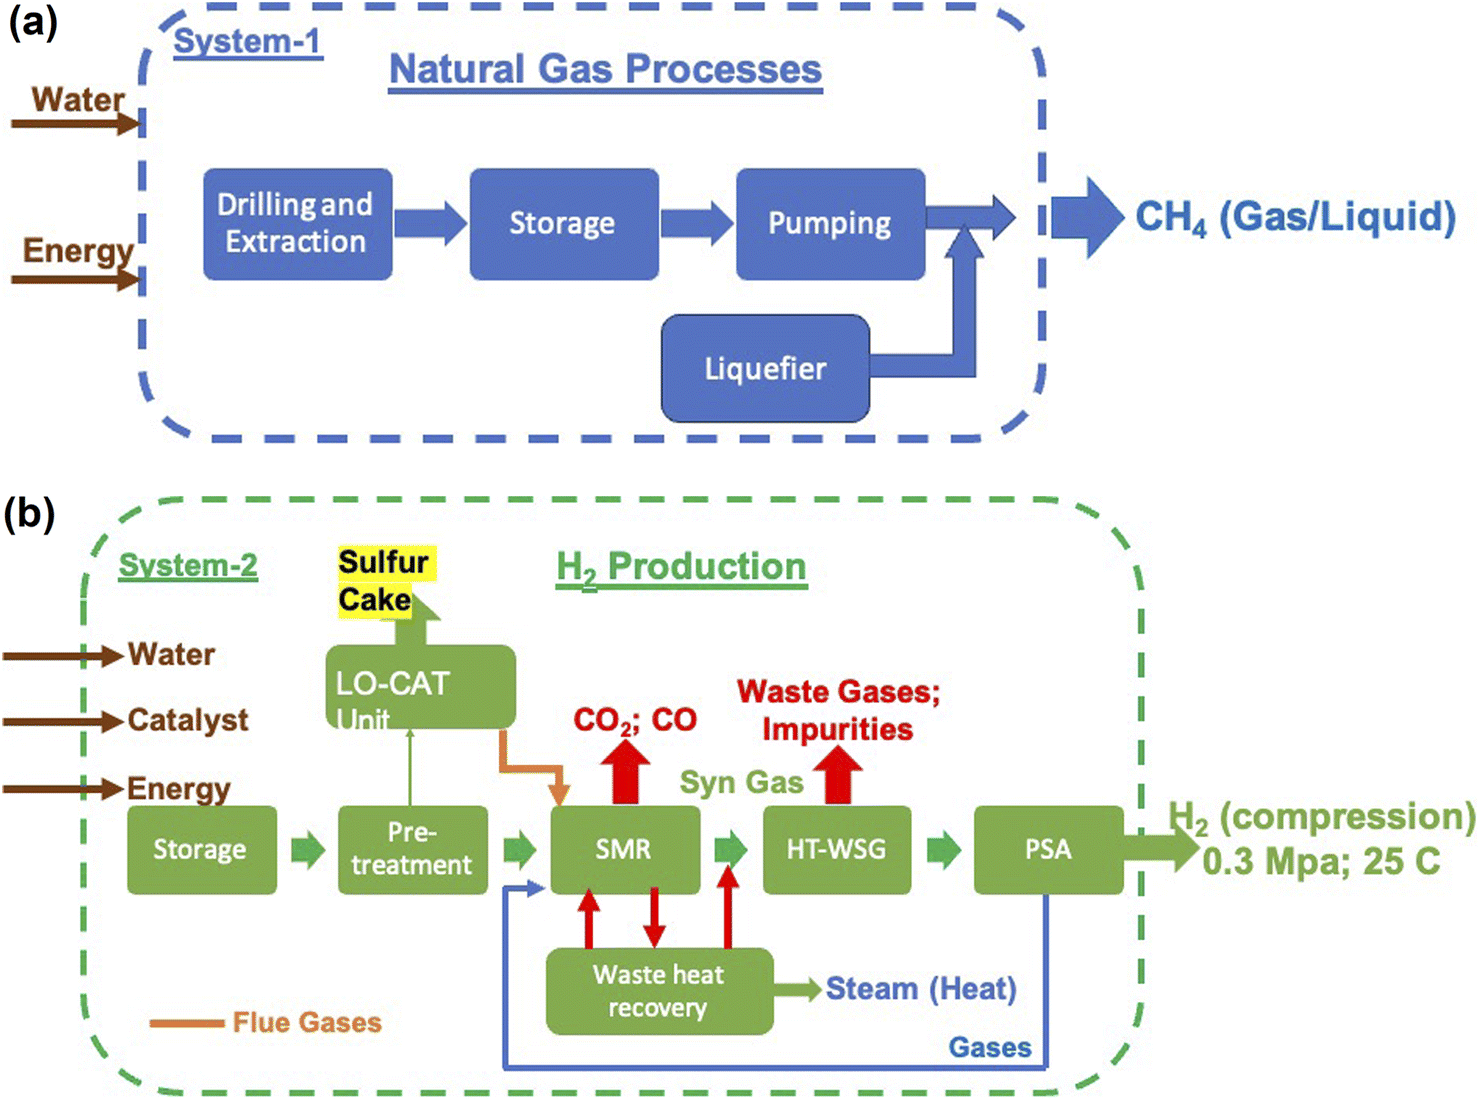 | ||
| Fig. 8 System boundary of the SMR process for life cycle assessment can be split into two distinct stages. Stage 1, (a), concerns natural gas mining, extraction and transport to the final usage site, while Stage 2, (b), is exclusively concerned with steam methane reforming of natural gas to produce H2, which can be compressed for transport. The H2 produced will be of 99.9% purity and in gaseous form. Some life cycle assessments consider only Stage 2, while some consider both stages. | ||
The three major inputs needed for the SMR process are; (1) natural gas, (2) electrical energy and (3) water. The typical values of these inputs obtained based on actual plant operating conditions in certain cases and plant simulations in others are given in Table 4.38,39 Different catalysts such as activated charcoal, ZnO, Al2O3, Co2O3 and CuO that are required are given in Table 5. These can be revived and need replacement once in 2 or 3 years. Apart from these, several other inputs such as catalysts, steel, cement and land will also be required. These, however, will be small as they are mainly infrastructures in nature and last for the lifetime of the plant, typically 20 years or more. Hence, these are not discussed as main requirements. The 3 major requirements were determined based on the H2 gas requirement, and are shown in Fig. 9a and b. It is seen that electricity requirement ranges from 15 to 25 EJ per year, while that of natural gas varies from ∼13 Gt to 23 Gt per year till the year 2050. The SMR process requires fresh water for various operations and the corresponding need ranges from 80 Gt to 140 Gt per year or 80 to 140 T per litres.
| Material, kg | |
|---|---|
| ZnO | 3.36 × 10⁻⁴; replenished every 2 years (desulfurization) |
| ZnO | 2.35 × 10⁻⁵; replenished every 3 years (catalyst in WGS reactor) |
| Aluminum oxide | 7.84 × 10⁻⁶; replenished every 3 years (catalyst in WGS reactor) |
| Copper oxide | 2.09 × 10⁻⁵; replenished every 3 years (catalyst in WGS reactor) |
| Co2O3 | 2.05 × 10⁻⁵; replenished every 3 years (catalyst in SMR reactor) |
| Activated carbon | 6.92 × 10⁻⁴; replenished every 2 years (PSA bed) |
 | ||
| Fig. 9 (a) Magnitude of annual electrical energy required to produce H2 gas using the SMR process. (b) Electrical energy is required mainly in the reforming reactor together with natural gas and water. Both natural gas and water will be required in Gt quantities every year. The materials needed to construct a H2 plant with a production capacity of 1.5 MN m3 per day are mentioned in the inset of (b). Apart from these, different catalyst materials will also be needed as given in Table 4. However, these are not as large in magnitude as cement, steel and Al. | ||
The environmental impact is generally assessed by the amount of emission of greenhouse gases and is represented in terms of equivalent CO2 quantity. In the case of SMR process, emissions are due to two distinct sources – natural gas mining and breakdown in the reactor and electricity use for the different processes. The emissions due to electricity utilization vary from country to country as the renewables' fraction is different in different countries. The most extensive and reliable data available is from H2 production facilities in USA and Canada and these are given in Table 6.39–45,50 It is seen that, on an average, 10 kg s of CO2 is emitted for every kilogram of H2 gas produced. This means that the amount of CO2 emission alone will be of the order of 10's of Gt. The actual yearly emissions based on the amount of H2 produced were determined, and are shown in Fig. 10. These emissions include those which arise due to natural gas prospecting, processing and decomposition as well as electricity utilization in the different aspects of the SMR process. The emissions range from 45 Gt to 75 Gt per year.
| Environmental parameters, kg | Ref. 49 | Ref. 39 | Ref. 38 |
|---|---|---|---|
| CO2 | 9.35 (4.69–17.31) | 10.5 (7.74–12.6) | 10.621 |
| CH4 | 2.36 × 10⁻⁴ | — | 6 × 10⁻² |
| NH3 | 2.36 × 10⁻⁴ | — | — |
| CO | 0.27 | — | 6 × 10⁻³ |
| NO2 | — | 3.48 × 10⁻⁵ | — |
| NOx | 1.68 × 10⁻³ | 4.77 × 10⁻³ | 12 × 10−3 |
| SO2 | 10−4 | 2.58 × 10⁻⁴ | 10−3 |
| PM2.5 | 4.44 × 10⁻⁴ | — | — |
| PM10 | 5.35 × 10⁻⁴ | — | — |
| VOC | 9.01 × 10⁻⁴ | — | — |
| Pb | 5.07 × 10⁻⁸ | — | — |
| Methanol | 2.14 × 10⁻⁵ | — | — |
| Water | — | 17.1 (7.5–21.9) | 19.8 |
 | ||
| Fig. 10 Annual CO2 emissions due to H2 production using the SMR process increase with the increasing energy demand from about 45 Gt to 75 Gt by the year 2050. This constitutes a significant fraction of annual global emissions. The data include emissions due to electricity generation and are mainly from production plants in the USA, Canada and Europe, where there is substantial renewable electricity mix in the overall electricity generation. | ||
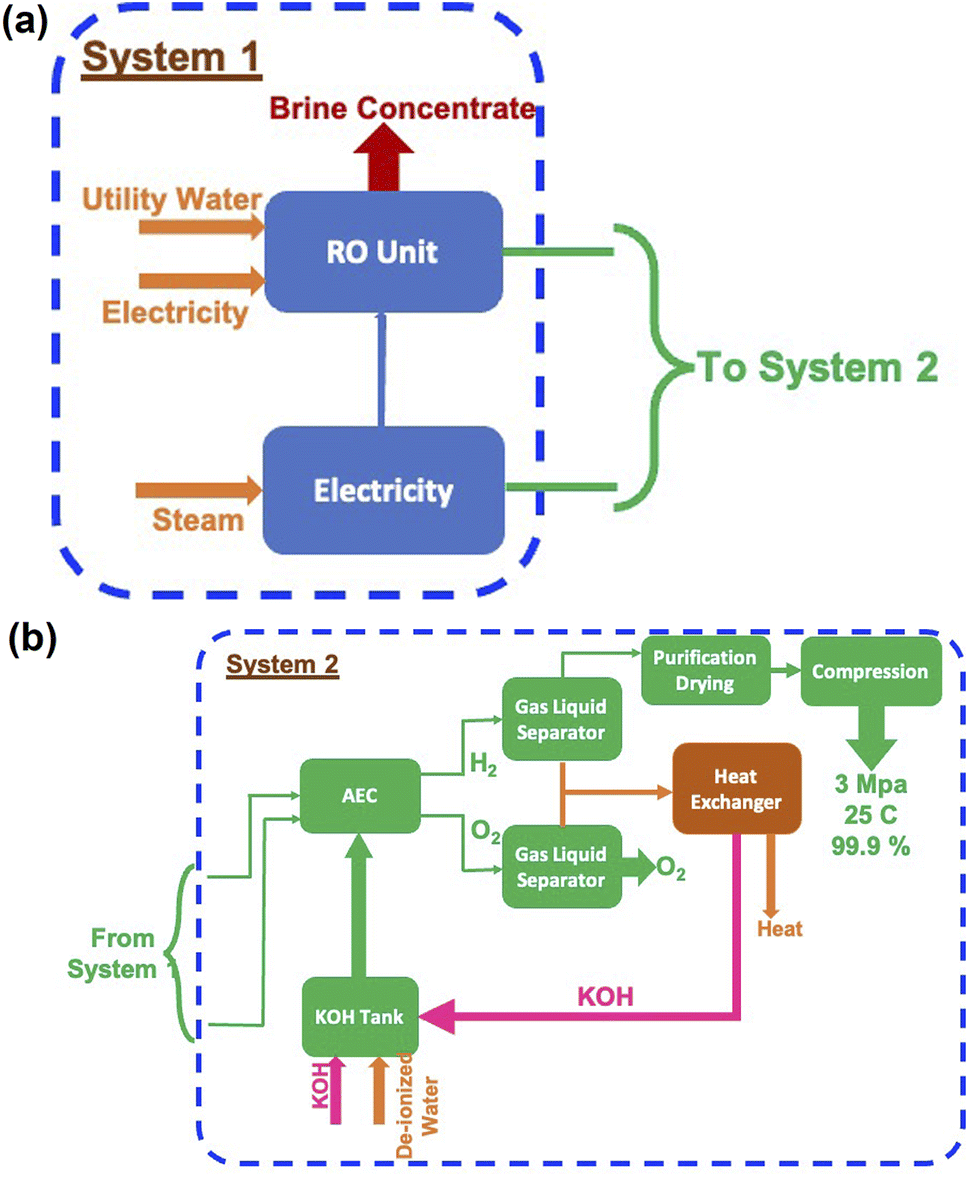 | ||
| Fig. 11 System boundary for water splitting via electrolysis can be separated into two distinct stages for life cycle assessment. In stage 1, (a), the utility water or sea water is completely purified so that it meets the input quality requirement of water electrolysis. In stage 2, (b), water is split into H2 of 99.9% purity via electrolysis and compressed so that it can be transported for further use. Several studies consider only stage 2 for life cycle assessment as stage 1 is considered insignificant in terms of energy and emission. | ||
In the case of splitting water by electrolysis in an alkaline electrolytic cell, the main requirement will be for electricity, water and electrolyte (KOH).40 These are given in Table 7 and the amounts required as per energy demand are shown in Fig. 12a and b. The electricity requirement increases from ∼900 EJ to 1500 EJ per year, while that of the electrolyte increases from 4.5 Mt to 7.5 Mt. Furthermore, the water demand varies from ∼60 Gt to 100 Gt or 60 to 100 T per litres per year. The typical cell configurations have Ni-electrodes, stainless steel separators and polyphenylene sulfide packing, and these will be required in millions of tons to install and commission large-scale H2 production.
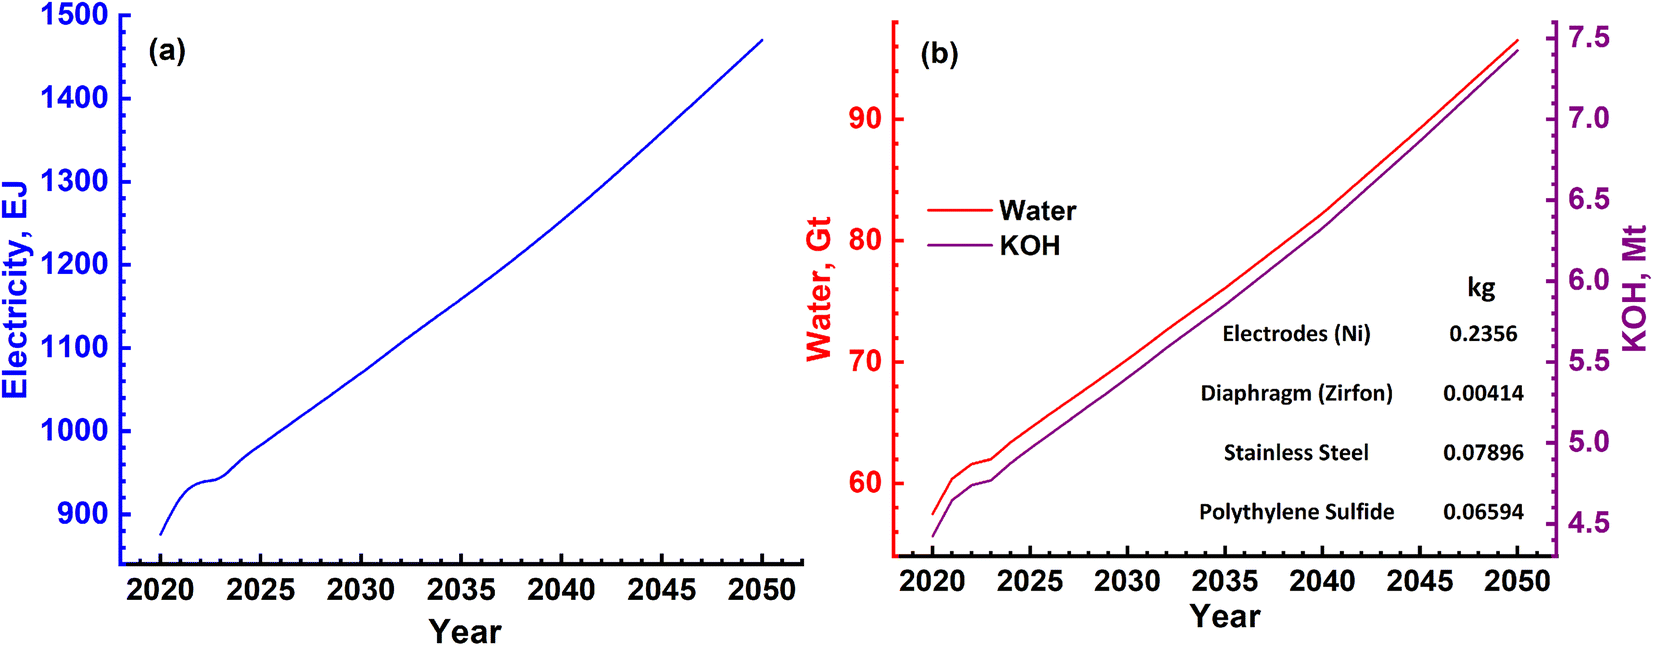 | ||
| Fig. 12 (a) Electrolysis process requires a significant amount of electrical energy annually for splitting water. This will increase to ∼1500 EJ by the year 2050 and become highly critical. (b) The corresponding annual requirement for water and the electrolyte KOH. The water requirement is of the order of several Gt each year. The magnitudes of other electrolytic cell materials such as electrodes, separators and sealants required to produce 1 kg of H2 gas are given in the inset of (b). It can be seen that the supply of these materials can become critical with the increase in H2 production. | ||
The water splitting electrolysis process does not directly generate emissions, but requires electrical energy, the generation of which leads to emissions. Again, based on a country's electricity generation mix, the magnitude of emissions varies.40,49,51–54 Since there are no large-scale water splitting units operating commercially, the equivalent emissions have been determined based on the electricity requirement given in Fig. 12(a). The yearly emissions due to H2 production based on two limits of 390 g kW h−1 and 820 g kW h−1 were determined,55 and are shown in Fig. 13. These are about an order of magnitude higher than the emissions due to the SMR process, as shown in Fig. 10. These can vary from ∼90 Gt to 160 Gt in the best-case scenario to 200 Gt to 340 Gt in the worst-case scenario. The emissions due to water splitting by electrolysis are essentially due to electricity consumption.
 | ||
| Fig. 13 Amount of yearly CO2 emissions due to large-scale production of H2 using water splitting by electrolysis, and they are a significant fraction of available CO2 emissions in the limit for 2.0 °C global warming scenario. Since production via electrolysis has not reached large-scale industrial capacity, actual emissions data are not available. Hence, the electricity demand is converted into equivalent emissions based on two limits of 390 g kW h−1 and 820 g kW h−1 across the world. | ||
Apart from the environmental consequence of emitting various global warming gases and particulates into the atmosphere, large-scale production of H2 gas also leads to significant ecological emissions and impact. These ecological emissions lead to various effects such as fresh water toxicity, which affects both humans and other living organisms. The different ecological impact parameters due to both the SMR process and water splitting by electrolysis are given in Tables 8 and 9. If one considers the fact that these parameters are due to the production of just 1 kg of H2 gas, the intensity of producing giga tons of H2 gas becomes extremely severe and requires serious consideration.
| Ecological parameter, kg | |
|---|---|
| Freshwater ecotoxicity | 3.12 × 10⁻⁸ |
| Human carcinogenic toxicity | 1.46 × 10⁻² |
| Human non-carcinogenic toxicity | 1.52 × 10⁻³ |
| Marine ecotoxicity | 6.13 × 10⁻⁶ |
| Ozone formation, human health | 1.68 × 10⁻³ |
| Ozone formation, terrestrial ecosystems | 1.68 × 10⁻³ |
| Terrestrial acidification | 1.17 × 10⁻³ |
| Terrestrial ecotoxicity | 3.28 × 10⁻³ |
| Ecological parameter, kg | |
|---|---|
| Ozone depletion | 8 × 10⁻⁶ |
| Acidification | 1.4 |
| Terrestrial toxicity | 3.3 × 10² |
| Fresh water toxicity | 3.3 |
| Marine toxicity | 4.7 |
| Human carcinogenic toxicity | 1.3 |
| Human non-carcinogenic toxicity | 110 |
5. Discussion
Large-scale production of H2 using either conventional fossil fuels such as methane and coal or splitting of water has been shown to be technologically feasible. Specifically, steam methane reforming has been in use since a long time while water electrolysis is at a very nascent stage. Scaling-up these technologies to meet the current and growing energy demand, however, requires a relook at these and, most importantly, a careful analysis of the sustainability implications of this energy transition. Sustainability analysis of any process or product is multidimensional in nature and has several components such as technical feasibility, energy, environment and ecological implications, financial requirement, and societal and governmental obligations. Specifically, a fast shrinking remaining CO2 budget for either 1.5 °C or 2.0 °C global warming scenario makes it absolutely imperative to analyse the environmental and ecological sustainability of this transition.The SMR process has been conventionally used for producing H2, which is used mainly in NH3 production and oil refining. The technology therefore has matured considerably and is ready for even larger upscaling. This is evidenced by one of the recent large-scale facilities that became operational in April 2021, shown in Fig. 14, producing 56000 N m3 per hour of 99.99% pure H2.56 The main inputs for the SMR process, as mentioned earlier, are natural gas, electricity and water. If one considers the availability of natural gas, the quantity produced in the world since year 2010 and projected production till the year 2050 are shown in Fig. 15. The global production capacity increases steadily from ∼2.0 Gt in the year 2010 to 3.4 Gt by the year 2050. This is an order of magnitude lower than the H2-based energy demand, clearly showing that natural gas availability will run the risk of severe short fall and hence prospecting and production capacity needs significant increase. The available global reserves as of the year 2022 were estimated to be ∼110 Gt and the amount of methane present in the form of methane hydrates was estimated to be ∼5 orders of magnitude higher than terrestrial reserves. The exploration and production of natural gas, however, has to be done extremely carefully avoiding any leakage into the atmosphere, as its global warming potential is ∼28 times higher than that of CO2. Natural gas is one of the non-renewable fossil sources used in the reforming process. An alternative would be different types of biomass – solid and liquid, which can also be used as input in the reforming process. They are also renewable in nature and hence have been extensively investigated for producing H2. The biomass can be of different types varying from simple organic wastes such as grass, coconut shell, and corncob to sewage sludge. Two methods of treating these were investigated at best in laboratory/pilot-scale set-ups or purely based on thermodynamic and kinetic modelling of the reactors.46,57,58 The output of these processes is a mixture of gases such as H2, CH4, higher hydrocarbons and CO, which have an excellent combustion value. Production of pure H2 requires further processing including techniques such as pressure swing adsorption. The real environmental benefits of these, however, need to be assessed as and when large-scale production becomes feasible in the future. An attractive feature of these is that they add value to everyday waste and thus lead to ‘valorisation’ of common waste. It should however be mentioned that common organic and agricultural wastes already find use as animal feed and in composting to produce organic fertilizers. The amount of electrical energy and water needed to implement natural gas SMR-based H2 production is shown in Fig. 9, and these clearly indicate that 10–30 EJ of energy will be needed to produce the gas while the water requirement increases to ∼140 Gt by the year 2050. This water cannot be saline as it affects reactor performance and this huge quantity of fresh water requirement year on year imposes considerable load on natural fresh water systems, in direct conflict with human and food production needs. The other most important impact is the magnitude of CO2 emissions which is 10's of Gt due to H2 gas production alone. An alternative to mitigate CO2 emissions into the atmosphere is the capture and subsequent sequestration and utilization (CCSU), and thus, changing H2 from being grey to blue. However, the CCSU technology is still in its infancy with mainly trials/pilot schemes in operation. The feasibility of large-scale implementation of these schemes is still a subject of debate and needs significant research and analysis. Another alternative to reduce effective emissions is to transition to electrical energy provided solely by renewable resources such as solar, wind and hydro. Scaling of these is again highly debated, and thus, making H2 production a completely green activity needs further developments. Apart from the emissions associated with steam reforming, ecological impact also becomes significant, as given in Table 8.59 The contamination of water resources, as measured by fresh water toxicity, amounts to ∼149 tons for the year 2023 alone and increases with the increasing energy demand. The carcinogenic toxicity levels and terrestrial acidification of soil and water bodies become millions of tons, clearly showing the disastrous consequences of large scale H2 production.
 | ||
| Fig. 14 One of the recent SMR-based H2 production facilities (Air Liquide's SMR-X process) in Antwerp, Belgium, produces 99.99% pure H2 at a rate of 56000 N m3 per hour. The plant went into operation in April 2021. This shows the complexity of the plant and the stainless steel structures required in the form of pipes which carry hot gases. | ||
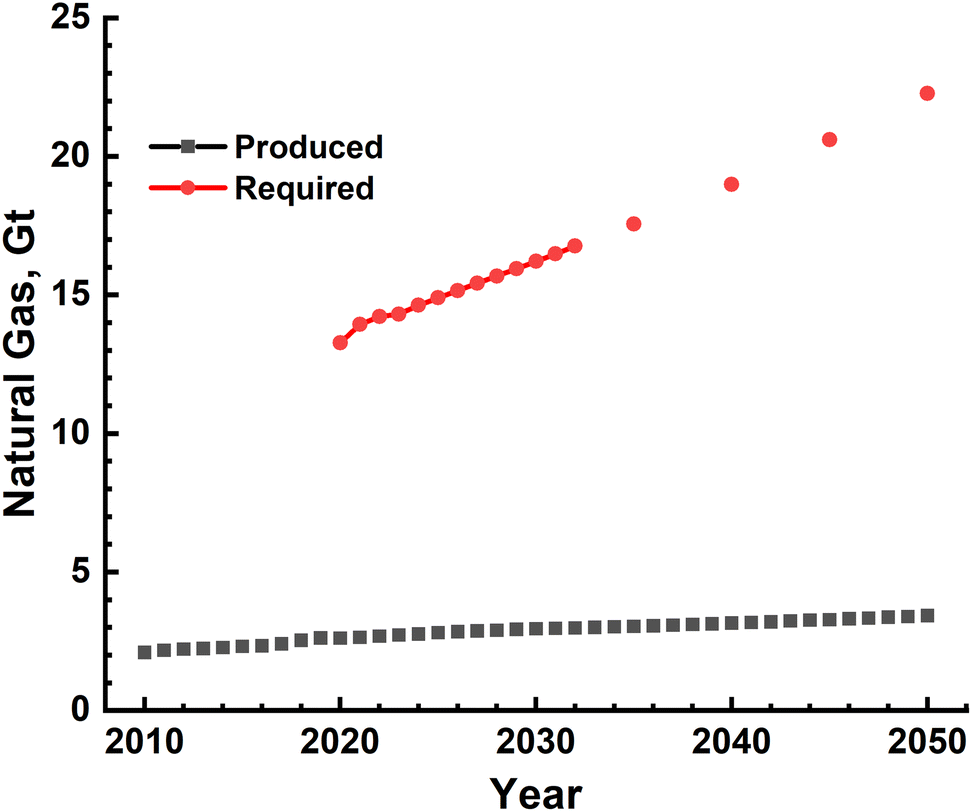 | ||
| Fig. 15 Quantity of annual global natural gas production and its estimated production till the year 2050 are shown together with the quantity required based on the energy demand. It is clearly seen that projected production lags behind the requirement, indicating a severe supply chain risk associated with H2 production to meet the complete energy demand, i.e. H2 economy. | ||
An alternative to natural gas used as the source of H2 is water (H2O) a renewable source. The inherent advantage of this method is that the oxidation or usage product is H2O with no associated emissions and being truly circular in nature. The main concern in this method is that it requires electrical energy to split water and this will be in the range of 1000's of EJ per year, as shown in Fig. 12 and is too large. If this electrical energy can be provided by renewable resources alone, then water electrolysis to produce H2 will be an ideal sustainable choice, the case of green H2. One of the truly green H2 production facility that became operational recently, in the year 2022, in Spain is shown in Fig. 16. This plant is based on polymer electrolyte membrane (PEM) cells and is capable of producing ∼360 kg of H2 every hour which is used mainly to produce ‘green ammonia’. This plant is powered by a 100 MW p photovoltaic solar facility located near the adjacent fields, as seen in Fig. 16. To compensate the varying solar power generation, a 5 MW Li-ion battery system capable of 20 MW h storage is also part of this H2 production facility.60 It is seen that green H2 production requires setting up large and exclusive renewable electricity generation plants such as solar photovoltaics, wind mill farms or captive hydroelectric power stations along with power storage systems such as Li-ion battery systems. Setting up these dedicated electrical power generation plants will require both material and economic resources. In the short term, they will lead to generation of emissions and pollutants as well as create material supply risks. For example, setting up just a 1 MW p Si photovoltaic (PV) power plant will require anywhere from 2.0 t to 7.0 t of 9 N purity solar-grade Si apart from other materials and will result in emitting about 680 t to 1720 t of CO2(e) into the atmosphere.47 This however is not completely feasible and conventional methods of electrical energy generation will be needed. The electricity generation mix varies from country to country, and as a result, the net emissions also vary. The net emissions considering two extreme limits for CO2 emission to generate electricity across the world show that they are in the range of 100's of Gt per year (Fig. 13), a significant fraction of available carbon limits for global warming. Another major input for water splitting is water, which is required in Gt quantities every year. This will lead to stresses in human water consumption requirement as well as food production. The fact that extremely pure water is needed for electrolysis means that water purification will result in the generation of ‘brine or salt’ concentrate and release of this will lead to ecological damage, as given by the various parameters in Table 9.48 Terrestrial toxicity will be ∼53 million tons, while acidification is 0.25 million tons for the year 2023 alone and increases with the increase in H2 production. The ecological impacts are extremely significant and show the non-viability of this technology. An alternative to fresh water electrolysis would be direct sea water electrolysis using renewable electrical energy, which will be highly effective and completely sustainable. A recent study has demonstrated the feasibility of such a process using renewable wind energy.61 An important point to be noted here, however, is that the water generated due to the use of H2 can in principle be reused for electrolysis again, thus completing the cycle. This however requires effective sequestration and transport of water to the electrolysis unit, which becomes a logistical near impossibility. The water produced as a result of use cannot be used either for human consumption or agriculture as it is highly ‘demineralised’ and hence has to be released into the atmosphere, if it is not to be sequestered for reuse in electrolysis. The electrolysis process also requires an electrode material, Ni, of the order of million tons. Although it becomes enormous magnitude wise, it is not a recurring consumable and has a finite life. Its supply however can become critical as it is used in a wide variety of applications ranging from catalysis to stainless steel manufacturing. The other materials that will be needed to implement large-scale H2 utilization will be available in sufficient quantity and may not pose significant supply chain risk.
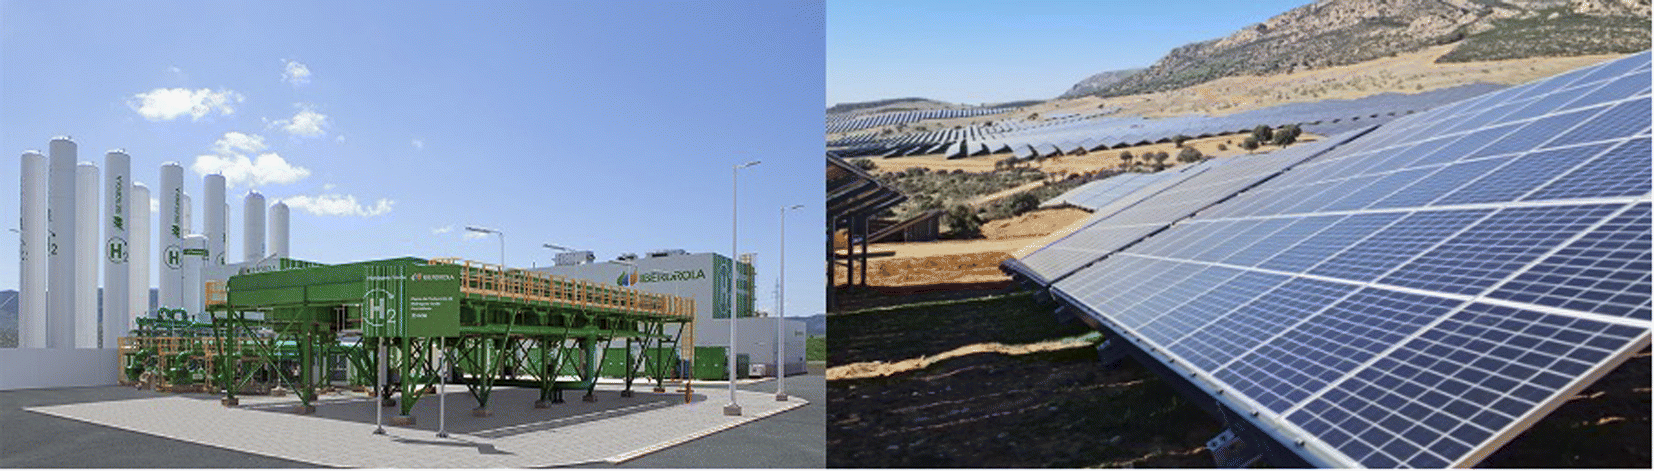 | ||
| Fig. 16 Green H2 production facility, Iberdrola, established in the year 2022 in Spain. This water electrolysis facility produces 360 kg of H2 per hour and is powered by a solar photovoltaic plant with an installed capacity of 100 MW p. The plant also has a Li-ion battery system for streamlined and steady electrical power supply to the plant. This clearly illustrates that green H2 production requires not only a renewable electricity generation system but also an electrical energy storage system. | ||
The case of producing green H2 is being pursued actively across the world as it is being forecast to play a significant role in decarbonizing energy generation as well as supplement grey H2 usage in several hard-to-abate applications.62 The two main factors that limit the large-scale adoption of green H2 are the availability of renewable electricity and the capital costs involved in the installation of green H2 plants. Regarding establishing dedicated renewable electricity generation facility, as mentioned earlier with the example of solar PV, it will have associated material supply risks and short-term emissions, which need careful planning and execution. Three of the major producers, namely the European Union, the United States of America and Canada, have recently specified strict regulatory conditions for green H2 projects, commonly referred to as the ‘3 pillars’.63 These require (1) the electrolysers' electricity consumption to match renewable electricity production timing, (2) electrolysers to source electricity from within the same region and (3) that the renewable electricity is sourced from newly established sources. The solar PV and wind mill electricity generation are inherently intermittent in nature and thus require intermediate electricity storage system such as batteries. In such cases, the first regulation becomes difficult to satisfy, i.e. matching electrolysis process to intermittency of renewable energy production and this may be interpreted as violation of the first regulation. The two other regulations/pillars imply that both renewable electricity generation systems and electrolysers should be in the same geographical region and newly installed. Additionally, the regulations also specify that CO2(e) emissions should be limited to 3.4 kg and 4 kg per kg of green H2 produced. An important sustainability factor which becomes crucial is the financial resources required to implement large-scale production facilities. The SMR process has been in use for several decades and so the financial resources needed can be estimated with accuracy. It has been found that implementing an SMR plant together with CCSU capability will result in ∼USD 2.5 per kg of blue H2 produced. The cost for establishing a large industrial scale water electrolysis unit however is not known with the level of accuracy that is built into SMR process costs. It has been estimated to cost ∼USD 5.2 per kg of green H2 by water splitting using the alkaline electrolytic cell. These clearly show that green H2 production on a large scale to meet the demands of a H2 economy has many challenges to face and to become economically and environmentally viable. Irrespective of the technology used to transition to H2-based energy production, it would cost trillions of USD to implement and this requires a concrete policy decision by individual countries. One important point to be noted in this context of energy transition is that energy, environmental, ecological and financial costs associated with decommissioning the existing fossil fuel-based energy generation and utilization structures have to be factored in the sustainability analysis of H2-based energy supply and thus a ‘H2 economy’.
6. Conclusions
Hydrogen-based energy supply has been projected as an alternative to decarbonise the energy sector and thus reduce or arrest the global warming phenomenon. This has led to the phrase ‘hydrogen economy’ in several discussions across the world's energy fora. Hence, an exhaustive review of known hydrogen production technologies has been performed to assess the potential of hydrogen-based energy supply from the perspective of sustainability as defined by embodied energy, environmental, ecological and financial parameters. The various conclusions of this analysis are as follows:(1) The SMR process is a mature technology and has the potential to be scaled up. The current status of this process is that it produces grey H2 and efforts are underway to make it blue by sequestering the emissions. Another effort that is currently investigated is to make it completely green by using renewable electrical energy. Even if these efforts succeed, the question of supply chain risk of natural gas is extremely high as the quantities required are about 3 orders of magnitude higher than current production. Additionally, the risk of direct methane emission into the atmosphere becomes finite and thus increases the global warming phenomenon considerably, albeit on a shorter time scale. This technology however cannot avoid the baseline emission of CO2 due to CH4 oxidation, i.e. 1 mole of CO2 for every mole of CH4 reformed. Hence, on a larger scale, this technique cannot satisfy all the sustainability criteria and can at best be a partial/temporary method to produce large quantities of H2.
(2) Splitting water to produce H2 by electrolysis is highly promising from emissions perspective of just the process. This process however requires extremely large quantities of electrical energy, the generation of which results in highly unwanted quantities of global warming gases to be emitted. Several technological as well as legislative measures are currently underway to make green H2 more sustainable. Unless the electrical energy supply is completely decarbonized, this process becomes totally unsustainable from environmental and ecological criteria. It also puts severe stress on fresh water availability, which can be overcome by switching to direct sea water electrolysis. Such alternatives which combine sea water electrolysis with renewable electricity are the best way forward in switching to H2 gas-based energy generation.
(3) The large-scale production of H2 using either of the technologies results in significant and disastrous ecological impact. Even if both the technologies change to using renewable energy and resort to CCSU measures, the ecological impact will not be mitigated. This becomes extremely critical and has to be completely addressed before transitioning to H2-based energy generation and a ‘H2 economy’.
(4) In the recent times, several naturally occurring H2 sources have been discovered. Apart from this, methods to produce H2 exploiting the geological formations such as the serpentinization reaction will be extremely useful in producing green hydrogen with extremely low emissions. Geological explorations to discover new sources will contribute significantly to ‘greening’ the H2-based energy sector.
In summary, electrolysis of sea water using renewable electricity or even low carbon emitting nuclear electricity will be the best way forward in the long run for transitioning to an extremely low-carbon emission method of energy generation. Naturally occurring H2 as well as that produced by reactions such as serpentinization will contribute to the greening of the energy sector. These alternatives are sustainable and need active global support. Based on the overall energy, and environmental and ecological considerations, it is clear that transitioning to a completely H2-based energy supply as envisioned by ‘H2 economy’ is not feasible based on currently known technologies. As an energy vector, H2 can only be a part of the total energy scenario comprising different renewables including nuclear electricity generation.
Methodology
The different requirements such as energy, materials, electrolytes, water and so on as well as the environmental parameter, mainly CO2 emission, and ecological parameters for each year have been determined based on the H2 demand corresponding to that particular year. However, the global strategy will be for transition to H2 economy over a period of two to three decades. This means that, on a year-to-year basis, there will be additional/incremental energy, materials, water and such requirements over the previous year, and correspondingly, the emissions will be increased compared to the previous year.Example calculation: consider year 2023 as the base year!
Energy requirement: 677.11 EJ
Equivalent H2: 4.7684 Gt @ 142 MJ kg−1 HHV for H2
SMR process requirements:
Energy for H2 production: 4.7684 PW h @ 1 kW h kg−1 of H2
Natural gas: 14.305 Gt @ 3 kg kg−1 of H2
Water: 85.8312 Gt @ 18 kg kg−1 of H2
CO2 emission: 47.684 Gt @ 10 kg kg−1 of H2
Energy requirement for the year 2024: 692.33 EJ ≅ 4.87551 Gt
Additional H2 over the year 2023: 0.10713 Gt
Additional energy: 385.668 GJ
Additional natural gas: 0.32139 Gt
Additional water: 1.92834 Gt
Additional CO2 emission: 1.0713 Gt
AEC water splitting process requirements:
Energy required to produce H2: 944.136 EJ @ 55 kW h kg−1 of H2
Water: 61.989 Gt @ 13 kg kg−1 of H2
KOH: 4.7684 Mt @ 1 g kg−1 of H2
CO2 emission:
Additional energy for 2024 over the year 2023: 21.211 PJ
Additional water: 1.39269 Gt
Additional KOH: 0.10713 Mt
Data availability
All the data used in this manuscript have been included in the manuscript and do not have a separate data set.Conflicts of interest
The author has not received any funding for this work and there are no conflicts of interest.Acknowledgements
The author wishes to acknowledge the Indian Institute of Technology Bombay for the provision of facilities.References
- G. B. Holland and J. J. Provensano, The Hydrogen Age – Empowering a Clean Energy Future, Gibbs Smith, Utah, 2007 Search PubMed.
- S. J. Davis, N. S. Lewis, M. Shaner, S. Aggarwal, D. Arent and I. L. Azevedo, et al., Net-zero emissions energy systems, Science, 2018, 360(6396), eaas9793, DOI:10.1126/science.aas9793.
- Global Hydrogen Review 2023, IEA, [cited 2024 Sep 6]. Available from: https://www.iea.org/reports/global-hydrogen-review-2023.
- V. Madadi Avargani, S. Zendehboudi, N. M. Cata Saady and M. B. Dusseault, A comprehensive review on hydrogen production and utilization in North America: Prospects and challenges, Energy Convers. Manage., 2022, 269, 115927, DOI:10.1016/j.enconman.2022.115927.
- H. Ishaq, I. Dincer and C. Crawford, A review on hydrogen production and utilization: Challenges and opportunities, Int. J. Hydrogen Energy, 2022, 47(62), 26238–26264, DOI:10.1016/j.ijhydene.2021.11.149.
- The Future of Hydrogen, IEA, [cited 2024 Sep 6]. Available from: https://www.iea.org/reports/the-future-of-hydrogen.
- IRENA, Green Hydrogen Cost Reduction: Scaling up Electrolysers to Meet the 1.50C Climate Goal, International Renewable Energy Agency, Abu Dhabi, 2020 Search PubMed.
- P. Nikolaidis and A. Poullikkas, A comparative overview of hydrogen production processes, Renewable Sustainable Energy Rev., 2017, 67, 597–611, DOI:10.1016/j.rser.2016.09.044.
- R. Derwent, P. Simmonds, S. O'Doherty, A. Manning, W. Collins and D. Stevenson, Global environmental impacts of the hydrogen economy, Int. J. Nucl. Hydrogen Prod. Appl., 2006, 1(1), 57, DOI:10.1504/ijnhpa.2006.009869.
- Q. Hassan, A. M. Abdulateef, S. A. Hafedh, A. Al-samari, J. Abdulateef and A. Z. Sameen, et al., Renewable energy-to-green hydrogen: A review of main resources routes, processes and evaluation, Int. J. Hydrogen Energy, 2023, 48(46), 17383–17408, DOI:10.1016/j.ijhydene.2023.01.175.
- A. M. Oliveira, R. R. Beswick and Y. Yan, A green hydrogen economy for a renewable energy society, Curr. Opin. Chem. Eng., 2021, 33, 100701, DOI:10.1016/j.coche.2021.100701.
- P. M. Falcone, M. Hiete and A. Sapio, Hydrogen economy and sustainable development goals: Review and policy insights, Curr. Opin. Green Sustainable Chem., 2021, 31, 100506, DOI:10.1016/j.cogsc.2021.100506.
- J. O. M. Bockris, The hydrogen economy: Its history, Int. J. Hydrogen Energy, 2013, 38(6), 2579–2588, DOI:10.1016/j.ijhydene.2012.12.026.
- V. Zgonnik, The occurrence and geoscience of natural hydrogen: A comprehensive review, Earth-Sci. Rev., 2020, 203, 103140, DOI:10.1016/j.earscirev.2020.103140.
- C. J. Boreham, D. S. Edwards, K. Czado, N. Rollet, L. Wang and S. van der Wielen, et al., Hydrogen in Australian natural gas: occurrences, sources and resources, APPEA J., 2021, 61(1), 163, DOI:10.1071/aj20044.
- B. S. Lollar, T. C. Onstott, G. Lacrampe-Couloume and C. J. Ballentine, The contribution of the Precambrian continental lithosphere to global H2 production, Nature, 2014, 516(7531), 379–382, DOI:10.1038/nature14017.
- O. Warr, T. Giunta, C. J. Ballentine and L. B. Sherwood, Mechanisms and rates of 4He, 40Ar, and H2 production and accumulation in fracture fluids in Precambrian Shield environments, Chem. Geol., 2019, 530, 119322, DOI:10.1016/j.chemgeo.2019.119322.
- F. Klein, J. D. Tarnas and W. Bach, Abiotic Sources of Molecular Hydrogen on Earth, Elements, 2020, 19–24 CrossRef CAS.
- J. Incer-Valverde, A. Korayem, G. Tsatsaronis and T. Morosuk, “Colors” of hydrogen: Definitions and carbon intensity, Energy Convers. Manage., 2023, 291, 117294, DOI:10.1016/j.enconman.2023.117294.
- E. Hand, Hidden hydrogen, Science, 2023, 379(6633), 630–636, DOI:10.1126/science.adh1477.
- A. Ajanovic, M. Sayer and R. Haas, The economics and the environmental benignity of different colors of hydrogen, Int. J. Hydrogen Energy, 2022, 47(57), 24136–24154, DOI:10.1016/j.ijhydene.2022.02.094.
- F. Osselin, C. Soulaine, C. Fauguerolles, E. C. Gaucher, B. Scaillet and M. Pichavant, Orange hydrogen is the new green, Nat. Geosci., 2022, 15(10), 765–769, DOI:10.1038/s41561-022-01043-9.
- W. B. Leung, N. H. March and H. Motz, Primitive phase diagram for hydrogen, Phys. Lett. A, 1976, 56(6), 425–426, DOI:10.1016/0375-9601(76)90713-1.
- https://www.hysafe.org/download/1196/BRHS_Chap1_V1p2.pdf .
- D. A. J. Rand and R. M. Dell, Hydrogen Energy: Challenges and Prospects, Royal Society of Chemistry, Cambridge, England, 2007 Search PubMed.
- A. R. Brandt, Greenhouse gas intensity of natural hydrogen produced from subsurface geologic accumulations, Joule, 2023, 7(8), 1818–1831, DOI:10.1016/j.joule.2023.07.001.
- A. Prinzhofer, C. S. Tahara Cissé and A. B. Diallo, Discovery of a large accumulation of natural hydrogen in Bourakebougou (Mali), Int. J. Hydrogen Energy, 2018, 43(42), 19315–19326, DOI:10.1016/j.ijhydene.2018.08.193.
- E. Albers, W. Bach, M. Pérez-Gussinyé, C. McCammon and T. Frederichs, Serpentinization-driven H2 production from continental break-up to mid-Ocean Ridge spreading: Unexpected high rates at the West Iberia margin, Front. Earth Sci., 2021, 9, 673063, DOI:10.3389/feart.2021.673063.
- A. Boretti and B. K. Banik, Advances in hydrogen production from natural gas reforming, Adv. Energy Sustainability Res., 2021, 2(11), 2100097, DOI:10.1002/aesr.202100097.
- I. K. Muritala, D. Guban, M. Roeb and C. Sattler, High temperature production of hydrogen: Assessment of non-renewable resources technologies and emerging trends, Int. J. Hydrogen Energy, 2020, 45(49), 26022–26035, DOI:10.1016/j.ijhydene.2019.08.154.
- F. Rau, A. Herrmann, H. Krause, D. Fino and D. Trimis, Efficiency of a pilot-plant for the autothermal reforming of biogas, Int. J. Hydrogen Energy, 2019, 44(35), 19135–19140, DOI:10.1016/j.ijhydene.2018.04.014.
- A. J. Kidnay, A. J. Kidnay and W. R. Parrish, Fundamentals of Natural Gas Processing, CRC Press, 2006 Search PubMed.
- J. Feng, X. Sun, Z. Li, X. Hao, M. Fan and P. Ning, et al., Plasma-assisted reforming of methane, Adv. Sci., 2022, 9(34), 2203221, DOI:10.1002/advs.202203221.
- S. Masoudi Soltani, A. Lahiri, H. Bahzad, P. Clough, M. Gorbounov and Y. Yan, Sorption-enhanced steam methane reforming for combined CO2 capture and hydrogen production: A state-of-the-art review, Carbon Capture Sci. Technol., 2021, 1, 100003, DOI:10.1016/j.ccst.2021.100003.
- M. Chatenet, B. G. Pollet, D. R. Dekel, F. Dionigi, J. Deseure and P. Millet, et al., Water electrolysis: from textbook knowledge to the latest scientific strategies and industrial developments, Chem. Soc. Rev., 2022, 51(11), 4583–4762, 10.1039/d0cs01079k.
- C. Dhoke, A. Zaabout, S. Cloete and S. Amini, Review on reactor configurations for adsorption-based CO2 capture, Ind. Eng. Chem. Res., 2021, 60(10), 3779–3798, DOI:10.1021/acs.iecr.0c04547.
- N. Pal and M. Agarwal, Advances in materials process and separation mechanism of the membrane towards hydrogen separation, Int. J. Hydrogen Energy, 2021, 46(53), 27062–27087, DOI:10.1016/j.ijhydene.2021.05.175.
- US Energy Information Administration, International Energy Outlook 2023, 2023, https://www.eia.gov/outlooks/ieo/pdf/IEO2023_narrative.pdf.
- P. L. Spath and M. K. Mann. Life Cycle Assessment of Hydrogen Production via Natural Gas Steam Reforming. 2001. https://www.nrel.gov/docs/fy01osti/27637.pdf.
- G. Gonzales-Calienes, M. Kannangara, J. Yang, J. Shadbahr, C. Deces-Petit, F. Bensebaa, et al., Life Cycle Assessment of Hydrogen Production Pathways in Canada, National Research Council of Canada, 2022 Search PubMed.
- A. Al-Qahtani, B. Parkinson, K. Hellgardt, N. Shah and G. Guillen-Gosalbez, Uncovering the true cost of hydrogen production routes using life cycle monetisation, Appl. Energy, 2021, 281, 115958, DOI:10.1016/j.apenergy.2020.115958.
- C. Antonini, K. Treyer, A. Streb, M. van der Spek, C. Bauer and M. Mazzotti, Hydrogen production from natural gas and biomethane with carbon capture and storage – A techno-environmental analysis, Sustainable Energy Fuels, 2020, 4(6), 2967–2986, 10.1039/d0se00222d.
- A. Mehmeti, A. Angelis-Dimakis, G. Arampatzis, S. McPhail and S. Ulgiati, Life cycle assessment and water footprint of hydrogen production methods: From conventional to emerging technologies, Environments, 2018, 5(2), 24, DOI:10.3390/environments5020024.
- Y. K. Salkuyeh, B. A. Saville and H. L. MacLean, Techno-economic analysis and life cycle assessment of hydrogen production from different biomass gasification processes, Int. J. Hydrogen Energy, 2018, 43(20), 9514–9528, DOI:10.1016/j.ijhydene.2018.04.024.
- O. Siddiqui and I. Dincer, A well to pump life cycle environmental impact assessment of some hydrogen production routes, Int. J. Hydrogen Energy, 2019, 44(12), 5773–5786, DOI:10.1016/j.ijhydene.2019.01.118.
- M. Mohamadi-Baghmolaei, P. Zahedizadeh, A. Hajizadeh and S. Zendehboudi, Hydrogen production through catalytic supercritical water gasification: Energy and char formation assessment, Energy Convers. Manage., 2022, 268, 115922, DOI:10.1016/j.enconman.2022.115922.
- S. Vitta, Materials and environmental sustainability of scaling Silicon Photovoltaics to 50 TWp, J. Mater. Res., 2024 Search PubMed , submitted.
- G. Zhao, M. R. Kraglund, H. L. Frandsen, A. C. Wulff, S. H. Jensen and M. Chen, et al., Life cycle assessment of H2O electrolysis technologies, Int. J. Hydrogen Energy, 2020, 45(43), 23765–23781, DOI:10.1016/j.ijhydene.2020.05.282.
- C. Wulf and M. Kaltschmitt, Hydrogen supply chains for mobility—environmental and economic assessment, Sustainability, 2018, 10(6), 1699, DOI:10.3390/su10061699.
- A. Valente, D. Iribarren and J. Dufour, Prospective carbon footprint comparison of hydrogen options, Sci. Total Environ., 2020, 728, 138212, DOI:10.1016/j.scitotenv.2020.138212.
- S. Ghandehariun and A. Kumar, Life cycle assessment of wind-based hydrogen production in Western Canada, Int. J. Hydrogen Energy, 2016, 41(22), 9696–9704, DOI:10.1016/j.ijhydene.2016.04.077.
- J. Koj, C. Wulf, A. Schreiber and P. Zapp, Site-dependent environmental impacts of industrial hydrogen production by alkaline water electrolysis, Energies, 2017, 10(7), 860, DOI:10.3390/en10070860.
- W. Kuckshinrichs and J. C. Koj, Levelized cost of energy from private and social perspectives: The case of improved alkaline water electrolysis, J. Cleaner Prod., 2018, 203, 619–632, DOI:10.1016/j.jclepro.2018.08.232.
- A. Valente, D. Iribarren, J. Dufour and G. Spazzafumo, Life-cycle performance of hydrogen as an energy management solution in hydropower plants: A case study in Central Italy, Int. J. Hydrogen Energy, 2015, 40(46), 16660–16672, DOI:10.1016/j.ijhydene.2015.09.104.
- CO2 Emissions in 2023, IEA, [cited 2024 Sep 6], Available from: https://www.iea.org/reports/co2-emissions-in-2023.
- Hydrogen: Forging the future with SMR-X™ technology/Air Liquide, [cited 2024 Sep 6], Available from: http://www.airiquide.com.
- A. Hajizadeh, M. Mohamadi-Baghmolaei, N. M. Cata Saady and S. Zendehboudi, Hydrogen production from biomass through integration of anaerobic digestion and biogas dry reforming, Appl. Energy, 2022, 309, 118442, DOI:10.1016/j.apenergy.2021.118442.
- H. Demey, G. Ratel, B. Lacaze, O. Delattre, G. Haarlemmer and A. Roubaud, Hydrogen production by catalytic supercritical water gasification of black liquor-based wastewater, Energies, 2023, 16(8), 3343, DOI:10.3390/en16083343.
- H. H. Cho, V. Strezov and T. J. Evans, Environmental impact assessment of hydrogen production via steam methane reforming based on emissions data, Energy Rep., 2022, 8, 13585–13595, DOI:10.1016/j.egyr.2022.10.053.
- Puertollano green hydrogen plant – Iberdrola, [cited 2024 Sep 6] Available from: https://www.iberdrola.com.
- T. Liu, Z. Zhao, W. Tang, Y. Chen, C. Lan and L. Zhu, et al., In-situ direct seawater electrolysis using floating platform in ocean with uncontrollable wave motion, Nat. Commun., 2024, 15(1), 5305, DOI:10.1038/s41467-024-49639-6.
- IRENA, Green Hydrogen: A Guide to Policy Making, International Renewable Energy Agency, Abu Dhabi, 2020 Search PubMed.
- The “three pillars” are gaining momentum in the green hydrogen industry, [cited 2024 Sep 6] Available from: https://www.gh2.org.
Footnote |
| † Retired Professor. |
| This journal is © The Royal Society of Chemistry 2024 |