 Open Access Article
Creative Commons Attribution 3.0 Unported Licence
Near real-time event detection for watershed monitoring with CANARY†
Jonathan B.
Burkhardt
 *a,
Debabrata
Sahoo
b,
Benjamin
Hammond
c,
Michael
Long
 d,
Terranna
Haxton
e and
Regan
Murray
e
aOffice of Research and Development, US Environmental Protection Agency, 26 Martin Luther King Dr West, Cincinnati, OH 45268, USA. E-mail: burkhardt.jonathan@epa.gov
bDepartment of Agricultural Sciences, Clemson University, McAdams Hall, Clemson, SC 29634, USA. E-mail: dsahoo@clemson.edu
cWoolpert, 514 Pettigru St., Greenville, SC 29601, USA
dWoolpert, 2000 Center Point Rd. Suite 2000, Columbia, SC 29610, USA
eOffice of Research and Development, US Environmental Protection Agency, 26 Martin Luther King Dr West, Cincinnati, OH 45268, USA
First published on 8th April 2022
Abstract
Illicit discharges in surface waters are a major concern in urban environments and can impact ecosystem and human health by introducing pollutants (e.g., petroleum-based chemicals, metals, nutrients) into natural water bodies. Early detection of pollutants, especially those with regulatory limits, could aid in timely management of sources or other responses. Various monitoring techniques (e.g., sensor-based, automated sampling) could help alert decision makers about illicit discharges. In this study, a multi-parameter sensor-driven environmental monitoring effort to detect or identify suspected illicit spills or dumping events in an urban watershed was supported with a real-time event detection software, CANARY. CANARY was selected because it is able to automatically analyze data and detect events from a range of sensors and sensor types. The objective of the monitoring project was to detect illicit events in baseline flow. CANARY was compared to a manual illicit event identification method, where CANARY found > 90% of the manually identified illicit events but also found additional unidentified events that matched manual event identification criteria. Rainfall events were automatically filtered out to reduce false alarms. Further, CANARY results were used to trigger an automatic sampler for more thorough analyses. CANARY was found to reduce the burden of manually monitoring these watersheds and offer near real-time event detection data that could support automated sampling, making it a valuable component of the monitoring effort.
Environmental significanceUnderstanding and monitoring watershed water quality is critical for ensuring the health of watersheds, associated ecosystems, and communities. Availability of low-cost sensors has opened possibilities of remote monitoring; however, these can create large datasets that must be analyzed, and they can be impacted by natural events, like rainfall, that may not be directly monitored. This work demonstrates that the free tool, CANARY—which was developed for monitoring water distribution systems—may have value for watershed system monitoring with automatic treatment of rainfall events. CANARY or similar automated monitoring approaches are vital for providing automated monitoring of sensors, allowing for more distributed monitoring, and more timely responses and associated mitigation of anthropogenic sources of watershed contaminants. |
1 Introduction
Maintaining or improving the quality of water in our nation's streams, rivers, ponds and lakes was a major driving force behind the 1972 Clean Water Act (CWA).1 In the years since the CWA, permanent discharges into water bodies or other sources that impact watersheds have been identified to help reduce pollution. Municipal Separate Storm Sewer Systems (MS4s) are one of the sources covered under the National Pollution Discharge Elimination System (NPDES), created under 1972 CWA program.2–4 Generally, urban areas are covered under NPDES permits. As part of the NPDES permit, MS4 regulations, MS4 communities must identify illicit discharges in their jurisdictions. Many discharges are associated with combined sewer overflows. Illicit events are called illicit discharges because MS4s are not permitted to discharge these non-stormwater flows to the waters of a state. According to federal regulations, an illicit discharge is defined as any discharge to an MS4's jurisdiction that is not composed entirely of stormwater, and the source of the discharge is not covered under any industrial NPDES permit.5 The MS4s cannot control these illicit events; however, based on the permits, they are likely to detect and eliminate illicit discharges from their jurisdiction. MS4s use various monitoring programs to tackle illicit issues.6,7 MS4 communities may use dry weather screening to examine outfalls and identify illicit discharges and trace them back to their source.8 They may also use, if available, any existing real-time continuous water quality monitoring infrastructure to identify illicit in urban environments. Real-time continuous monitoring systems have been used to understand various natural and anthropogenic processes including regression based nutrient load estimation.9 Visual assessment techniques are conducted both in near real-time and in non-real-time to isolate and identify these illicit discharges;5 however, it is likely that illicit discharges are occurring without a detectable signal from standard water quality sensors. In addition to source identification, monitoring programs have also been undertaken to help detect discharge events and assess the general health of various water bodies.Environmental monitoring efforts face numerous challenges associated with equipment cost, availability of power, security of equipment or likelihood of intentional or unintentional damage, and communication.10,11 Assuming that all these challenges can be overcome, the analysis of data from remote equipment can still be a hurdle to effectively implement remote monitoring. The availability of cheaper hardware and improvements in remote power options (e.g., solar with battery backup) makes environmental monitoring efforts more accessible; however, more sensors means more data to analyze and process, which could be an issue.
The challenges associated with spatially distributed monitoring programs are not restricted to watershed monitoring. In 2013, the U.S. Environmental Protection Agency (EPA) water security initiative program held an event detection system challenge12 related to drinking water distribution systems. CANARY event detection software was developed to monitor finished drinking water systems, with special emphasis on ensuring their security from intentional contamination events.13 CANARY is a free automated data analysis tool designed to be sensor agnostic and can operate in real-time on continuous data (https://github.com/USEPA/CANARY). Though not specifically designed to monitor watersheds or other environmental systems, CANARY is able to analyze any time-series data to determine if changes are significant relative to previous trends.
Illicit events could be detected by utilizing Artificial Intelligence (AI) and Machine Learning (ML) based approaches or statistical based tools such as CANARY. While opportunities exist for AI and ML based event detection approaches, they can rely heavily on data sets to train the model (i.e., reference or training dataset). This reliance on large data sets could require significant computing power, which can often be expensive. Further a user may need training or additional knowledge to use AI and ML based tools. AI and ML based solutions have been implemented in water distribution systems for flow monitoring and anomalous event detection.14 To the best of the authors' knowledge, AI and ML based illicit event detection approaches have not been reported in surface water applications. Other event detection tools such as CANARY rely on statistical properties to detect illicit discharges. Unlike AI and ML approaches, CANARY only relies on a small subset of data—based on the history window parameter—making the data requirements much lower. One application using CANARY has been reported to understand water quality in surface water.15
Because of the challenges associated with illicit event detection, the following objectives were pursued in the current article: (1) develop a procedure to ignore (filter out) rainfall induced events within CANARY; (2) apply CANARY for watershed illicit event identification and monitoring; (3) compare the results from automated illicit event identification by CANARY to previously used manual illicit event identification approach; and, (4) demonstrate how the output from CANARY was used to trigger automatic sampling of the illicit event for potential source identification.
2 Background
Ongoing environmental monitoring efforts go largely unnoticed despite the value they add to communities. However, events like the 2014 MCHM (4-methylcyclohexanemethanol) spill16 along the Elk River in West Virginia highlight the direct benefits of online monitoring in watersheds, specifically those that impact drinking water sources. Monitoring watersheds is not a new idea, but advances in low-energy communication technology and sensors lead to the potential for near real-time remote event detection for watershed systems.17 One example of a large scale monitoring effort is ORSANCO's Early Warning Organics Detection System (ODS). The ODS is a series of gas chromatographs (GCs) that were brought online in 1978 following a large carbon tetrachloride spill that impacted the Ohio River.18 Data from this system has been provided to water utilities along the Ohio River to help decide when to shut off intakes or modify treatment in response to change in water quality of the river. ORSANCO highlights ten large spills, including the Elk River spill, that have impacted the Ohio river since they brought the ODS online.19ORSANCO's monitoring program is a multi-state watershed monitoring effort that directly impacts numerous communities along the Ohio River. Many other monitoring efforts are underway to address water quality in other watersheds.
Environmental monitoring efforts can include periodic manual sampling or utilize continuous sensors or other technologies to provide consistent time-series data. The GCs in ORSANCO's ODS automatically collect and analyze samples each day for a range of volatile organic compounds and provide that data to its member utilities. The quality of the data provided by GCs comes at the cost of higher complexity. Simpler sensors are available to analyze for a variety of water characteristics (e.g., pH, temperature, conductivity) but at the cost of poor constituent classification. The rise of the internet of things (IoT) has also increased the number and type of low-cost sensors. The availability of lower cost sensors has provided opportunities to increase the spatial and temporal coverage of monitoring efforts. These efforts trade specificity in information for more general information but with larger data sets; relying on data-analytic techniques to provide information about water quality. These technologies can also provide more data throughout a period, with some sensors able to produce data every second or faster. A fine time-resolution provides more information about trends in data, but leads to a significant amount of data that needs to be analyzed. One sensor recording data every minute produces 86![[thin space (1/6-em)]](https://www.rsc.org/images/entities/char_2009.gif) 400 measurements per day and if a site has multiple sensors, or multiple sites are involved, analyzing the data can quickly become a problem too large for a person to accomplish.
400 measurements per day and if a site has multiple sensors, or multiple sites are involved, analyzing the data can quickly become a problem too large for a person to accomplish.
EPA developed the CANARY Event Detection Software with Sandia National Laboratories to provide a tool to analyzed finished drinking water in real-time from available sensor technology.13,20 Real-time here indicates that CANARY can process sensor data as it is recorded to a data-logger with sensors recording at intervals ranging from seconds to minutes. CANARY can be configured to work with most intervals, where common values relevant to monitoring applications are one, five, ten or fifteen minutes between data. Although developed to monitor drinking water, CANARY can analyze any time-series data and was designed to be sensor agnostic. Previous research also tested CANARY for applications that monitored a permeable pavement system,21 and in a water reuse application.22 Additional efforts to simplify the CANARY parameter selection23 provided a more holistic approach to CANARY's use and highlighted the key parameters. CANARY was also successfully implemented on a Raspberry Pi device.24 Nafsin and Li15 recently reported the use of CANARY for analyzing water quality data associated with the Milwaukee River. Previous work,12,22,23 tested CANARY in a variety of different applications and found that CANARY could be tuned to provide high true positives while reducing false positives (i.e., false alarms). With any event detection approach, there must be a balance between acceptable false alarm rates while ensuring high true positive rates. The tune-able parameters available within CANARY were demonstrated23 and the trade-off between true positives and false negatives has been previously explored for drinking water system applications. This further highlighted that sensitivity and responsiveness (i.e., how quickly after a signal change begin that an alarm would be triggered) is related to the data frequency and other CANARY parameters. CANARY reports the alarm to the computer on which analysis is conducted, but users could use this information to provide alarm status to other users with automated scripting; in this application, the alarm data was used to trigger an auto sampler through post processing scripts.
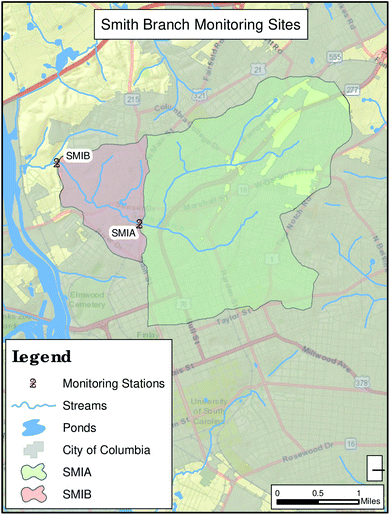
A real-world application case study is presented to demonstrate effectiveness and highlight future needs related to near real-time event detection in watersheds. This case study focuses on the Smith Branch watershed, which is a 6.5 square mile area on the western edge of downtown Columbia, SC (see Fig. 3). The upstream station, SMIA (see Fig. 1), where CANARY was implemented, was located in Earlewood Park, while the downstream station, SMIB, was located where a utility right-of-way crosses the creek off of Mountain Drive. Earlewood Park is home to Earlewood Community center where community members often hold meetings. The high pedestrian traffic at this location provides opportunities for educating the public on stormwater quality. The larger Lower Broad River watershed, which includes the Smith Branch watershed, is under a TMDL for fecal coliform bacteria. The primary objective for the City's monitoring program in the Smith Branch watershed has been to gain an understanding of the water quality drivers in the area, with a particular focus on indicator bacteria levels, where periodically illicit could be a source of bacteria in these surface waters.
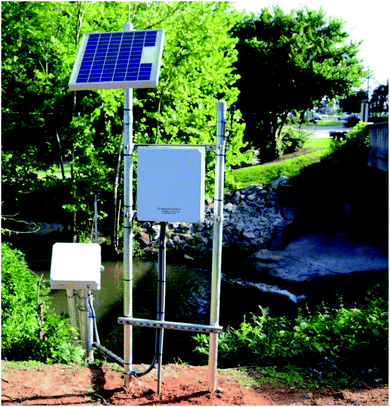
The monitoring stations includes a multi-parameter sonde, pressure transducer, staff gauge, solar panel, rain gauge, autosampler (at SMIA only) and remote telemetry equipment. The stations are docked on the stream banks where there is constant and substantial flow over the sonde.
3 Methods
This section highlights the components used to understand, detect and sample illicit events in urban watersheds using CANARY. The monitoring sites are discussed, along with the available water quality parameters. In order to reduce alarms triggered by natural rainfall events that cause changes in monitored signals a filtering procedure was used. Results from CANARY were compared to manually identified suspected illicit events to determine “false alarms” and “true alarms”. Finally, CANARY outputs were used to trigger an automatic sampler for improved long-term monitoring performance with the goal of source identification.3.1 Monitoring sites
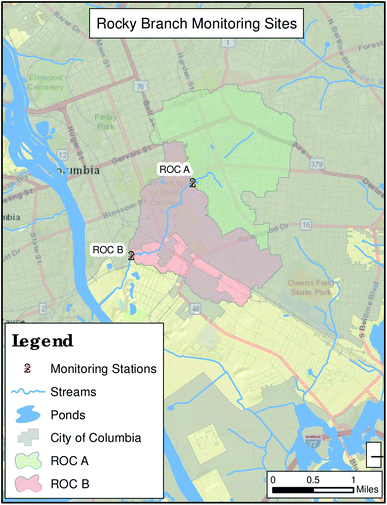
Two watersheds were monitored in this study. An initial testing phase was conducted on historical data from the Rocky Branch watershed and the Smith Branch watershed was used during the near real-time portion of the study.The Rocky Branch watershed, drains to the Congaree River. The City of Columbia's monitoring stations capture drainage from an area of 3.8 square miles near downtown Columbia. The upstream station, ROCA, is located in Maxcy Greg Park, an area of considerable flash flooding concern. The downstream station, ROCB, is located at the crossing of Olympia Avenue over Rocky Branch, where the creek exits the City of Columbia. The Congaree River is impaired for E. coli, for which a TMDL is currently under development. The City's Rocky Branch monitoring program provides valuable data with respect to the water quality of the creek as it moves through the City's jurisdiction.
The SMIA station is adjacent to the Parkside Drive bridge near the entrance to Earlewood and NOMA Bark Park. This park is also home to Earlewood Community center where members of the City often hold meetings. The high pedestrian traffic at this location makes it ideal for the monitoring site to educate the public on stormwater quality. The station includes a multi-parameter sonde, pressure transducer, staff gauge, solar panel, rain gauge, autosampler for CANARY and remote telemetry equipment. The station is docked on the stream bank where there is constant and substantial flow over the sonde. Flow data at this site is provided by a USGS station just downstream of the monitoring station, located near North Main Street by the railroad trestle.
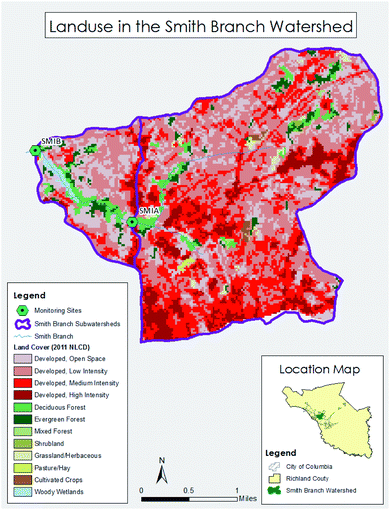
As part of this effort, dry weather screening procedures approved by SCDHEC to assess outfalls, identify illicit discharges and trace them back to their source were used. Fig. 4 shows the geographic location of land use and Table 1 contains the area for the major types of land use in the Smith Branch watershed. Table 2 summarizes some of the expected constituents that might be found in discharge or runoff associated with sources identified during the watershed source assessment.5
| Land use description | SMIA | SMIB | Total |
|---|---|---|---|
| Developed-open/low intensity | 2.99 | 0.76 | 3.75 |
| Developed-med/high intensity | 2.09 | 0.17 | 2.26 |
| Forest | 0.27 | 0.17 | 0.44 |
| Shrub/Grass/pasture | 0.07 | 0.00 | 0.07 |
| Cultivated crops | 0.02 | 0.00 | 0.02 |
| Wetlands/open water | 0.00 | 0.03 | 0.03 |
| Total area | 5.45 | 1.13 | 6.58 |
| Possible sources | Source constituent |
|---|---|
| Sanitary sewer | Total phosphorous, total nitrogen, ammonia, E. coli, metals, hardness, potassium, fluoride, surfactants |
| Car wash | Phosphates, oil & grease, metals (Pb, Cu, Cr), hardness, ammonia, potassium, fluoride, surfactants |
| Radiator flushing | Hardness, ammonia, potassium, fluoride, surfactants |
| Restaurants | Oil & grease |
| Healthcare (e.g., hospitals, clinics) | Metals (Cu, Cr, Fe, Hg, Pb), phosphates, chemical oxygen demand (COD), chlorine |
| Older communities | Surfactants |
| Office buildings | Chlorine |
3.2 CANARY event detection software
The CANARY Event Detection Software13 was used for this study. CANARY has two available algorithms: the Linear Prediction Coefficient Filter (LPCF) algorithm; and, the Multivariate Nearest Neighbor (MVNN) algorithm. LPCF establishes an acceptable amount of variability around a signals linear tendency based on input parameters (described below) and uses that to identify outliers and report alarms. MVNN groups signals into an m-dimensional multivariate space to determine the tendency of the signals and similarly can be tuned by input parameters. LPCF was used to conduct the data analysis for this study. Previous work,12,23 demonstrated that LPCF provided good true positive rates and did not suffer the higher false alarm rate experienced within MVNN and provided alarms for individual sensors or as groups. Four CANARY parameters were systematically varied to determine optimal performance (i.e., to minimize false alarms while maintaining true detections or change related to true event). These parameters were history window (HW: 24, 36, 40 and 48 timesteps), outlier threshold (OT: 0.5, 0.75, 1.0 and 1.25), BED window (Binomial Event Discriminator Window: 6, 8 and 10 timesteps) and event threshold (ET:BED-1 and BED-2 timesteps). A manual assessment of sensor data (discussed below in Manual Analysis and Data) was conducted to establish a list of “True Events”. An outlier is defined as any single datapoint that is determined by the algorithm to be outside the expected range for the given signal. An alarm is triggered when sufficient outliers occur within a group of past data—where the majority of the previous 6, 8 or 10 timesteps (for this study) needed to considered outliers in order to trigger an alarm.The objective of the parameter optimization step was to determine which set of parameters yielded the best performance. In the context of this work, “best performance” was attributed to maximizing true detection of events while minimizing the number of spurious or false alarms. Further discussion of this metric is discussed below.
3.3 Filtering rainfall events
Water quality changes associated with rainfall events were automatically filtered using ‘composite’ signals available within CANARY. Manual analysis of historical data identified rainfall events as those that caused a decrease in conductivity and increases in stage (i.e., depth) and turbidity. A composite signal was created that compared the current data point to an average value of the previous twenty-six values for that signal for conductivity, stage and turbidity. All three of the following conditions must have been true to trigger the rainfall filter: (1) turbidity increased by more than 30%, (2) conductivity decreased by more than 10% and (3) stage increased by more than 10%. If the conditions were met, then the composite signal was set to 1.0, which for a “calibration” datastream is considered true and the alarm behavior for all signals for that period is ignored. Fig. 5 depicts sensor data during a rainfall event (shaded) that was considered normal and CANARY was expected to ignore for alarm reporting (additional available sensor data omitted for clarity).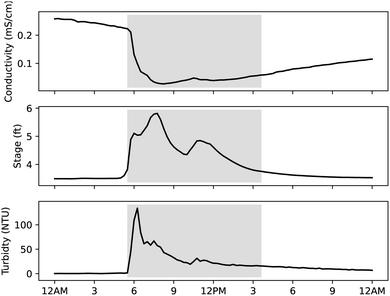 | ||
| Fig. 5 Example aay with rainfall event. Shaded area indicates the type of signal changes that are associated with rainfall. | ||
3.4 Manual analysis and data
Online monitoring data [May 9, 2014–March 31, 2016, 692 days] from ROCA and ROCB was used for the initial CANARY configuration. The available data was manually analyzed to create a list of suspected illicit events within the Rocky Branch watershed. Data was available at 15 minute intervals for 5 water quality sensors for each monitoring station: pH [—], stage [ft], dissolved oxygen [mg L−1], conductivity [mS cm−1] and turbidity [NTU].A suspected illicit event was considered to be a change in a signal (or signals) that was identified by visual inspection of plotted/displayed time-series sensor data. These suspected illicit events may have been associated with a sewer overflow or other illicit dumping or spill events. For this work, no attempt was made to establish the nature or cause of an event, only that sensor signal changed in a way that might indicate an illicit event had occurred. The list of manually identified ‘illicit’ events was then compared to the results from the different CANARY parameter cases.
A database query was used to automatically compare CANARY alarms to the manually identified list of events. Events that overlapped (partially or completely) were considered to be matches. In some cases multiple CANARY alarms occurred during the period of manually identified alarm due to the duration of some suspected events and a CANARY parameter that defines how long to allow an alarm to occur (i.e., event timeout).
3.5 Case study with automatic sampler
A case study is presented based on an ongoing monitoring effort of the Smith Branch watershed. The SMIA monitoring station was equipped with an ISCO 6712 automatic sampler and data from the multi-parameter sondes at that station was analyzed with CANARY. The automatic sampler was equipped with twenty four 1000 mL sample bottles. Sonde data was transmitted to a computer running CANARY, and results were returned to the datalogger after analysis. The automatic sampler was configured to collect samples if CANARY reported a probability of an event greater than sixty percent (60%), which was slightly lower than the condition that CANARY would return an alarm. This was done in part to capture samples that may not have resulted in an alarm within CANARY to determine if the parameters were appropriate in this application. Additional samples were also collected during low probability periods to help identify areas where CANARY or the sensors may not perform well for certain types of events.The automatic sampler operated during the second half of 2018. Six samples were collected, where two were collected during a low-probability period (LP1 & LP2) and four were collected when the probability calculated by CANARY was high (HP1–HP4). Samples were collected over a short period of time in order to try to capture the change for HP samples. Samples were analyzed for forty different constituents and some examples of results are presented below.
4 Results & discussion
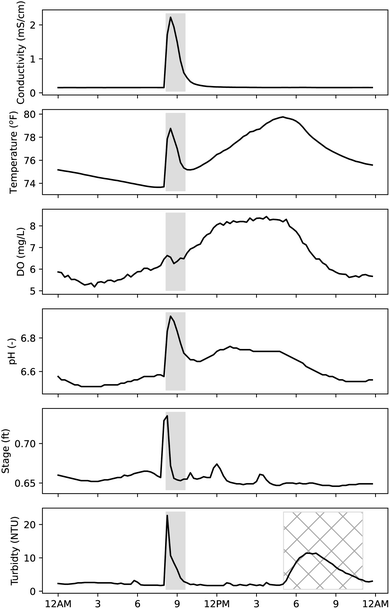
Fig. 6 demonstrates an example day with a suspected illicit event (shaded) and where CANARY produced an alarm. The suspected illicit event was observed to impact sensors at the site ROCA location beginning around 8 AM on this day. Peaks can be observed in all signals, but only causes a minor deviation in the DO signal. While this event demonstrated a situation where all signals had an impact on an alarm, CANARY can generate an alarm for one or more signals when using the LPCF algorithm. CANARY also produced an alarm for the second peak in the turbidity signal beginning around 5 PM (hatched). Since CANARY can be configured to use any or all of the signals and the alarm results can be examined to better understand what is causing various alarms.Manual inspection of data from site ROCA identified 52 suspected events and site ROCB identified 190 suspected events. Additionally, it was observed that conductivity changes were involved in most of these events, so CANARY was configured to only actively analyze the conductivity signal for the parameter selection step.
The best performing set of parameters for site ROCA generated alarms for 49 of the 52 manually identified events (94% agreement). The total number of alarms for this parameter set was 201 alarms, however, after further review 96 of the 152 additional alarms were determined to match the manual criteria for assessment and were determined to be “new true events”. This left 56 alarms as being ‘false alarms’ or 28% of alarms. Table 3 summarizes the number of alarms produced by CANARY and the number of unique manually identified events that were matched. For site ROCB, the best case matched 177 of 190 manually determined events (93%), added 97 new likely events, and had 147 false alarms (34%).
| BED | ET | OT | HW | |||
|---|---|---|---|---|---|---|
| 24 | 36 | 40 | 48 | |||
| 6 | 0.89063 | 0.5 | 1311(180) | 1013(179) | 949(178) | 834(178) |
| 0.75 | 1036(180) | 766(177) | 703(175) | 620(174) | ||
| 1.0 | 876 (181) | 634(174) | 582(174) | 502(168) | ||
| 1.25 | 659(178) | 508(169) | 467(165) | 426(156) | ||
| 0.98438 | 0.5 | 1226(187) | 985(182) | 930(180) | 820(178) | |
| 0.75 | 990(182) | 745(179) | 681(178) | 598(173) | ||
| 1.0 | 853(182) | 620(177) | 567(176) | 488(168) | ||
| 1.25 | 638(182) | 501(167) | 457(167) | 404(152) | ||
| 8 | 0.96485 | 0.5 | 1190(185) | 977(180) | 801(180) | 721(176) |
| 0.75 | 981(180) | 746(175) | 678(174) | 595(173) | ||
| 1.0 | 839 (178) | 623(172) | 573(171) | 485(165) | ||
| 1.25 | 641(178) | 505(166) | 466(164) | 418(154) | ||
| 0.9961 | 0.5 | 1155(179) | 940(176) | 901(174) | 787(175) | |
| 0.75 | 949(177) | 722(176) | 664(176) | 584(171) | ||
| 1.0 | 814(178) | 611(173) | 561(170) | 485(164) | ||
| 1.25 | 632(176) | 498(165) | 461(161) | 420(153) | ||
| 10 | 0.98926 | 0.5 | 1142(182) | 946(178) | 877(176) | 781(175) |
| 0.75 | 932(177) | 724(176) | 660(177) | 592(171) | ||
| 1.0 | 803 (177) | 608(175) | 561(171) | 483(164) | ||
| 1.25 | 616(178) | 509(167) | 461(163) | 415(151) | ||
| 0.99903 | 0.5 | 1079(197) | 914(177) | 860(173) | 763(173) | |
| 0.75 | 913(177) | 707(173) | 645(173) | 578(165) | ||
| 1.0 | 794(175) | 601(162) | 546(159) | 470(160) | ||
| 1.25 | 608(172) | 491(162) | 454(159) | 414(149) | ||
The additional 96 or 97 events that CANARY identified—that had previously not been identified—highlights the potential value for automated monitoring. Although humans are very adept at pattern recognition and identification there is a limit to their scope or number of inputs, and real-time analysis would require 24/7 staffing to achieve the same level of coverage provided by an event detection system approach. Further optimization of parameters may provide additional reductions in false alarms, however, the false alarm rate corresponded to one false alarm for every 5 days for site ROCB and 40% of initially unexpected alarms were determined to be relevant. This highlights the concept in event detection that the goal of parameter selection or optimization is not to eliminate all alarms but reduce alarms that provide a user with no valuable information.
This makes analysis at monitoring sites possible, which can potentially be used to manage data transmission during only “event” periods in addition to a periodic daily transmission. This may reduce the data transmission burden of remote installations. Further, small computers like the Raspberry Pi can be used to control or act as a data hub for other devices like automatic samplers, which could be triggered by CANARY alarms.
General trends can be observed in Table 3. Increasing the history window reduces the number of alarms, but also reduced the ability of CANARY to detect the previously identified events. This related to the ability of CANARY to deal with the diurnal patterns in the data, where larger history windows decreased sensitivity to changes by increasing the ‘normal’ variability as it related to longer historical periods. Increasing OT generally will reduce total alarms, but can result in a less noticeable reduction in the ability to detect desirable events. Previous work,23 suggested not exceeding an OT of 1.5–2.0 because overall sensitivity will be reduced. Similarly, increasing the length of the BED window, or the corresponding ET (values shown for BED-1 and BED-2 for each BED) will reduce total alarms while also generally reducing true alarm rate as well. The BED window and ET relate to how long of a signal change is needed trigger an alarm, where BED = 6 corresponds to 1.5 hours, while BED = 6 is 2.5 hours for the 15 minute data interval used here. Although these trends generally hold, there are cases where sensitivity does not decrease or even that more true alarms are observed while still reducing total alarms. This is related to the dynamic nature of CANARY's algorithm and the data being analyzed. If a signal change leads to a quicker and more correct identification of a data as an outlier, the more likely an alarm is identified. Another way of thinking about this is to say that if CANARY accepts an outlier as a good signal, the more likely it is to continue accepting outliers, because it increases the ‘normal’ variability. Distinct changes are likely still going to be identified as anomalous, but more gradual but still anomalous changes may go unnoticed with more variable background signal. While some parameter sets were able to detect nearly all of the 190 manually identified events, the false alarm rate averaged over 1 per day for that case. An additional parameter that was not modified in this work, event timeout, controls how long an alarm can occur before it is automatically reverted back to normal. This analysis was conducted using an event timeout of 36 timesteps (9 h), so longer events may have resulted in multiple alarms, which was not taken into account for Table 3. A systematic review of sensor data would be needed to fully optimize parameters, were that desired.
A thorough optimization related to the automatic rainfall event filtering was not undertaken for this work. Upon review of some alarm events, the characteristic changes that defined a rainfall even were close to being met but one or more of the thresholds was not met. Further refinement of filtering criteria could have been undertaken, but this use of composite signals to filter out undesirable alarms was a proof of concept that this could be achieved. In this study, rain gauge data was available; however, this data was not stored in the same datalogger file, making direct use by CANARY more difficult. Additionally, since rain gauge data may not be available for all sites and the use of a surrogate measure for rainfall within event detection systems could be valuable for similar applications where rain gauges were not used. Events could still be considered alarms if only two of the criteria were met—where for this system, if conductivity did not drop when increases are observed in turbidity and stage, and alarm could still be triggered. Fig. 5 highlights a scenario where all three signals are increasing, which could be associated with a spill or other illicit. This work does highlight the potential of using surrogate measures for filtering out “normal” changes in water quality related to rainfall.
The parameter selection step (i.e., tuning or optimization) may yield different parameters depending on the variability in the signals used for each site. The parameter values discussed herein were selected based on a general assessment of the sensor data at these sites but may be directly applicable to other locations(see23 for more information on parameter selection). In drinking water systems, the recommended history window values for the LPCF algorithm typically correspond to 1–1.5 days, where for these monitoring stations a maximum of only 0.5 days was considered to provide better sensitivity to the diurnal patterns found in the signal. The objective of the tuning step was to reduce false alarms while maximizing true alarms. If only false alarm reduction was used, then true detection rates are likely to decrease as well. Given the LPCF algorithm, the reduction in sensitivity to outliers required to eliminate all false alarms will typically also eliminate many small or medium sized changes that lead to some desirable alarms. This is in part related to the natural undulations found in some signals, where an algorithm that predicted those undulations well could be tuned to be very sensitive to changes relative the background but may require more data for training the predictor than is required by CANARY. The manual reexamination of the CANARY alarms highlighted that it was able to identify some events that had been previously missed by manual identification.
The use of a simpler set-point analysis approach may also have value in some applications but was not used here. For example, spikes in conductivity, turbidity or stage might be considered relevant of further investigation only if they exceed some value. This may also be true of pH, but as can be observed in Fig. 6, the natural variability range is about 6.5–6.8. The event that triggered an alarm exceeded pH 6.8, but smaller blips in that signal would not be captured even if they deviated from a typical daily pattern. Similarly, DO has a natural daily range of 5–8 mg L−1, and selection of a set-point range would miss anything that did not exceed these natural bounds. A more specific assessment of available data and its variability would be necessary if the use of set-points were to be attempted.
4.1 Automatic sampler results
Fig. 7 and 8 contain the various analytical results reported for the six samples collected during the study. Appendix Fig. 9–14 show the sensor data for the days corresponding to the automatically collected samples. Non-detects are shown as light gray bars at the detection limit for the analysis used. Chemical oxygen demand (COD) was only measured for HP4 at 160 mg L−1 with the remainder below the detection limit. Copper was only measured above the detection limit for HP1 at 5.9 mg L−1. HP1 was the only sample to have a detectable total Kjeldahl nitrogen (TKN) concentration of 0.66 mg L−1. Molybdenum was only found in LP2 above the detection limit at 42 μg L−1.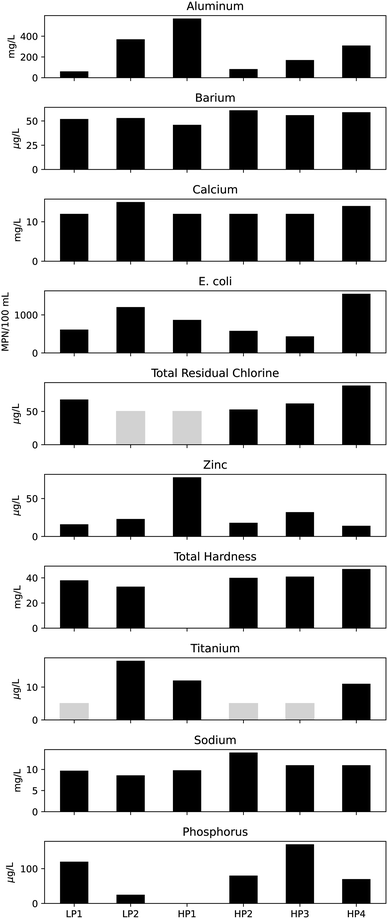 | ||
| Fig. 7 Results from analysis of samples collected with the automatic sampler (light gray bars reflect samples below detection limit). | ||
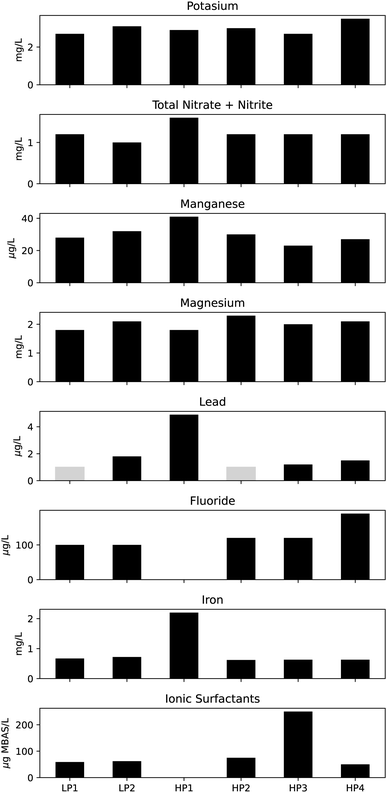 | ||
| Fig. 8 Additional results from analysis of samples collected with the automatic sampler (light gray bars reflect samples below detection limit). | ||
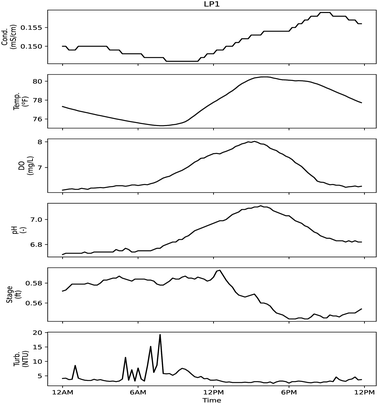 | ||
| Fig. 9 Sensor signals during day of sample LP1. Low probability sampling event did not correspond to a triggered CANARY alarm. Sample collected at 12:15 PM. | ||
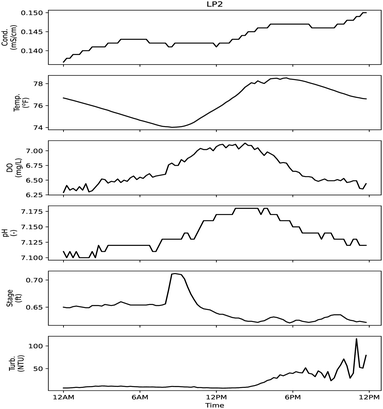 | ||
| Fig. 10 Sensor signals during day of sample LP2. Low probability sampling event did not correspond to a triggered CANARY alarm. Sample collected at 9:09 AM. | ||
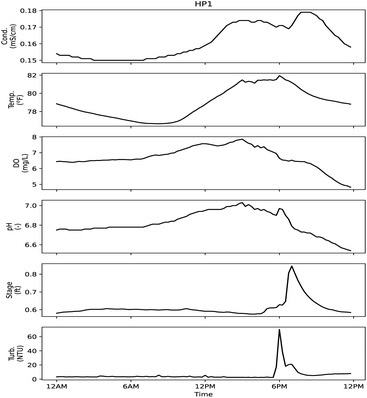 | ||
| Fig. 11 Sensor signals during day of sample HP1. High probability sampling event corresponded to an alarm at 4:09 PM related to the specific conductivity signal. | ||
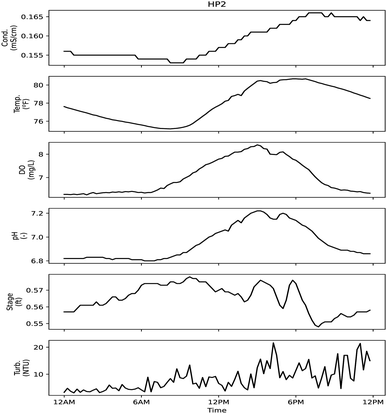 | ||
| Fig. 12 Sensor signals during day of sample HP2. High probability sampling event corresponded to an alarm at 9:30 AM related to the turbidity signal. | ||
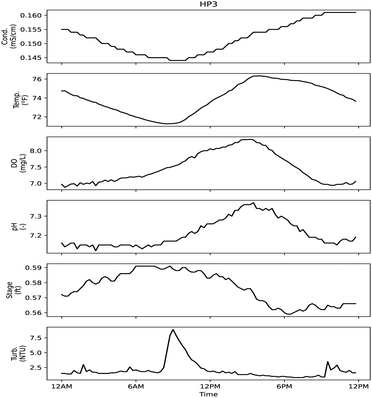 | ||
| Fig. 13 Sensor signals during day of sample HP3. High probability sampling event corresponded to an alarm at 9:33 AM related to the turbidity signal. | ||
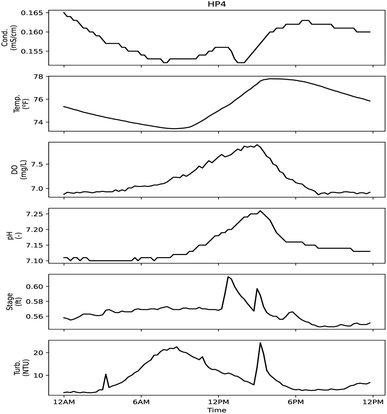 | ||
| Fig. 14 Sensor signals during day of sample HP4. High probability sampling event corresponded to an alarm at 10:29 AM related to the turbidity signal. | ||
Four of the six sensors used for monitoring may have responded to the constituents that were measured in samples, with stage and temperature providing information only about physical changes in the stream. HP1 was collected based on an alarm related to the specific conductivity sensor. This sample had an aluminum concentration of 570 mg L−1, and higher relative concentrations for lead (0.0049 mg L−1), iron (2.2 mg L−1) and zinc (0.078 mg L−1) compared to other samples. In is unclear if the conductivity sensor would be sensitive to these metals in the low mg L−1 concentrations. Following the collection of HP1, a malfunction to the automatic sampler was noted, so some caution should be used when considering that result. HP2–HP4 were collected based on an alarm related to the turbidity signal. With HP4, a high relative reading for E. coli, total chlorine and fluoride can be observed. HP3 had a high relative value for ionic surfactant concentration, but it is unclear if that could have triggered a turbidity alarm. HP2 has relatively higher values for sodium (14 mg L−1) and magnesium (2.3 mg L−1) but the alarm was caused by a turbidity signal. If a spill or dumping event disturbed the riverbed or neighboring bank, it could be enough to cause a turbidity alarm despite not being noteworthy based on those analyses being presented herein. Prior to full deployment of the automatic sampler, personnel were sent to investigate a turbidity event (probability 65%). It was discovered that a construction crew was using the stream to collect wash water for use elsewhere, but their activities had disrupted the signals being measured downstream.
This work did not set out to identify spill signatures, especially given the limited number of samples collected. Previous work has attempted to correlate surrogate sensor patterns to known injections in drinking water,23,25 but that was beyond the scope of this work. While no trends can be observed in the sample results this is not unexpected. Table 2 highlights the possible sources and the diverse nature of what might be related to those sources. The types of sensors used will dictate which of the constituents could be detected, but they only act as surrogate measures. Although all samples collected during this study were submitted for most analyses (excepting HP1, which was not submitted to all analyses), the analytical methods used can impact the source identification efforts.
The focus of this study was to test CANARY for an application related to illicit spill or dumping event identification. However, given the appropriate type of sensor, an event detection system (EDS, e.g., CANARY) could support a range of near real-time environmental monitoring applications. Harmful algal blooms impact both recreational and drinking water source uses of various water bodies, and impacted communities could use an EDS to support safe use of these resources. ORSANCO's ODS takes samples a few times per day during normal operation, but more frequently if results highlight a potential spill or there is a known spill. Given a suitable online sensor, an EDS could be used to analyze that data to provide more data to communities and trigger the GCs to take a sample based on this more frequent data source. Additionally, these smaller less complex online sensors could be deployed in more locations due to lower costs and reduced need for built infrastructure (needed for the GCs) providing more spatial knowledge. In addition to the monitoring goals discussed herein, communities may also be interested in understanding the impact of fecal coliform on recreational or other water bodies. CANARY or another EDS could be used in conjunction with EPA's Virtual Beach26 to support monitoring efforts and decision making surrounding these recreational water bodies; however, the objective and approach related to this monitoring may require different CANARY parameters or sensors than those discussed here.
Future efforts include continued use of CANARY in environmental monitoring applications. This could include additional usage of automatic samplers to provide additional validation or help identify weaknesses related to CANARY's algorithms. Further, new algorithms could be developed to better address or predict the natural background variability in signals that occurs in environmental systems. Continued work is also needed to more generally address rainfall events. An algorithm that better predicts expected trends in the expected sensor signals will be better able to identify outliers or rainfall events. Natural systems may require longer windows of historical data to be used to better capture the diurnal patterns that can occur. Further, research into multiple concurrent algorithms is needed that could provide both sensitivity and reduce false alarms, which is currently not available within CANARY.
5 Conclusion
The use of event detection software for analyzing surrogate (i.e., not with chemical specificity) online sensors may provide benefits to near real-time environmental monitoring applications—specifically those that hope to capture events related to signal changes that occur over short periods. This work demonstrated that CANARY was generally able to perform as well as previously used manual identification methods and was even able to identify previously unidentified events. The automatic treatment of rainfall events highlighted the potential for removing alarms associated with these natural events without an additional rainfall gauge, and allowed CANARY to be configured with more sensitivity while reducing false alarms.The previously used manual illicit event identification approach was time-consuming, cumbersome, and was often not performed in real-time. CANARY provided automated event detection, which would run continuously without personnel input and provided information about likely illicit events for further review. Further, the ability to link CANARY output to an automated sampler extended the usefulness by providing volumes of sampled water that were temporally correlated to a suspected event—where manual monitoring approaches may have introduced much longer delays, reducing the value of collected samples.
Monitoring watersheds is important to supporting ecological- and human-health. Biological and chemical species that enter a watershed can impact its health, and be a potential hazard to human health through fish or other animal consumption, recreational uses, or as water from a watershed impacts drinking water sources. Sensor-based monitoring with a near real-time tool like CANARY can provide timely information to decision makers, which can support improved data-driven response activities. These types of tools can result in efficiency gains for similar efforts by reducing manpower associated with monitoring sensor data, which can result in opportunities to add more monitoring data that could provide more spatial information for similar monitoring costs.
6 Disclaimer
The U.S. Environmental Protection Agency (EPA) through its Office of Research and Development participated in the research described herein. It has been subjected to the Agency's review and has been approved for publication. Note that approval does not signify that the contents necessarily reflect the views of the Agency. Any mention of trade names, products, or services does not imply an endorsement by the U.S. Government or EPA. The EPA does not endorse any commercial products, services, or enterprises. The contractors' role did not include establishing Agency policy.7 Appendix
The sensor signals for the automated samples are included in this Appendix. LP1 and LP2 were collected during periods when CANARY recorded low probability of an event, and HP1–HP4 were collected during periods of high probability.Author contributions
J.B. Burkhardt: conceptualization, methodology, investigation, writing – original draft preparation, data curation D. Sahoo: conceptualization, methodology, investigation, writing – original draft preparation, data curation, project administration M. Hammond: investigation, resources, writing – review & editing M. Long: investigation, resources, writing – review & editing T. Haxton: conceptualization, writing – original draft preparation R. Murray: conceptualization, supervision, writing – original draft preparation.Conflicts of interest
There are no conflicts to declare.Acknowledgements
The authors thank the City of Columbia, SC and Molly Davis and Amanda Douglas for project support.Notes and references
- USEPA, Federal Water Pollution Control Act, https://www.epa.gov/sites/production/files/2017-08/documents/federal-water-pollution-control-act-508full.pdf, 2002 Search PubMed.
- USEPA, Stormwater Phase II Final Rule: Illicit Discharge Detection and Elimination Minimum Control Measure., https://www3.epa.gov/npdes/pubs/fact2-5.pdf, 2000 Search PubMed.
- R. Pitt, A. Maestre and R. Morquecho, Proc. 2004 World Water and Environmental Resources Congress, 2004, pp.1–9 Search PubMed.
- R. Pitt, A. Maestre, R. Morquecho and D. Williamson, Stormwater and Urban Water Systems Modeling Conference: Models and Applications to Urban Water Systems, ed. W. James, CHI, vol. 12, 2004, pp. 257–294 Search PubMed.
- R. Pitt, Illicit Discharge Detection and Elimination, https://www3.epa.gov/npdes/pubs/idde_manualwithappendices.pdf, 2004 Search PubMed.
- D. Wilson, Proc. Of the Watershed 2002 Conf., 2002 Search PubMed.
- M. Leecaster, K. Schiff and L. Tiefenthaler, Water Res., 2002, 36, 1556–1564 CrossRef CAS PubMed.
- L. Duke, T. Lo and M. Turner, J. Am. Water Resour. Assoc., 1999, 35, 821–836 CrossRef CAS.
- J. Rasmussen, C. Lee and A. Ziegler, USGS. Scientific Investigations Report 2008-5014, 2006 Search PubMed.
- P. Lieberzeit and F. Dickert, Anal. Bioanal. Chem., 2009, 393, 467–472 CrossRef CAS PubMed.
- G. Mol, S. Vriend and P. van Gaans, Environmental Monitoring and Assessments, 2001, 68, pp. 313–335 Search PubMed.
- USEPA, Water Quality Event Detection System Challenge: Methodology and Findings Technical Report EPA-817-R-13-002, U.S. Environmental Protection Agency, Washington, D.C., 2013 Search PubMed.
- USEPA, CANARY User's Manual Version 4.3.2, https://cfpub.epa.gov/si/si_public_record_report.cfm?dirEntryId=253555, 2014 Search PubMed.
- D. Loureiro, C. Amado, A. Martins, D. Vitorino, A. Mamade and S. T. Coelho, Urban Water J., 2016, 13, 242–252 CrossRef.
- N. Nafsin and J. Li, J. Hydro-Environ. Res., 2021, 38, 117–128 CrossRef.
- USDHHS, West Virginia Chemical Spill, https://ntp.niehs.nih.gov/whatwestudy/topics/wvspill/index.html, 2020 Search PubMed.
- H. B. Glasgow, J. M. Burkholder, R. E. Reed, A. J. Lewitus and J. E. Kleinman, J. Exp. Mar. Biol. Ecol., 2004, 300, 409–448 CrossRef.
- J. G. Schulte and L. X. Ziolkowski, Source Water Protection on the Ohio River: Working Together to Protect Drinking Water, https://www.onewaterohio.org/docs/1000_ohio_river_valley_water_sanitation_commission_overview.pdf, 2013 Search PubMed.
- ORSANCO, Organics Detection System (ODS), http://www.orsanco.org/programs/organics-detection-system-ods/, 2020 Search PubMed.
- J. Hall, S. Panguluri, R. Murray and J. Burkhardt, Opflow, 2017, 43, 30–32 CrossRef PubMed.
- R. Kertesz, J. Burkhardt and S. Panguluri, World Environmental and Water Resources Congress 2014: Water without Borders - Proceedings of the 2014 World Environmental and Water Resources Congress, 2014, pp. 985–1000 Search PubMed.
- A. Leow, J. Burkhardt, W. Platten, B. Zimmerman, N. Brinkman, A. Turner, R. Murray, G. Sorial and J. Garland, Environmental Science: Water Research and Technology, 2017, 3, 224–234 Search PubMed.
- USEPA, Configuring Online Monitoring Event Detection Systems, https://cfpub.epa.gov/si/si_public_record_report.cfm?dirEntryId=287299, 2014 Search PubMed.
- S. Kshirsagar, J. Specht, S. Panguluri, J. Hall, T. Haxton and J. Burkhardt, Environmental & Water Resources Institute Conference, Sacramento, CA, 2017 Search PubMed.
- S. Panguluri, G. Meiners, J. Hall and J. Szabo, Distribution System Water Quality Monitoring: Sensor Technology Evaluation Methodology and Results, EPA/600/R-09/076, U.S. Environmental Protection Agency, Washington, DC, 2009 Search PubMed.
- USEPA, Virtual Beach, https://www.epa.gov/ceam/virtual-beach-vb, 2021 Search PubMed.
Footnote |
| † Data used to create figures can be found at https://www.data.gov |
| This journal is © The Royal Society of Chemistry 2022 |

