Magnetic exchange and valence delocalization in a mixed valence [Fe2+Fe3+Te2]+ complex: insights from theory and interpretations of magnetic and spectroscopic data†
Received
30th June 2022
, Accepted 22nd August 2022
First published on 22nd August 2022
Abstract
A mixed valence binuclear Fe2.5+–Fe2.5+ (Robin–Day Class III) transition metal complex, [Fe2.5+μTe2Fe2.5+]1−, composed of two FeN2Te2 pseudo-tetrahedral units with μ-bridging Te2− ligands was reported to exist in an unprecedented S = 3/2 ground state (Nature Chemistry, https://doi.org/10.1038/s41557-021-00853-5). For this and the homologous complexes containing Se2− and S2−, the Anderson-Hasegawa double exchange spin-Hamiltonian was broadly used to interpret the corresponding structural, spectroscopic and magnetic data. First principles multireference ab initio calculations are used here to simulate magnetic and spectroscopic EPR data; analysis of the results affords a rationale for the stabilization of the S = 3/2 ground state of the Fe2 pair. Complete Active Space Self-Consistent Field (CASSCF) calculations and dynamical correlation accounted for by means of N-Electron Valence Perturbation Theory to Second Order (NEVPT2) reproduce well the g-factors determined from simulations of X-band EPR spectra. A crucial technical tool to achieve these results is: (i) use of a localized orbital formulation of the many-particle problem at the scalar-relativistic CASSCF step; (ii) choice of state averaging over states of a given spin (at the CASCI/NEVPT2 step); and (iii) accounting for spin–orbit coupling within the non-relativistic Born–Oppenheimer (BO) many-particle basis using Quasi-Degenerate Perturbation Theory (QDPT). The inclusion of the S = 5/2 spin manifold reproduced the observed increase in the magnetic susceptibility (χT) in the high temperature range (T > 100 K), which is explained by thermal population of the S = 5/2 excited state at energy 160 cm−1 above the S = 3/2 ground state. Theoretical values of χT from experimentally reported data points in the temperature range from 3 to 30 K were further computed and analyzed using a model which takes spin–phonon coupling into account. The model considerations and the computational protocols of this study are generally applicable to any Class I/II mixed valence dimer. The work can potentially stimulate further experimental and theoretical work on bi- and oligonuclear transition metal complexes of importance to bioinorganic chemistry and life sciences.
1. Introduction
Mixed-valence transition metal compounds are of great prominence in bioinorganic chemistry. The oxygen evolving complex, a Mn3+3Mn4+CaO5 cluster catalyzing water splitting (2H2O → O2 + 4H+ + 4e−) in the cycle of photosystem II1 of natural photosynthesis and the iron-molybdenum cofactor (FeMoco), a Fe2+Fe2.5+4Fe3+2Mo3+S9C complex (Fig. 1), facilitating formation of ammonia from atmospheric N2 in a well-known, but yet not completely understood biological nitrogen fixation process,2 are prominent examples, among many others. To achieve reliable information about the electronic and geometric structure of these oligonuclear open-shell spin systems, a combination of spectroscopic techniques – electron paramagnetic resonance (EPR), Mössbauer spectroscopy, element and spin-specific X-ray spectroscopies, and single X-ray crystal structural determinations, all aided by theoretical calculations,2,3 have been employed with some initial success. For such big molecules, geometry optimizations and spin-spin coupling computed using broken symmetry Density Functional Theory4,5 (DFT) was (and still is) the only practicable tool.6,7Ab initio multireference approaches have been applied with some success to mono- and binuclear transition metal dimers,8,9 but, because of the large system size of real systems, are impractical in computing and analyzing electronic structures of complexes with three or more spin centers and two or more unpaired electrons per site. In order to understand the electronic structure of such large clusters using a bottom up approach, one possible choice is to consider mono- and binuclear subunits of the big cluster by using diamagnetic substitution of all other centers. Taking for example the FeMoco complex (Fig. 1), diamagnetic substitution of Zn2+ and Ga3+ in place of Fe2+ and Fe3+, respectively, would allow for the determination of their magnetic tensors and of the spin-Hamiltonian parameters. These centers would then be coupled in a second step into a (composed) model Hamiltonian of the entire cluster. In an attempt to approach this goal experimentally, a series of binuclear complexes [L2Fe2Q2]− with Q2 bis-μ bridging S2−, Se2− and Te2− ligands supported by β-diketiminate terminal ligands (L) have been recently reported and characterized by X-ray structural analysis, X-band EPR, Mössbauer spectroscopy and magnetometry (Fig. 2a).10 While the S2− (1) and Se2− (2) congeners feature two overlapping quadrupole doublets in a 1![[thin space (1/6-em)]](https://www.rsc.org/images/entities/char_2009.gif) :
:![[thin space (1/6-em)]](https://www.rsc.org/images/entities/char_2009.gif) 1 ratio, reflecting valence localized formally high-spin Fe2+ (d6) and Fe3+(d5) centers (Robin–Day Classes I or II),11 the Mössbauer spectrum of the Te2− analogue (3, Fig. 2b) shows a single quadrupole doublet at T = 80 K, suggesting a fully valence delocalized formally Fe2.5+–Fe2.5+ complex (Robin–Day Class III).11 This finding is further supported by the X-ray structure with two crystallographically equivalent iron sites. X-Band EPR spectra of frozen solutions of 3 (Fig. 2c) have been simulated employing a S = 3/2 spin Hamiltonian. From the interpretation of the EPR-spectrum using a S′ = 1/2 pseudo-spin, large anisotropic g-factors (g = 5.740, 1.950 and 1.515) have been determined (Fig. 2c).10 The low field EPR transition (corresponding to g = 5.740) was relatively sharp; the dependence of its Lorentzian linewidth above T = 10 K allowed estimation of the energy separation between the ground and first excited spin state assuming an Orbach relaxation mechanism. This afforded an upper limit for the axial zero-field splitting parameter: D ≤ 15 cm−1.10 A very large orthorhombic |E/D| ratio (close to the limiting value of 1/3), was extracted from the simulation of the EPR spectrum.10 Variable-temperature SQUID magnetic susceptibility data of solid powder samples (Fig. 2d) has been interpreted using the Bleaney–Bowers equation for mixed valence complexes considering the magnetic exchange between the high-spin Fe2+ (S1 = 2) and Fe3+ (S2 = 5/2) centers (Heisenberg exchange Hamiltonian Hexch = −2JŜ1·Ŝ2) and a double exchange term, Htrans = −B
1 ratio, reflecting valence localized formally high-spin Fe2+ (d6) and Fe3+(d5) centers (Robin–Day Classes I or II),11 the Mössbauer spectrum of the Te2− analogue (3, Fig. 2b) shows a single quadrupole doublet at T = 80 K, suggesting a fully valence delocalized formally Fe2.5+–Fe2.5+ complex (Robin–Day Class III).11 This finding is further supported by the X-ray structure with two crystallographically equivalent iron sites. X-Band EPR spectra of frozen solutions of 3 (Fig. 2c) have been simulated employing a S = 3/2 spin Hamiltonian. From the interpretation of the EPR-spectrum using a S′ = 1/2 pseudo-spin, large anisotropic g-factors (g = 5.740, 1.950 and 1.515) have been determined (Fig. 2c).10 The low field EPR transition (corresponding to g = 5.740) was relatively sharp; the dependence of its Lorentzian linewidth above T = 10 K allowed estimation of the energy separation between the ground and first excited spin state assuming an Orbach relaxation mechanism. This afforded an upper limit for the axial zero-field splitting parameter: D ≤ 15 cm−1.10 A very large orthorhombic |E/D| ratio (close to the limiting value of 1/3), was extracted from the simulation of the EPR spectrum.10 Variable-temperature SQUID magnetic susceptibility data of solid powder samples (Fig. 2d) has been interpreted using the Bleaney–Bowers equation for mixed valence complexes considering the magnetic exchange between the high-spin Fe2+ (S1 = 2) and Fe3+ (S2 = 5/2) centers (Heisenberg exchange Hamiltonian Hexch = −2JŜ1·Ŝ2) and a double exchange term, Htrans = −B![[T with combining circumflex]](https://www.rsc.org/images/entities/i_char_0054_0302.gif) 12 accounting for the transfer of the extra electron in the 3d-shell of Fe2+ (d6) [described by B-the transfer (hopping) energy] to the half field open d-shell of Fe3+ (d5). Because of the equivalence of the two valence forms (Fe12+(d6)–Fe23+(d5) and Fe13+(d5)–Fe22+(d6)), each spin of the exchange coupled iron centers (S = |S1 − S2|, |S1 − S2| + 1, … |S1 + S2| (S = 1/2, 3/2, 5/2, 7/2 and 9/2) appears in pairs which are split into two sublevels by electron transfer. To describe and interpret the spectra and magnetic properties of these systems, the Anderson–Hasegawa double exchange model yielding eqn (1.1) for the dependence of the energy on the spin S has been extensively used.12–15
12 accounting for the transfer of the extra electron in the 3d-shell of Fe2+ (d6) [described by B-the transfer (hopping) energy] to the half field open d-shell of Fe3+ (d5). Because of the equivalence of the two valence forms (Fe12+(d6)–Fe23+(d5) and Fe13+(d5)–Fe22+(d6)), each spin of the exchange coupled iron centers (S = |S1 − S2|, |S1 − S2| + 1, … |S1 + S2| (S = 1/2, 3/2, 5/2, 7/2 and 9/2) appears in pairs which are split into two sublevels by electron transfer. To describe and interpret the spectra and magnetic properties of these systems, the Anderson–Hasegawa double exchange model yielding eqn (1.1) for the dependence of the energy on the spin S has been extensively used.12–15| | | E±(S) = −JS(S + 1) ± B(S + 1/2) | (1.1) |
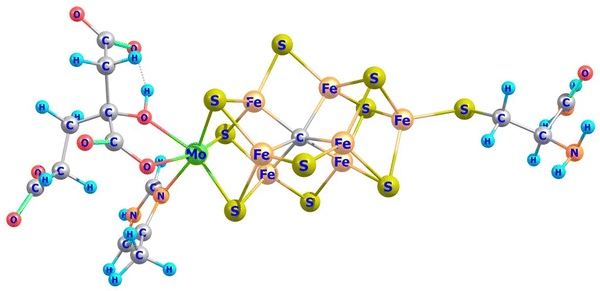 |
| | Fig. 1 Model complex for the iron-molybdenum cofactor (FeMoco) from a DFT geometry optimization of the resting S = 3/2 state.3 The Figure has been constructed here after deleting water and other neutral residues used for a correct account of the FeMoco cluster anchored to the protein. The cluster allows one to study the local electronic structures of the Mo and Fe centers and of the binuclear subunits -the three MoμS2Fe, FeμS2Fe and Fe-μC/SFe dimer units in dependence on the oxidation state and the electron counts on each center − d2(Mo4+)/d3(Mo3+) and d5(Fe3+) and total cluster charges −1/−2. | |
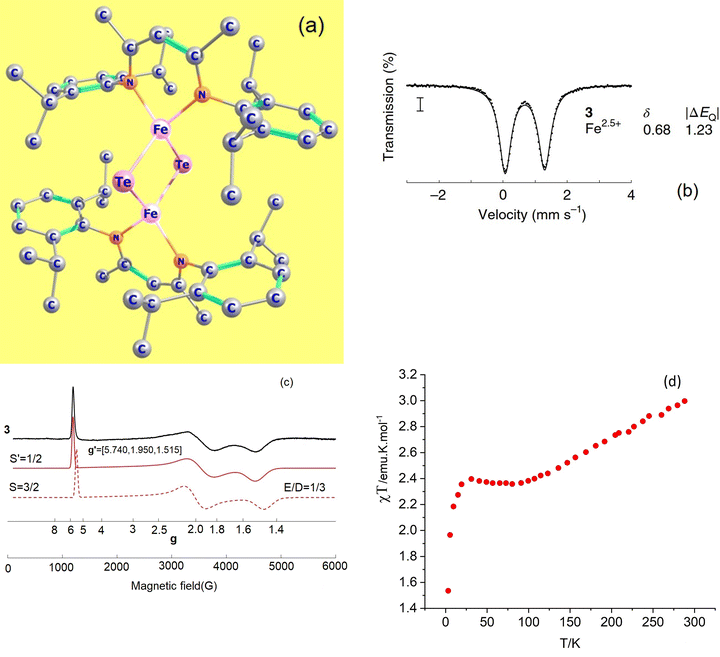 |
| | Fig. 2 Experimental X-ray structure of the mixed valence complex Fe2.5+-μTe2-Fe2.5+ (a); its T = 80 K Mössbauer spectrum in zero magnetic field (b); continuous-wave X-band EPR spectrum (9.63 GHz) of a frozen solution at 3.6–8 K, collected under non-saturating microwave power conditions (black line) and simulations (red lines): pseudo-spin S′ = 1/2, g′ = 5.740, 1.950, 1.515 (solid red line) and a S = 3/2, spin-Hamiltonian, |D| ≫ hν, |E/D| = 1/3 (assuming g = ge = 2.0023) and a value of D < 15 cm−1, estimated from the temperature dependence of the Lorentzian linewidth (c), variable-temperature SQUID magnetic susceptibility of a solid sample (d); data have been reproduced in a modified form from J. T. Henthorn, G. E. Cutsail III, T. Weyhermüller and S. DeBeer, “Stabilization of intermediate spin-states in mixed-valence diiron dichalcogenide complexes”, Nat. Chem., https://doi.org/10.1038/s41557-021-00853-5. | |
The iron centers in 1, 2 and 3 couple antiferromagnetically (J < 0), leading to a dependence of the lower energy branch E−(S)/|B| on the ratio |B/J| (Fig. 3) which shows, that S = 3/2 may become the ground state in the 3 < |B/J| < 5 range. From the simulation of χT vs. T, values for J and B of −200(25) and 750(110) cm−1, respectively, have been reported.10 The model was refined by introducing vibronic coupling.10 In the linear coupling limit, the effect of vibronic coupling on the spin levels is quantified by the vibronic coupling energy λ = V2/K (eqn (1.2), but notice the presence of an erroneous factor of (1/2) in the square root of eqn (2) and somewhat different notations used in ref. 10), with V- the linear vibronic coupling, K- the harmonic force constant, and q- the displacement along the symmetry breaking vibrations q = (V/K)x−(q-in Å, x−-dimensionless, Fig. 4a). This effective normal mode q is not an eigenfunction of the vibrational Hamiltonian but a superposition of several normal modes, approximated in ref. 10 (and also here), by a uniform shift of the two μ-bridging tellurium ligands from the left to the right of the symmetric Fe2.5+–Fe2.5+ pair or vice versa,16 thus assisting localizations into Fe12+(d6)–Fe23+(d5) and Fe13+(d5)–Fe22+(d6) distorted structures, respectively.
| | | E(S, ∓) = −JS(S + 1) + (1/2)λx−2∓[λ2x−2 + B2(S + 1/2)2]1/2 | (1.2) |
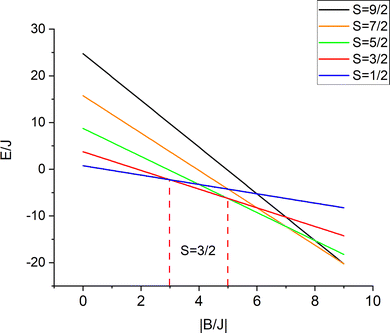 |
| | Fig. 3 Energies of spin levels E(S, −)/J versus the |B/J| ratio; in a 3 < |B/J| < 5 range the = 3/2 state is stabilized with respect to the other spin states. | |
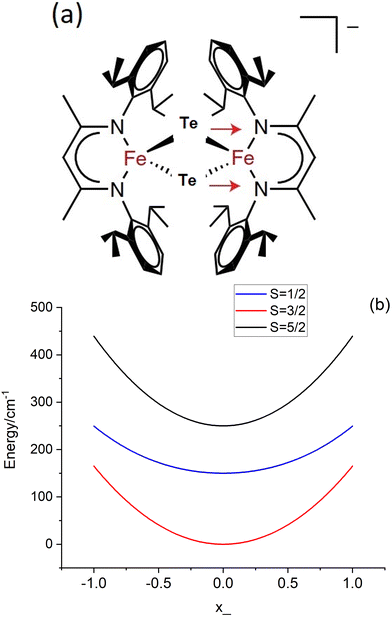 |
| | Fig. 4 (a) Representation of the anion [L2Fe2μTe2]−, the red arrows depict the asymmetric (symmetry breaking) mode (q); (b) adiabatic ground state (S = 3/2) and two lowest (S = 1/2, S = 5/2) excited states along q; The curves were plotted taking the values of J = −200 cm−1 and B = 750 cm−1 (from ref. 10) and the vibronic coupling energy λ = 480 cm−1 (see Table 7). | |
Using the previously reported values, J = −200 cm−1, B = 750 cm−1 (B/J = 3.7),10 and λ = 480 cm−1 (see Section 7; notice the 3.5 times larger reported value λ = 1675 cm−1 ref. 10, which in turn leads to a S = 1/2 ground state), we illustrate in Fig. 4b the dependence of the lower energy branches E(S, −) on the nuclear coordinate q for the lowest S = 1/2, 3/2 and 5/2 spin states. This set of parameters correctly reproduce the stabilization of the S = 3/2 ground state in a range −0.95 < q < 0.95 with a single minimum corresponding to a non-distorted (symmetric) structure and an energy separation between the ground S = 3/2 and the lowest S = 1/2 excited state of Δ = [E(1/2, −) − E(3/2, −)]q=0 = 150 cm−1. This is comparable to the vibrational energy ħω = 140 cm−1 and indicates the break-down of the Born–Oppenheimer approximation (BOA) for 3, which is only fulfilled if Δ ≫ ħω. It is the main goal of the present work to compute and analyze, using first principles multireference ab initio calculations, the electronic structure and magnetic and spectral properties of 3 going beyond the BOA by taking spin–phonon coupling into account.
2. Outline
Mixed valence dimers of transition metals represent a challenge to first principle (ab initio) quantum chemistry studies. Here we apply a computational protocol put forward by Domingo et al.17 and implemented in the program package ORCA.18,19 Its application to 1 and 2 allowed for computing and reproducing, with a reasonable accuracy, the Heisenberg exchange coupling parameters.20 In Section 3 the various steps according to the implementation of this protocol in the ORCA code and its application to 3 will be described. In this work we use a bottom-up approach toward the analysis and understanding of the electronic structure and magnetic properties of 3. We first characterize the high-spin Fe2+(d6) and Fe3+(d5) coordination centers by artificially eliminating exchange and electron transfer (Section 4). This is achieved using diamagnetic substitution of Fe3+ and Fe2+ by the closed shell Ga3+ and Zn2+ ions, respectively. In the same section Ab Initio Ligand Field Theory (AILFT)21–23 is applied to characterize the iron-ligand bonding with special emphasis on the bridging tellurium ligands and the effect of low-symmetry on the local (single ion) zero-field splitting (ZFS), the D-tensor and the g-factors (g-matrix). In section 5 we employ results from scalar relativistic CASSCF24 calculations to quantify the Heisenberg exchange within the Fe2+(d6)–Fe3+(d5) pair, keeping to a description which utilizes localized 3d-orbitals. The effect of dynamical correlation as well as the extension of the CAS(11,10) active space with the valence 5p electrons of tellurium on the Heisenberg exchange (the value of J) will be analyzed. Dynamical correlation has been accounted for using NEVPT2.25–27 In Section 6 parameters of the spin-Hamiltonian inferred from SOC calculations of the Fe2+(d6)–Fe3+(d5) cluster are used to compute anisotropic g-factors and characterize the magnetic response of the thermally populated magnetic sublevels originating from the S = 1/2, 3/2, 5/2, 7/2 and 9/2 spin states. Section 7 is dedicated to the computation of vibronic coupling parameters defining the adiabatic potential of the S = 3/2 ground state under the scalar relativistic and spin–orbit coupling regime. Derivation and application of the formalism used to compute vibronic levels and wave functions and magnetic expectation values of valence delocalized Fe2.5+–Fe2.5+ complex (Class III) is the subject of Section 8. In Section 9 a critical evaluation of the double-exchange Hamiltonian in light of the results herein is briefly discussed. Finally, in Section 10 we summarize the conclusions of this work with outlooks for further applications using the same formalism.
3. The computational protocol
All computations were carried out using the recent release of the ORCA code.18,19 A model for complex 3′ was derived from the X-ray structure of 3 by replacing the bulky substituents (1,3-diisopropylcyclohexa-1,3,5-trienyl groups) at each N-donor with methyl groups. The X-ray geometry of the N2FeTe2FeN2 core was then kept frozen, while Cartesian coordinates of the methyl groups were optimized using density functional theory (DFT). Coordinate axes orientations facilitating ligand field interpretations of the results are shown in Fig. 5.
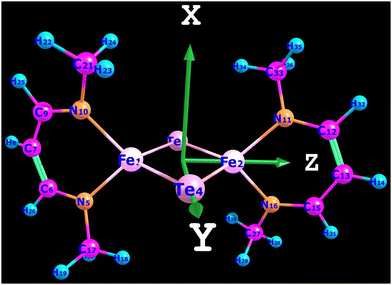 |
| | Fig. 5 Model complex 3′ and Cartesian axes orientation. | |
(1) CASSCF/NEVPT2 wave functions/energies of the states split out from the d6 (Fe2+) and d5 (Fe3+) configurations of iron in the diamagnetically substituted model complexes Fe2+(d6)Ga[ZnFe3+(d5)] (keeping to the same geometry as 3′), the five, 5 S = 2(45 S = 1) [1 S = 5/2(24 S = 3/2)], provide the many-particle basis for SOC calculations. These yield fine structure tensors – the ZFS tensor D and g-matrices of the spin-Hamiltonians of the S = 2[S = 5/2] ground states of the Fe2+[Fe3+] centers. Iron-ligand bonding was characterized using AILFT,21–23 which allows for the determination of the respective 5 × 5 ligand-field matrices. The latter were further analyzed using the angular overlap model (AOM).28,29 A best fit to the five diagonal and ten off-diagonal matrix elements affords bonding parameters which quantify the σ and π donor functions of the bridging tellurium and terminal nitrogen ligands.
(2) Energies of the lowest spin-levels of the Fe2+–Fe3+ exchange coupled pair (the ladder of spin-states) were computed using the non-distorted centrosymmetric structure of 3′. The five S1 = 2 states on Fe2+(left) couple with the S2 = 5/2 ground state of Fe3+ (right) yielding a manifold of five roots of each cluster total spin S (“%casscf, mult 2,4,6,8,10, nroots 5,5,5,5,5”). Already a small artificial shift by 0.01 Å of the two bridging tellurium atoms from Fe2+(left) to Fe3+(right) was enough to trigger Fe2+(d6)–Fe3+(d5) localization. The resulting “geometry, basis, wavefunctions” file, “gbw” provides a proper orbital guess in all calculations, both of the centrosymmetric and the geometrically distorted N2FeTe2FeN2 cores. An important condition for the convergence of these calculations is keeping to the use of local orbitals at each and every step of the CASSCF procedure of the optimization of orbitals and CI coefficients (“%casscf, actorbs unchanged, actconstraints 1”). Different amounts of spin dependent dynamical correlation require computing each spin state of lowest energy separately (state and spin specific CASSCF with an active space consisting of 11 electrons distributed on 10 local 3d-MOs, CAS(11,10) followed by NEVPT2). Because of the two possible localizations of the extra electron, each spin state is, to a first approximation, doubly degenerate. Owing to the non-orthogonality and interactions of the localized wave functions describing the two open-shell iron centers, small splitting for each pair of spins results. This requires including both states in a given run (“%casscf, mult 2S + 1, nroots = 2”). Averaging the energies of the two roots for each spin affords the energies of the spin-ladder and extraction of the Heisenberg exchange and biquadratic exchange parameters, J and J′, respectively, from a best fit to the energies. To study the effect of the tellurium ligands on J and J′, an extended active space was introduced, including six more doubly-occupied valence orbitals (the 5px,5py,5pz AOs on each tellurium) and 12 more electrons, CAS(23,16).
(3) Accounting for SOC in the CAS(11,10) scalar relativistic state manifold (configuration state functions (CSFs)), inclusion of 27720, 19![[thin space (1/6-em)]](https://www.rsc.org/images/entities/char_2009.gif) 800, 4950, 440 and 10 CSFs for S = 1/2, 3/2, 5/2, 7/2 and 9/2, respectively, is mandatory in order obtain ZFS tensors D and g-matrices for a direct comparison with experimental – EPR and magnetic data. In the ORCA code this is achieved using QDPT30,31 by diagonalization of the SOC Hamiltonian within the many particle basis of the CASSCF wave functions, large enough in order to capture properly the effect of SOC on the lowest, thermally-accessible magnetic sublevels. It follows that SOC calculations can never be state-specific and of the same quality as the scalar relativistic S states of lowest energy (see above). A compromise between accuracy and feasibility is inevitable. A trial and error analysis has shown that taking the 40 lowest scalar relativistic roots is enough to properly approximate the ZFS tensor D and g-matrices of the spin-Hamiltonians of the lowest levels for each spin. To this end, wave functions from a converged CASSCF calculation resulting from the “%casscf, mult 2,4,6,8,10, nroots 5,5,5,5,5” option were employed as the input for a spin-specific, state average SOC calculation using simple Complete Active Space Configuration Interaction, CASCI (i.e. not iterating orbitals, “%casscf maxiter 1, mult 2S + 1, nroots 40” but accounting for dynamical correlation “nevpt2 true”).
800, 4950, 440 and 10 CSFs for S = 1/2, 3/2, 5/2, 7/2 and 9/2, respectively, is mandatory in order obtain ZFS tensors D and g-matrices for a direct comparison with experimental – EPR and magnetic data. In the ORCA code this is achieved using QDPT30,31 by diagonalization of the SOC Hamiltonian within the many particle basis of the CASSCF wave functions, large enough in order to capture properly the effect of SOC on the lowest, thermally-accessible magnetic sublevels. It follows that SOC calculations can never be state-specific and of the same quality as the scalar relativistic S states of lowest energy (see above). A compromise between accuracy and feasibility is inevitable. A trial and error analysis has shown that taking the 40 lowest scalar relativistic roots is enough to properly approximate the ZFS tensor D and g-matrices of the spin-Hamiltonians of the lowest levels for each spin. To this end, wave functions from a converged CASSCF calculation resulting from the “%casscf, mult 2,4,6,8,10, nroots 5,5,5,5,5” option were employed as the input for a spin-specific, state average SOC calculation using simple Complete Active Space Configuration Interaction, CASCI (i.e. not iterating orbitals, “%casscf maxiter 1, mult 2S + 1, nroots 40” but accounting for dynamical correlation “nevpt2 true”).
(4) The Adiabatic Potential Energy Surface (APES) resulting from the scalar relativistic calculation of the S = 3/2 ground state of 3′ was derived using a scan of the total CASSCF/NEVPT2 energy along the q mode in the spin-free space. The SOC calculation of the APES of the ground state Kramers quartet was accomplished by a Herzberg-Teller expansion of the full ZFS tensor D (not the traceless one) and the g-matrix up to second order in q.
(5) The formalism employed to calculate vibronic wave functions, energy levels, the ZFS and g-matrices using of 3′ is described in Section 8.
Throughout this work Douglas–Kroll–Hess scalar relativistic basis sets, DKH-Def2-TZVP32,33 for all elements were employed, except for tellurium where “old-DKH-TZVP” was used. More details and sample input files used in the calculations may be found in the electronic (ESI†).
4. Electronic structure and magnetic anisotropy of the Fe2+Te2N2 and Fe3+Te2N2 complex units: ab initio ligand field analysis of the Fe–Te and Fe–N bonding
In tetrahedral complexes and coordinate axes orientations shown in Fig. 5, the 3d-orbitals split into e(dxy, dz2) and t2(dx2−y2, dxz and dyz) MO subsets, which are π- and σ + π antibonding, respectively. Ab initio ligand field diagrams for the Fe2+ and Fe3+ sites are depicted in Fig. 6. Orbital contour plots of the Fe2+ complex (Fig. 6, left) show significant participation of ligand functions in the upper (t2) subset and almost no such ligand tails in the lower e subset with a tiny low-symmetry splitting. Orbital energy splitting is much larger in the Fe3+ complex (Fig. 6, right) where both the t2 and the e -type orbitals are affected by the symmetry lowering. This symmetry lowering stems for the presence of two different ligands in the coordination sphere of the two centers – two nitrogen and two tellurium ligands with quite different donor properties. While tellurium can be considered as σ and a weaker π-donor, for ketimine nitrogen being an sp2-type ligand both σ and out-of-plane π interactions (in-plane nitrogen orbitals are involved in strong interactions with their neighboring carbon atoms) with iron are expected. This is supported by values of the antibonding energies extracted from a best fit of matrix elements of the 5 × 5 ligand field matrix parametrized using the AOM. When applied to the Fe2+N2Te2 and Fe3+N2Te2 complex units the general matrix element of the ligand field matrix is given by eqn (4.1)| | 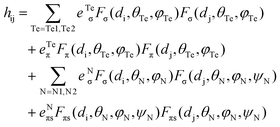 | (4.1) |
While the factors “F” in this equation account for the dependence of the ligand field on the angular geometry described by the Euler angles θ, φ and ψ (in the case of Nimin), the pre-factors eTeσ, eTeπ and eNσ, eNπs quantify the energy of antibonding imposed by the tellurium and nitrogen donors, respectively. Values of these parameters listed in Table 1 reflect the weak ligand field in the case of Fe2+ with almost zero contributions from eTeπ and the much stronger ligand field for Fe3+ where for both tellurium and nitrogen, appreciable contributions from both σ and π (out-of-plane in the case of Nimin)-type antibonding to the ligand field splitting are computed. In addition to the effect of the ligands on the low-symmetry splitting of the parent tetrahedral orbitals, the large deviations of the Te–Fe–Te and N–Fe–N angles (104° and 91°, respectively) from the angle of an ideal tetrahedral geometry (109.47°) on both Fe2+ and Fe3+ sites contribute to the lower symmetry. The rather low effective symmetry on each site is also reflected in the large anisotropy of the S = 2 ground state ZFS tensor for the Fe2+ site with D = −4.205 cm−1 and quite large orthorhombic splitting ratio E/D = 0.110; an even larger orthorhombicity (in agreement with the stronger ligand field), E/D = 0.295 for the S = 5/2 ground state at the Fe3+ site is computed. In Table 2 we list S = 2 spin-allowed d-d transitions for Fe2+ and the lowest spin-forbidden S = 5/2 to S = 3/2 transitions for Fe3+, SOC splitting of the S = 2 and S = 5/2 ground states and anisotropic spin-Hamiltonian g-factors for Fe2+. As will be shown in the next Section, these findings help rationalize the magnetic anisotropy of the exchange coupled iron pair.
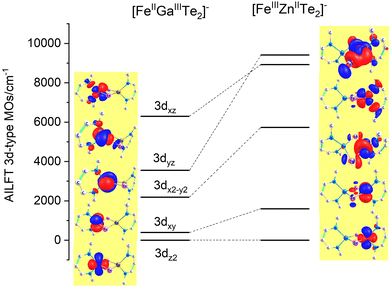 |
| | Fig. 6 AILFT 3d-MO energies and orbital contour plots (contour values: 0.030 e Bohr−3) from CASSCF/NEVPT2 calculations of the diamagnetically substituted Fe2+μTe2Ga3+ (left) and Zn2+μTe2Fe3+ (right) model complexes with the geometry of 3′. For the Cartesian axes orientation see Fig. 5; orbital notations are based on the leading contribution of the corresponding AILFT MO as follows (in %): 3dz2(87), 3dxy(99) 3dx2−y2(87), 3dyz(95), 3dxz(100%) (FeII, left) and 3dz2(69), 3dxy(100) 3dx2−y2(69), 3dyz(98) 3dxz(99%) (FeIII, right). | |
Table 1 AILFT ligand field 3d-MO energies (NEVPT2) and local AOM parameters (in cm−1) for the Fe2+μTe2Nimin2 and Fe3+μTe2Nimin2 model complexes derived from corresponding diamagnetically substituted [FeGaTe2]+ and [FeZnTe2]+ model clustersa
| 3d-Type MOs(Td) |
Fe2+μTe2Nimin2 |
Fe3+μTe2Nimin2 |
|
Symmetry notations for the parent tetrahedral (Td) point group are listed in parenthesis.
|
| 3dz2(e) |
0 |
0 |
| 3dxy(e) |
395 |
1595 |
| 3dx2−y2(t2) |
2184 |
5735 |
| 3dyz(t2) |
3550 |
8931 |
| 3dxz(t2) |
6296 |
9415 |
|
e
Teσ
|
2188 |
7552 |
|
e
Teπ
|
33 |
2619 |
|
e
Niminσ
|
4243 |
6277 |
|
e
Niminπs
|
434 |
850 |
| Rms deviation NEVPT2/comp. |
256 |
426 |
Table 2 Scalar relativistic d–d transitions, ground state SOC zero-field split sublevels, spin-Hamiltonian zero-field-splitting parameters D, E/D and g-factors of Fe2+μTe2Nimin2 and Fe3+μTe2Nimin2 from CASSCF/NEVPT2 calculations of Fe2+μTe2Ga3+ and Zn2+μTe2Fe3+ diamagnetic substitutions of 3′a
| Fe2+Te2N2 |
Fe3+Te2N2 |
|
KD = Kramer's doublet.
|
| d–d Transitions/NEVPT2/cm−1 |
d–d Transitions/NEVPT2/cm−1 |
|
S = 2 5E 0 |
S = 5/2 6A1 0 |
|
S = 2 580 |
S = 3/2 4T1 19![[thin space (1/6-em)]](https://www.rsc.org/images/entities/char_2009.gif) 218 218 |
|
S = 2 5T2 2490 |
19![[thin space (1/6-em)]](https://www.rsc.org/images/entities/char_2009.gif) 588 588 |
|
S = 2 4503 |
23![[thin space (1/6-em)]](https://www.rsc.org/images/entities/char_2009.gif) 163 163 |
|
S = 2 7521 |
S = 3/2 4T2 24![[thin space (1/6-em)]](https://www.rsc.org/images/entities/char_2009.gif) 861 861 |
|
|
26![[thin space (1/6-em)]](https://www.rsc.org/images/entities/char_2009.gif) 177 177 |
26![[thin space (1/6-em)]](https://www.rsc.org/images/entities/char_2009.gif) 279 279 |
| SOC-QDPT sublevels S = 2 ground state/cm−1 |
SOC-QDPT sublevels S = 5/2 ground state/cm−1 |
|
|
| 0 |
KD1 0 |
| 0.15 |
KD2 2.78 |
| 11.17 |
KD3 5.84 |
| 14.02 |
|
| 17.30 |
|
D = −4.205 cm−1 |
D = 0.851 cm−1 |
|
E/D = 0.110 |
E/D = 0.295 |
|
g
eff = 2.059, 2.071, 2.162 |
g
eff = 2.002, 2.002, 2.002 |
|
g
KD1 = 0.735, 1.083, 9.585 |
|
g
KD2 = 4.070, 4.258, 4.498 |
|
g
KD3 = 0.491, 0.665, 9.770 |
5. Exchange coupling in the Fe2+(d6)–Fe3+(d5) pair: the spin ladder
Ligand field analysis in Section 4 shows five S = 2 states of Fe2+ in a range of 7000 cm−1 and a much larger energy gap between the S = 5/2 ground state and the lowest spin forbidden d-d excitations at the Fe3+ site. The small low-symmetry splitting of the 5E tetrahedral ground state of Fe2+ leads one to expect large anisotropy from competing exchange and spin–orbit coupling. The latter is neglected in scalar relativistic calculations, which, in this approximation, allows one to consider S as a good quantum number and focus on the ground state only. Because of the two possible localizations of the surplus electron, each spin state is, to a first approximation, doubly degenerate but actually slightly split due to the electron communication between the two centers. In Table 3 we list energies of lowest pairs for each spin (S = 1/2, 3/2, 5/2, 7/2 and 9/2) obtained from state and spin specific CAS(11,10)/NEVPT2 calculations. The results allow one to derive a mean energy for each pair (Table 3, second column) and a splitting due to the small (because of the localization procedure imposed), yet non-negligible resonance delocalization (Table 3, fourth column). Focusing on the first set of data, least square fitting of the parameters of the spin-Hamiltonian including Heisenberg (J) and biquadratic (J′) exchange (eqn (5.1) and (5.2)) allows for the determination of values for J = −69.04 cm−1 and J′ = 0.65 cm−1. Taking the second set, a spin-dependent delocalization parameter B (eqn (1)) can be extracted from the data using expressions listed in Table 3, column 5. A value of B = 13 cm−1 reproduces the five data points reasonably well. However, given the localization procedure applied here, this value cannot be considered as relevant for the case where the extra electron is delocalized over the two centers; this is the situation expected for complex 3.| | | Ĥexch = −2JŜ1Ŝ2 − 2J'(Ŝ1Ŝ2)2 | (5.1) |
| | | Eexch = −JS(S + 1) − J'[S(S + 1)]2 | (5.2) |
Table 3 Lowest non-relativistic S = 1/2, 3/2, 5/2, 7/2, 9/2 spin- and state- specific energies from CASSCF/NEVPT2 calculationsa
|
S= |
Energy (cm−1) |
E
−(E+) pair energy |
Resonance splitting |
2(S + 1/2)B expression |
Spin-dependent delocalization parameter B |
|
CAS(11,10), “mult 2S + 1”;“nroots 2”. Parameters J = −69.04 cm−1; J′ = 0.6549 cm−1 (root mean square deviation 2.77 cm−1) were deduced from a least square fitting of the Heisenberg Hamiltonian extended with a biquadratic term: Ĥexch= −2JŜ1Ŝ2 − 2J'(Ŝ1Ŝ2)2 and the following energy dependence on the total spin: Eexch = −JS(S + 1) − J'[S(S + 1)]2.
|
| 1/2 |
0 |
0 |
30 |
2B |
15 |
| 30 |
| 3/2 |
201 |
194 |
44 |
4B |
11 |
| 238 |
| 5/2 |
505 |
485 |
70 |
6B |
12 |
| 555 |
| 7/2 |
870 |
831 |
109 |
8B |
14 |
| 940 |
| 9/2 |
1257 |
1199 |
147 |
10B |
15 |
| 1346 |
In Table 4 we compare values of J and J′ determined using various combinations of options, including: active spaces CAS(11,10)/CAS(23,16), state average/state and spin specific, neglecting (CASSCF) or accounting (CASSCF + NEVPT2) for dynamical correlation as well as the case of a simple CASCI + NEVPT2(CAS(23,16)) calculation. Based on the reported value of J = −200 cm−110 (albeit with some precaution because of large and unspecified experimental error bars) we may conclude that, irrespective of the option employed, the electronic structure method leads to an underestimate of the computed value of J, except in the CAS(23,16) CASCI(NEVPT2 + CASCI) method, which matches closely to the reported value. The largest difference, (one order of magnitude smaller than the experimentally determined value of J) is obtained when using state averaged CASSCF and excluding dynamical correlation (Table 4, second column). Dynamical correlation (NEVPT2) improves only slightly the value of J. It becomes twice larger for the state- and spin-specific option within the CAS(11,10) model space (Table 4, columns 4 and 5) and is exclusively large when going to the extended CAS(23,16) active space (Table 4, columns 7 and 9). One can conclude that dynamical correlation is of extreme importance for magnetic exchange; in the case of 3′ it contributes to larger negative values of the exchange integral J. One can try understanding this result by the fact that the effect of dynamical correlation, which leads to negative corrections to the CASSCF reference energy, decreases with increasing S as reflected already by the CAS(11,10) results (Fig. 7 (left)). Its contribution to the energy separation between the ground S = 1/2 and the S = 3/2, 5/2, 7/2 and 9/2 spin states is illustrated in Fig. 7 (right). Using these data, a best fit of the parameters yields values of −43.4 cm−1 and 0.47 cm−1 for J and J′, respectively. Thus, as much as 62% of the total value of J (J = −69.1 cm−1, Table 4, column 5) comes from dynamical correlation.
Table 4 Energies of the spin ladder S = 1/2, 3/2, 5/2, 7/2 and 9/2 and parameters of the Heisenberg (J) and biquadratic exchange (J′) (in cm−1) from a best fit to state and spin average and state- and spin-specific CAS(11,10) and CAS(23,16) with CASSCF and CASSCF/NEVPT2a
|
S
|
CAS(11,10) |
CAS(23,16) |
| State average over the five scalar relativistic states for each spin |
State and spin specific |
State and spin-specific |
| CASSCF |
CASSCF/NEVPT2 |
CASSCF |
CASSCF/NEVPT2 |
CASSCF |
CASSCF/NEVPT2 |
CASCI |
CASCI/NEVPT2 |
|
Spin-energies reproduced using the best fit J and J′ values are listed in parenthesis.
|
| 1/2 |
0 |
0 |
0 |
0 |
0 |
0 |
0 |
0 |
| 3/2 |
65(65) |
106(107) |
75(74) |
201(198) |
107(107) |
348(372) |
−14(47) |
936(560) |
| 5/2 |
172(172) |
280(280) |
191(191) |
505(503) |
274(274) |
915(945) |
137(139) |
1336(1320) |
| 7/2 |
320(320) |
514(514) |
338(338) |
870(874) |
483(484) |
1689(1649) |
328(297) |
1816(2016) |
| 9/2 |
505(505) |
797(797) |
500(500) |
1257(1256) |
713(713) |
2372(2384) |
541(552) |
2352(2282) |
|
J
|
−21.81 |
−36.14 |
−25.65 |
−69.05 |
−36.84 |
−129.37 |
−14.05 |
−206.47 |
|
J′ |
0.030 |
0.114 |
0.189 |
0.655 |
0.279 |
1.178 |
−0.350 |
4.37 |
| Stand dev. |
0.089 |
0.470 |
0.388 |
2.777 |
0.296 |
33.24 |
39.52 |
258.88 |
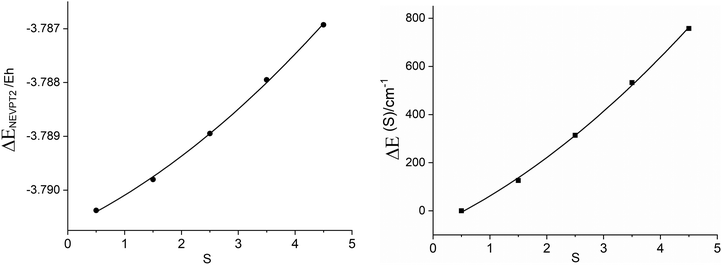 |
| | Fig. 7 Dynamical energy corrections ΔENEVPT2 to the total CASSCF reference scalar relativistic ground state energy from state and spin-specific CASSCF/NEVPT2 calculations in dependence total spin S of the exchange coupled Fe2+μTe2Fe3+ pair (left); dynamical correlation energy contributions to the energy separations between the S = 1/2 ground and the S = 3/2, 5/2,7/2 and 9/2 excited states (right). | |
We finally mention results from calculations which employ, as is usually done, canonical orbitals as a guess in the CASSCF/NEVPT2 procedure for 3′. The latter imply a full delocalization of the extra electron over the two Fe sites. These studies have shown stabilization of a S = 9/2 ground state and energy spacing to the S = 7/2, 5/2, 3/2 and 1/2 states of 30248, 27657, 25356 and 38537 cm−1 – thus violating the Landé interval rules (eqn (5.2)) and rendering parameters J and J′ ill defined. Dynamic correlation corrections to the CASSCF reference energy computed using such orbitals exceed by as much as 13![[thin space (1/6-em)]](https://www.rsc.org/images/entities/char_2009.gif) 167 to 24
167 to 24![[thin space (1/6-em)]](https://www.rsc.org/images/entities/char_2009.gif) 140 cm−1 those obtained when imposing a Fe2+μTe2Fe3+ electron localization.
140 cm−1 those obtained when imposing a Fe2+μTe2Fe3+ electron localization.
6. Magnetic sublevels from spin–orbit coupling calculations: comparison with experiment
Isotropic ground state spin-levels, S = 1/2, 3/2, 5/2,7/2, 9/2 get largely modified under the combined effects of low symmetry (see Section 4) and spin–orbit coupling. States with S > 1/2 undergo splitting in the absence of a magnetic field into two (S = 3/2), three (S = 5/2), four (S = 7/2) and five (S = 9/2) Kramers doublets with quite different anisotropies. This is quantified by their g-factors (g-matrices) and the orientations of their canonical magnetic axes (the axes system in which the ZFS tensor D and/or g·g′ become diagonal). Zero-field splittings (D and E/D parameters) and g-factors for the sublevels of the S states of lowest energy are listed in Table 5. In these calculations, SOC within the manifold of scalar relativistic states was considered. Mixing between S and S ± 1 states is presently neglected (vide infra). In all four S = 3/2–9/2 states, D is computed to be negative and therefore dominated by the relatively large local ZFS at the Fe2+ site (D = −4.2 cm−1), a result stemming from the near orbital degeneracy of the 5E ground state of the Fe2+ site. It is remarkable that the g-factors of the lowest Kramers doublet resulting from the S = 3/2 calculation (Table 5, third row) exactly reproduce the reported experimental ones (Table 5, bottom row); also the computed value of E/D = 0.313 nearly perfectly agrees with the reported value (E/D close to 1/3). Do the same results also reproduce the χT vs. T data? Fig. 8 (left) shows that this is definitely not the case; except for the two lowest temperature data points, computed values for χT are much lower that experimental ones. To this end, we extended the spin–orbit coupling calculation for the S = 3/2 manifold with the S = 5/2 states (“CAS(11,10), mult 6,4, nroots 40,40”). As a side remark, that in contrast to single center transition metal complexes, the S to S ± 1 mixing rule for SOC appears not to hold for exchange coupled spins. Energies of the lowest scalar relativistic S = 3/2 and S = 5/2 states and SOC split sublevels in the range from 0 to 200 cm−1 are listed in Table 6. While this extension does not affect g-factors for the lowest S = 3/2 state, thermally accessible magnetic sublevels originating from the lowest S = 5/2 state in the range 159–194 cm−1 appear. They readily explain the increase in the χT curve at temperatures higher that 100 K. Simulations of the χT vs. T behavior lend support of this proposition (Fig. 8, right). Yet, as indicated in Fig. 8 (right), there is a deviation between experimental and simulated data points in the temperature range 25 < T < 100 K. Below we will try analyze this in terms of a vibronic coupling model.
Table 5
g-Factors and energies of Kramers doublets originating from the S = 1/2, 3/2, 5/2, 7/2 and 9/2 spin-free states of lowest energy from spin-specific SOC-QDPT NEVPT2 calculations on the mixed valence [Fe2+μTe2Fe3+]− dimera
| Lowest spin state S |
Energy/cm−1 |
g
1
|
g
2
|
g
3
|
D/cm−1 |
E/D |
E
tot![[thin space (1/6-em)]](https://www.rsc.org/images/entities/char_2009.gif) eH (cm−1) −16731. eH (cm−1) −16731. |
|
CASCI/NEVPT2 calculations based on state average CASSCF (CAS(11,10), “mult 10,8,6,4,2”; “nroots = 5,5,5,5,5”) results and the X-ray geometry of a [Fe2+μTe2Fe3+]− truncated model complex; included are zero-field split energies and values of D and E/D ratios, orientations of the canonical –magnetic axes with respect to the adopted molecular Cartesian frame (Fig. 5).
|
| 1/2 |
0 |
0.652 |
0.713 |
0.876 |
— |
— |
−.742988(56380) |
| 3/2 |
0 |
1.412(x,y) |
1.915(y,x) |
5.748(z) |
−1.836 |
0.313 |
−.742560(56437) |
| 4.2 |
1.568(z) |
2.131(y,x) |
5.411(x,y) |
| 5/2 |
0 |
0.019(x,y) |
0.020(y,x) |
10.794(z) |
−2.453 |
0.044 |
−.741847(56630) |
| 9.4 |
0.948(y,x) |
0.963(x,y) |
6.467(z) |
| 14.9 |
2.131(z) |
4.974(y,x) |
6.934(x,y) |
| 7/2 |
0 |
0.022(y,z) |
0.026(x) |
14.777(z,x) |
−1.827 |
0.0185 |
−.740886(56841) |
| 7.9 |
1.114(y,z) |
1.411(x) |
10.208(z,y) |
| 12.6 |
4.364(z) |
5.760(x) |
6.513(y) |
| 17.6 |
0.583(z,y) |
0.985(x) |
13.349(y,z) |
| 9/2 |
0 |
0(x,y) |
0(y,x) |
18.718(z) |
−1.348 |
0.176 |
−.999893(0) |
| 14.33 |
0.000(x,y) |
0.000(y,x) |
14.560(z) |
| 25.15 |
0.057(x,y) |
0.058(y,x) |
10.394(z) |
| 32.37 |
2.151(x,y) |
2.170(y,x) |
4.141(z) |
| 36.10 |
1.989(z) |
7.824(y,x) |
12.133(x,y) |
| X-EPR simul. |
|
1.515 |
1.950 |
5.740 |
Max. 15 |
1/3 |
|
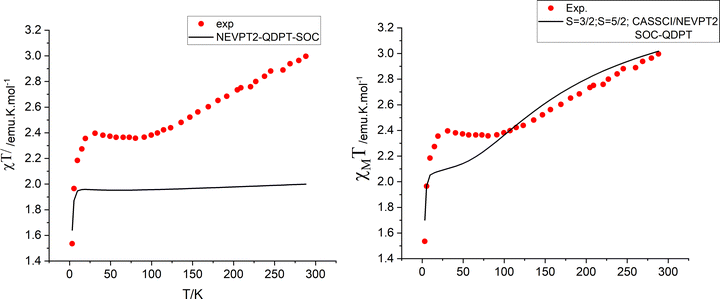 |
| | Fig. 8 Experimental (red points) and simulated χT vs. T dependencies from spin–orbit coupling calculations using the manifold of 40 lowest S = 3/2 scalar relativistic roots (left) and including in addition the manifold of 40 lowest S = 5/2 roots (right). The latter results explain the increase of χT at T > 100 K with Boltzmann populations of excited S = 5/2 levels (see Table 6). | |
Table 6 Scalar relativistic and SOC energies of the lowest energy levels of 3′ from CAS(11,10) calculations including lowest 40 S = 3/2 and 40 S = 5/2 roots
|
|
Scalar-relativistic |
SOC-QDPT |
g
1
|
g
2
|
g
3
|
| 3/2 |
0 |
0 |
1.685(x) |
2.004(z) |
5.496(y) |
| 5.59 |
1.506(y) |
2.218(z) |
5.500(x) |
| 3/2 |
48 |
28.74 |
1.623(z) |
3.476(x) |
4.378(y) |
| 48.87 |
0.479(x,y) |
0.535(y,x) |
5.633(z) |
| 5/2 |
160 |
158.98 |
0.043(x,y) |
0.048(x,y) |
10.691(z) |
|
|
181.85 |
2.442(x) |
2.864(y,z) |
5.924(z,y) |
| 194.03 |
1.652(z) |
2.846(y) |
8.100(x) |
7. The adiabatic potential of 3′ in the lowest S = 3/2 state: effect of spin–orbit coupling on the topology of the ground state adiabatic potential surface
Thus far, the geometry of the N2FeTe2FeN2 core in the model complex 3′ was identified with the static X-ray structure of 3 showing two equivalent iron sites; bond angles and bond distances show a centrosymmetric iron dimer (Fig. 9, left). In a mixed valence class III complex, such a geometry may, or may not be at ground state energy minimum – a double well adiabatic ground state potential energy surface may arise; DFT geometry optimizations can potentially show how a geometry of higher symmetry relaxes to a minimum of energy at lower symmetry, while frequency calculations at the centrosymmetric structure can show the shape of the active normal modes (imaginary frequencies) along which the complex will eventually distort. Such calculations are at best scalar relativistic and the role of spin–orbit coupling, expected to counteract vibronic forces (tending to support high-symmetry configurations) cannot be routinely accounted for. Moreover, numerical instabilities may show artificial minima, that depend on the DFT functional, the basis set and the auxiliary basis functions used in the calculations. In order to supply a more realistic model for the adiabatic potential energy surface (APES) which takes SOC into account, a scan of the ground state energy along the symmetry breaking mode q was carried out (Fig. 9 right). Starting with the geometry at q = 0 (corresponding to the one shown in Fig. 9, left) and using a grid of points at positive and negative values of q, the dependence of the total energy on q under the effect of SOC for the S = 3/2 ground Kramers doublet could be traced.34 Data points (Fig. 9, right) could be fitted consistently using quadratic polynomial (eqn (7.1)) thus accounting for superfluous anharmonicity.
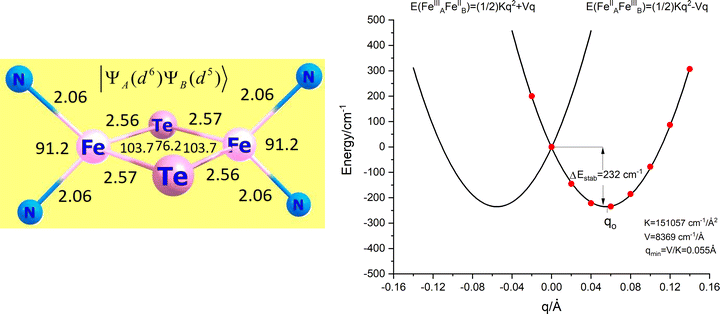 |
| | Fig. 9 The centrosymmetric geometry of 3′ (left) used as reference (q = 0) to scan the potential surface along the symmetry breaking local mode q (right). | |
The coefficients of this polynomial can be directly related with the relativistic SOC energy reference Eo = c, the SOC linear vibronic coupling (V = b) and the SOC harmonic force constant K (K = 2c).
| | | aq2 + bq + c = (1/2) Kq2 + Vq + Eo | (7.1) |
The resulting energy expression (
eqn (7.2)) allows one to relate
| | | E = (1/2) Kq2 + Vq + Eo | (7.2) |
the geometrical distortion
qo, the energy stabilization Δ
Estab and the vibronic energy parameter
λ with
V and
K from one side, and to compare these energies with the results obtained from scalar relativistic calculations from the other side (
Table 7). The comparison shows, that accounting for SOC leads to twice smaller distortions (
q = 0.055
vs. 0.114 Å) and three times smaller stabilization energies (235
vs. 718 cm
−1, see also Fig. S1 in the ESI
† facilitating the comparison). It follows from
Table 7 listing the set of parameters extracted from the analysis of the two cases – with and without SOC, that one can trace back these changes to lowering
V (increase of
K) when SOC is considered. Values of the harmonic force constant
K allow one to estimate the harmonic frequency corresponding to the effective mode
q −
ħω = 121 cm
−1 (scalar relativistic)
vs. 142 cm
−1 (SOC). This will be used in section 8. Computed scalar relativistic values of Δ
Estab (718 cm
−1) are close to ones extracted from the analysis of experimental
χT vs. T data using a Bleaney–Bowers model (Δ
Estab = 839 cm
−1)
10 but are much larger than the one given by the SOC calculation (235 cm
−1).
Table 7 Vibronic coupling parameters for the lowest S = 3/2 Kramers doublet from QDPT spin–orbit coupling NEVPT2 calculations and from scalar relativistic NEVPT2 calculations of the S = 3/2 ground state of 3′
|
|
Scalar relativistic CASCI/NEVPT2 |
QDPT-SOC CASCI/NEVPT2 |
Reported In ref. 1 |
|
q
o (Å) |
0.114 |
0.055 |
0.20 |
|
V (cm−1 Å−1) |
12![[thin space (1/6-em)]](https://www.rsc.org/images/entities/char_2009.gif) 605 605 |
8369 |
8375 |
|
K (cm−1 Å−2) |
110![[thin space (1/6-em)]](https://www.rsc.org/images/entities/char_2009.gif) 500 500 |
151![[thin space (1/6-em)]](https://www.rsc.org/images/entities/char_2009.gif) 057 057 |
41![[thin space (1/6-em)]](https://www.rsc.org/images/entities/char_2009.gif) 873 873 |
|
ħω (cm−1) |
121 |
142 |
140 |
| ΔEstab |
718 |
235 |
838 |

|
1438 |
464 |
1675 |
8. Spin-phonon coupling in Fe2.5+μTe2Fe2.5+
The APES of a Class III mixed valence binuclear complex is spin-dependent (Section 1, eqn (1.1) and (1.2)). Focusing on the S = 3/2 ground state of the Fe2.5+μTe2Fe2.5+ pair, and taking localized valence bond structures Fe2+(μTe2)Fe3+ (left) and Fe3+(μTe2)Fe2+(right), the APES takes the analytical form:| |  | (8.1) |
with V and K – the linear vibronic coupling and the harmonic force constants, respectively (see Section 7 for the derivation of their values), and B – the electron transfer parameter (see eqn (1.1) and (1.2) and following text). Before computing and analyzing the effect of vibronic coupling (K and V) and electron transfer (B) on the vibronic levels it is quite instructive to take the resonance form Fe2+(μTe2)Fe3+ (left) first and neglect electron transfer. This is the generic case of a hypothetical completely localized mixed valence (Class I) complex. It may apply for 1 and 2 but not for 3. Localization may be induced by the presence of two different coordination environments around the two centers (see examples for such Fe2+–Fe3+ dimers see ref. 17) and/or by static geometrical distortions caused by crystal packing effects, of from both. The Hamiltonian (eqn (8.2)) is set up in the basis of simple BO products |SMS〉|n〉, with |SMS〉 the functions MS = 3/2,1/2, −1/2, −3/2 to the S = 3/2 spin and |n〉 -the wave functions of the quantum Harmonic oscillator up to a number Nvib(n = 0, 1, …, Nvib).| | | Ĥtotal(Class I) = Ĥvibr + ĤZFS + ĤZeeman | (8.2) |
In eqn (8.2)Ĥvibr (eqn (8.3)), ĤZFS (eqn (8.4)) and ĤZeeman (eqn (8.5)) are the vibrational, zero-field splitting and the Zeeman terms, respectively:
| | | Ĥvibr = Envibr = ħω (n + 1/2) | (8.3) |
| |  | (8.4) |
| |  | (8.5) |
A Herzberg-Teller expansion of ĤZFS (eqn (8.6)) and ĤZeeman (eqn (8.7)) up to quadratic terms with respect to the symmetry breaking local distortion mode q has been used to compute the ZFS and Zeeman matrices, and the matrix Ĥtotal(Class I) using the master formula for its matrix elements (eqn (8.8)).
| | | ĤZFS = ĤoZFS + (∂ĤoZFS/∂q)oq + (1/2)(∂2ĤoZFS/∂q2)oq2 | (8.6) |
| | | ĤZeeman = ĤoZeeman + (∂ĤoZeeman/∂q)oq + (1/2)(∂2ĤoZeeman/∂q2)oq2 | (8.7) |
| | 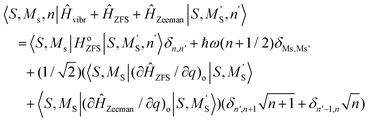 | (8.8) |
Eqn (8.6) and (8.7) account for the dependence of the six components of the D tensor and nine independent matrix elements of the g-matrix, respectively on q as illustrated in Fig. 10 (top for D, middle and bottom for g). A Herzberg-Teller expansion of each matrix element up to quadratic terms in q shows a strong non-linearity both in the diagonal and in the off-diagonal matrix elements. In what follows only linear terms of this expansion will be considered; quadratic terms have been used in order to more precisely approximate linear terms. The solution of the vibronic problem (eqn (8.8)) can be greatly simplified by noticing, that terms in eqn (8.6) and (8.7) linear in q are of the order of 0.1 cm−1, and therefore much smaller then ħω (141 cm−1) and the vibronic stabilization ΔEstab (235 cm−1, see Table 7). Therefore, one can eliminate linear vibronic coupling term in the APES (the Vq in eqn (8.1)) by shifting the origin of q from 0 to its value at the minimum of energy qmin = V/K = 0.05 Å) after properly transforming the q dependent terms in eqn (8.6) and (8.7). Energies of the lowest four vibronic levels and g-factors are listed in top half of Table 8. While no changes are computed concerning energies and g-factors of the two Kramers doublets resulting from the scalar relativistic S = 3/2 ground state, the next two excited states, originally a purely vibrational excitation at 141.2 cm−1, now become split into two sublevels (141.3 and 145.4 cm−1) the difference exactly matching the ground state zero-field splitting (4.1 cm−1). Vibronic mixing between the ground and excited Kramers doublets KD1-KD2, 0.069 and 0.204 cm−1, are of importance for the magnetic relaxation. This is outside the scope of the work herein.
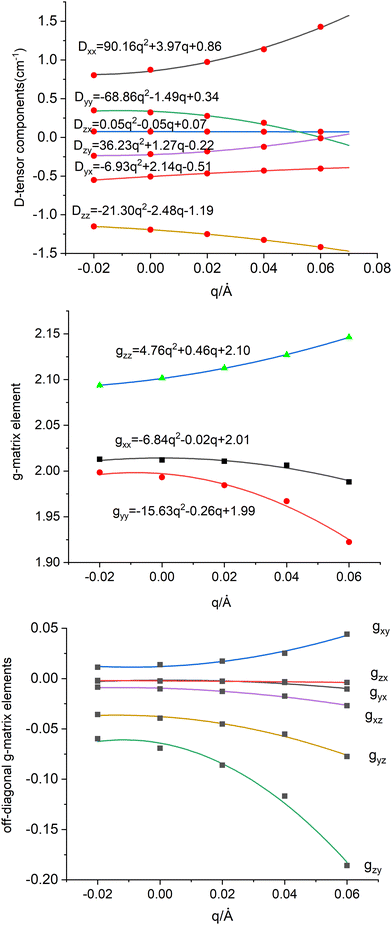 |
| | Fig. 10 Dependence of the spin-Hamiltonian parameters of the S = 3/2 ground state of 3′ – the D tensor, top (in cm−1) and g-matrix: diagonal-(middle) and off-diagonal (bottom) matrix elements on the symmetry breaking local mode q (in Å); linear and quadratic derivatives are given in cm−1/Å and cm−1/Å2 respectively (for D) and 1/Å and 1/Å2 (for g) When used in the context of eqn (8.6)–(8.8) these have to be converted into dimensionless q dividing by the conversion factor  ; Meff = 2MTe = 255.2, ħω = 141.2 cm−1 – the vibrational frequency; q → fq; (dD/dq)o → (dD/dq)o/f; (d2D/dq2)o → (d2D/dq2)o/f2; (dg/dq)o → (dg/dq)o/f; (d2g/dq2)o → (d2g/dq2)o/f2. ; Meff = 2MTe = 255.2, ħω = 141.2 cm−1 – the vibrational frequency; q → fq; (dD/dq)o → (dD/dq)o/f; (d2D/dq2)o → (d2D/dq2)o/f2; (dg/dq)o → (dg/dq)o/f; (d2g/dq2)o → (d2g/dq2)o/f2. | |
Table 8 Lowest thermally accessible SOC vibronic energy levels and Kramers doublet g-factors from CAS(11,10) CASSCF/NEVPT2 calculationsa
| Class I |
ħω = 141.2 cm−1, Nvib = 32 |
|
E/cm−1 |
g
1
|
g
2
|
g
3
|
|
KD = Kramers doublet.
|
| KD1 0 |
1.401 |
1.882 |
5.767 |
| KD2 4.2 |
1.588 |
2.159 |
5.421 |
| KD3 141.3 |
1.401 |
1.882 |
5.767 |
| KD4 145.4 |
1.588 |
2.159 |
5.421 |
| Class III |
V = −8369 cm−1; ħω = 141.2 cm−1, Nvib = 32, B = 163 cm−1 |
| KD1 0 |
1.402 |
1.883 |
5.776 |
| KD2 4.2 |
1.587 |
2.159 |
5.422 |
| KD3 44.2 |
1.401 |
1.882 |
5.761 |
| KD4 48.4 |
1.588 |
2.158 |
5.420 |
We now invoke electron transfer into our consideration. The Hamiltonian of eqn (8.1) can be transformed from a localized (|Ψleft〉 = |ΨA(d6) ΨB(d5)〉, |Ψright〉 = |ΨA(d5) ΨB(d6)〉) into a canonical (|Ψ±〉) form following eqn (8.9). In this presentation electron transfer (2B) and vibronic coupling (Vq) change their roles; the first appears now at the diagonal while the latter enters into the off-diagonal part of the APES (eqn (8.10)). A configuration energy diagram is presented schematically in Fig. 11.
| |  | (8.9) |
| |  | (8.10) |
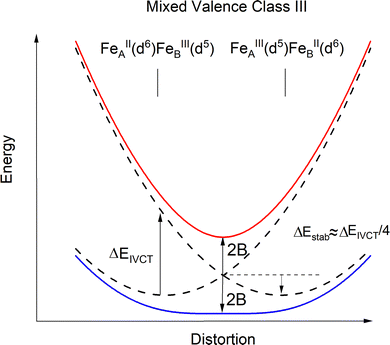 |
| | Fig. 11 Configuration energy diagram (schematic) for 3′ in the limit of a complete delocalization of the extra electron over the two iron sites (Fe2.5+μTe2Fe2.5+, Class III). | |
The total Hamiltonian (8.11) has been extended by one additional term, Ĥ±vibronic and the basis set is now |SMS〉|n〉|l〉 of total dimension 4Nvib2 extended with an additional quantum number l = +1, −1, labelling basis functions corresponding to the |Ψ+〉 and |Ψ−〉 branches, respectively.
| | | Ĥtotal = Ĥvibr + ĤZFS + ĤZeeman + Ĥ±vibronic | (8.11) |
The matrix of Ĥtotal in this basis consists of two diagonal matrices of dimension 4Nvib identical to Ĥtotal(Class I) (eqn (8.2)), their diagonal elements are now shifted up (for branch|Ψ+〉) and down (for branch |Ψ−〉) in energy by 2B, respectively, and a sub-diagonal matrix appears whose matrix elements are computed according to the master equation eqn (8.12).
| |  | (8.12) |
The structure of the vibronic Hamiltonian of a mixed valence Class III complex is presented in Fig. 12.
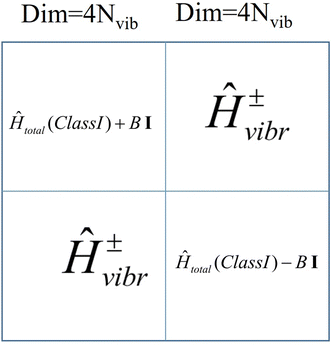 |
| | Fig. 12 Structure of the vibronic Hamiltonian of a mixed valence Class III binuclear transition metal dimer complex; I -the 4Nvib × 4Nvib unit matrix. | |
The parameter B is not uniquely defined and will be subjected to an analysis in Section 9. Yet, we decided here to render B freely variable and obtained a value of B = 163 cm−1 from a simulation of the χT vs. T data (Fig. 13); a value about five times smaller than previously reported (B = 750 cm−1![[thin space (1/6-em)]](https://www.rsc.org/images/entities/char_2009.gif) 10) results. Using this value, we computed energies of the lowest four Kramers doublets along with their anisotropic g-values (see bottom half of Table 8). The comparison between the results from the Class III and Class I modelling of 3′ shows the combined effect of electron transfer and vibronic coupling on the vibronic levels: the energies of the third and the fourth excited Kramers states change from 141.3 and 145.4 cm−1, energies stemming from a zero-field split vibrational excitation (Class I) (the value of the nominal first vibrational excitation) to as much as three times smaller energies, 44.2 and 48.4 cm−1. Energies of the lowest three excited levels of 3 are not known. However, spin-relaxation times determined from the temperature dependence of the Lorentzian broadening of spin-relaxation times have been reported (Fig. 14). From these data the authors obtained an Orbach energy gap of U = 60 cm−1 ≈ 4D. Inspection of the Arrhenius ln(1/τ) vs. 1/kT plots in Fig. 14 allows one to recognize two different slopes, a larger one for the data at higher temperatures (T = 20, 13.3 K), and a smaller slope reflected by the data at lower temperatures (T = 10, 8, 6.7 K). With some precaution (in view of the inherent approximations), we were able to simulate the data using two exponents to afford two Orbach energies U1 = 5.6 cm−1 and U2 = 30.5 cm−1. These are in a reasonable agreement with the computed values −4.2 cm−1 and 45 cm−1, respectively. A more rigorous direct access to the energies of the lowest excitations would be possible using dedicated experiments, such as inelastic neutron scattering. We hope that the theoretical results of this work will stimulate such further studies on 3.
10) results. Using this value, we computed energies of the lowest four Kramers doublets along with their anisotropic g-values (see bottom half of Table 8). The comparison between the results from the Class III and Class I modelling of 3′ shows the combined effect of electron transfer and vibronic coupling on the vibronic levels: the energies of the third and the fourth excited Kramers states change from 141.3 and 145.4 cm−1, energies stemming from a zero-field split vibrational excitation (Class I) (the value of the nominal first vibrational excitation) to as much as three times smaller energies, 44.2 and 48.4 cm−1. Energies of the lowest three excited levels of 3 are not known. However, spin-relaxation times determined from the temperature dependence of the Lorentzian broadening of spin-relaxation times have been reported (Fig. 14). From these data the authors obtained an Orbach energy gap of U = 60 cm−1 ≈ 4D. Inspection of the Arrhenius ln(1/τ) vs. 1/kT plots in Fig. 14 allows one to recognize two different slopes, a larger one for the data at higher temperatures (T = 20, 13.3 K), and a smaller slope reflected by the data at lower temperatures (T = 10, 8, 6.7 K). With some precaution (in view of the inherent approximations), we were able to simulate the data using two exponents to afford two Orbach energies U1 = 5.6 cm−1 and U2 = 30.5 cm−1. These are in a reasonable agreement with the computed values −4.2 cm−1 and 45 cm−1, respectively. A more rigorous direct access to the energies of the lowest excitations would be possible using dedicated experiments, such as inelastic neutron scattering. We hope that the theoretical results of this work will stimulate such further studies on 3.
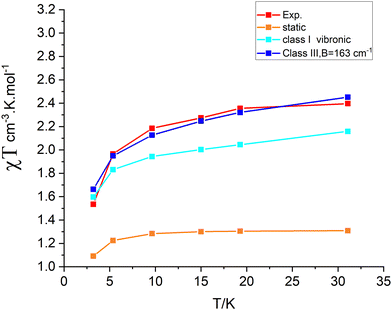 |
| | Fig. 13 Comparison between experimental (“Exp”) and theoretical χT vs. T dependencies using the static geometry of 3′ and vibronic wave functions computed using Class I and Class III models. | |
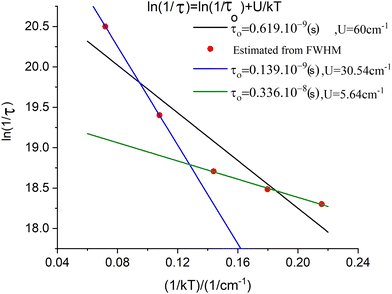 |
| | Fig. 14 Spin-relaxation rates from Lorentzian broadening of the low-field sharp line transition in the X-Band EPR spectrum of 3 (red points);10 simulation of the data using a single exponential Orbach relaxation mechanism (black line), and simulation of the data using a bi-exponential Orbach mechanism, blue line (T = 20, 13.3 K data points), green line (T = 10, 8, 6.7 K data points). | |
9. Critical view of the double-exchange model and its application for the interpretation of magnetic and spectroscopic data of binuclear mixed valence complexes
In this study we employed the double exchange vibronic coupling (DEVC) model (eqn (1.2), (8.2) and (8.10) to the interpretation of the spectroscopic and magnetic properties of the Class III Fe2.5+μTe2Fe2.5+ mixed valence dimer 3. This model has its scope of validity and limitations, which we now discuss in some detail. The goal of the DEVC model is to describe only part of the energy spectrum of the total Hamiltonian, that part connected with the spin-exchange within the Fe2+(S = 2)–Fe3+(S = 5/2) pair and the transfer of one electron from the Fe2+ to the Fe3+ center. Vibronic coupling to one symmetry breaking effective normal mode q was considered. The effects of these complex processes were captured by four parameters only: spin exchange (J), electron transfer (B) and vibronic coupling (V,K). The DEVC model presupposes one state of each spin-multiplicity from S = 1/2 to S = 9/2. This tacitly assumes, that other states of the same spin are far apart in energy and cannot mix (i.e. the “giant spin approximation”) and it neglects spin–orbit coupling. However, SOC and low-symmetry yield leading contributions to the magnetic anisotropy.35 Therefore the DEVC model intrinsically fails to relate observables – EPR spectra and the magnetic susceptibility – with multiplet fine structures. First principles based multireference (MR) ab initio calculations do not suffer from this drawback but are rather complex and difficult to analyze. Some compromise between DEVC and MR approaches is possible: (1) CASSCF/NEVPT2-SOC calculations using an orbital localization procedure allow for determination of the parameters of the spin-Hamiltonian – the zero field splitting tensor D and g-factors extracted from first principles multireference calculations. (2) Linear vibronic coupling and linear spin–phonon coupling parameters – the derivatives of ZFS D-tensor and the g-matrix with respect to q – were then obtained numerically. (3) The most critical point in the chain of approximations is the determination of B which in the DEVC model defines the electron transfer operator ![[T with combining circumflex]](https://www.rsc.org/images/entities/i_char_0054_0302.gif) 12. The action of
12. The action of ![[T with combining circumflex]](https://www.rsc.org/images/entities/i_char_0054_0302.gif) 12 is defined by eqn (9.1); it considers the transfer of one electron between the two resonance forms, in our case:
12 is defined by eqn (9.1); it considers the transfer of one electron between the two resonance forms, in our case:| | ![[T with combining circumflex]](https://www.rsc.org/images/entities/i_char_0054_0302.gif) 12|Ψleft〉 = |ΨA(d6)ΨB(d5) 〉 = |Ψright〉 = |ΨA(d5)ΨB(d6)〉 12|Ψleft〉 = |ΨA(d6)ΨB(d5) 〉 = |Ψright〉 = |ΨA(d5)ΨB(d6)〉 | (9.1) |
The first principles equivalent of ![[T with combining circumflex]](https://www.rsc.org/images/entities/i_char_0054_0302.gif) 12 acts on the complex SOC components of two S = 3/2 ground state Kramers doublets (eqn (9.2)), consisting of one- and two-electron electron transfer operators:
12 acts on the complex SOC components of two S = 3/2 ground state Kramers doublets (eqn (9.2)), consisting of one- and two-electron electron transfer operators:
| |  | (9.2) |
In eqn (9.2) the operator ![[T with combining circumflex]](https://www.rsc.org/images/entities/i_char_0054_0302.gif) 12 is written down in second quantization with a+jβ∈B, a+jβ∈A and aiβ∈A, aiβ∈B pairs of creation and annihilation operators describing the transfer of the surplus β spin from the Fe2+(d6) center (left) to the half-filled shell of Fe3+(d5) (right, or vice versa). Analysis of the local Fock operator in the basis of converged CASSCF wave function, evaluated using CAS(11,10) converged natural orbitals allows for extraction of the one-electron transfer integrals illustrated in Fig. 15 (see ESI,† for computational details). It follows from this numerical example, that out of the five possible one-electron transfer pathways, three, from the lowest occupied orbital of Fe2+ to the second, third and fourth orbital of Fe3+, are comparable in magnitude und should be simultaneously accounted for. In other words, three different parameters (B12, B13 and B14), rather than just only one B parameter, should be considered. Since four excited states of the d6 configuration may couple the ground state one (Fig. 15) via SOC, a total of as much as 25 charge transfer integrals (Table 9) would have to be considered. The quantities in Fig. 15 have been obtained using CASSCF wave functions. One expects that dynamical correlation will modify the parameters Bij to render the problem at the present stage not tractable. Efforts in this direction are the subject of ongoing projects in our group.
12 is written down in second quantization with a+jβ∈B, a+jβ∈A and aiβ∈A, aiβ∈B pairs of creation and annihilation operators describing the transfer of the surplus β spin from the Fe2+(d6) center (left) to the half-filled shell of Fe3+(d5) (right, or vice versa). Analysis of the local Fock operator in the basis of converged CASSCF wave function, evaluated using CAS(11,10) converged natural orbitals allows for extraction of the one-electron transfer integrals illustrated in Fig. 15 (see ESI,† for computational details). It follows from this numerical example, that out of the five possible one-electron transfer pathways, three, from the lowest occupied orbital of Fe2+ to the second, third and fourth orbital of Fe3+, are comparable in magnitude und should be simultaneously accounted for. In other words, three different parameters (B12, B13 and B14), rather than just only one B parameter, should be considered. Since four excited states of the d6 configuration may couple the ground state one (Fig. 15) via SOC, a total of as much as 25 charge transfer integrals (Table 9) would have to be considered. The quantities in Fig. 15 have been obtained using CASSCF wave functions. One expects that dynamical correlation will modify the parameters Bij to render the problem at the present stage not tractable. Efforts in this direction are the subject of ongoing projects in our group.
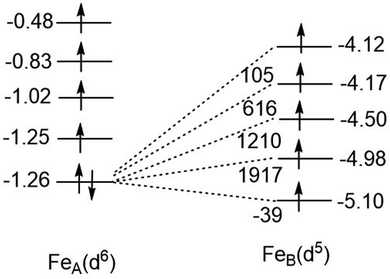 |
| | Fig. 15 One-electron transfer (hopping) integrals for spin-down electron in the S = 2 ground state of Fe2+ from 5 × 5 block diagonalization of the 10 × 10 Fock-matrix of the tellurium bridged iron-pair extracted from converged CASSCF calculations with a model space distributing 11 electrons over the ten active localized MOs [CAS(11,10)]. | |
Table 9 One electron (hopping) integrals quantifying the transfer of the excess spin-down (β-spin) electron from the Fe2+(d6) site to the half-filled shell of the Fe3+(d5) site from the block-diagonalization the 10x10 Fock matrix build up from the localized natural orbitals of the converged CASSCF calculation of 3′
| Diagonal matrix elements (eV) FeIII(d5) FeII(d6)a↓ |
−5.100 |
−4.977 |
−4.499 |
−4.167 |
−4.116 |
|
Energies of the off-diagonal matrix elements are given in cm−1.
|
| −1.257 |
−39 |
1917 |
1210 |
616 |
105 |
| −1.251 |
214 |
1419 |
−1705 |
−866 |
−88 |
| −1.023 |
773 |
−77 |
−5512 |
186 |
−42 |
| −0.829 |
−688 |
44 |
185 |
4724 |
632 |
| −0.475 |
−15 |
36 |
−23 |
103 |
−1548 |
10. Conclusions
(1) Binuclear mixed valence transition metal complexes represent a challenge to multireference ab initio methods. In this work, we studied theoretically a mixed valence Fe2.5+μTe2Fe2.5+ complex with the aim of explaining its unusual S = 3/2 ground state and interpreting its recently reported X-band EPR spectra and magnetic properties. We have found that using localized orbitals in setting up the many particle basis (the CFSs) of the Fe2+(d6)–Fe3+(d5) pair in 3′, one is able to correctly reproduce the antiferromagnetic (negative) sign of Heisenberg exchange integral J, while extension of the active space from CAS(11,10) to CAS(23,16), including six more doubly occupied 5px, 5py and 5pz MOs on the bridging tellurium ligands, further increase its negative value. Without localization, using a guess of canonical MOs, a S = 9/2 ground state along with large violations from the Landé interval rule for the exchange coupled spin systems was predicted.
(2) Scalar relativistic localized molecular orbital optimizations of each spin-ladder state – S = 1/2, 3/2, 5/2, 7/2 and 9/2 separately, was found to be mandatory in order to achieve reliable and quantitative correct results; depending on the spin, each of these sets of orbitals relax differently. NEVPT2 corrections to the CASSCF reference energies decrease with increasing spin, thus contributing to larger negative values of J.
(3) Spin–orbit coupling calculations using the entire Hilbert space of a given spin multiplicity allowed to compute g-factor anisotropies, which for S = 3/2 exactly match g-factors extracted from simulations of the X-band EPR spectrum. This might be used for diagnostic purposes by comparing experimental and computed spin-Hamiltonian parameters. However, magnetic susceptibilities could not be reproduced in this way. To this end, we felt it necessary to account for vibronic coupling.
(4) Vibronic coupling has been considered in the approximation of a valence localized Fe2+μTe2Fe3+ complex (Class I) excluding electron transfer. Using a scan of the ground state energy along the effective symmetry breaking normal mode q, both scalar relativistic and spin–orbit split S = 3/2 ground states were studied. We have found that spin–orbit coupling greatly reduces geometrical distortions and vibronic stabilizations over the scalar relativistic results. Numerical values for the linear vibronic coupling constant (V) and the Harmonic force constant (K) allow for quantification of the effect. From the SOC calculations the first derivatives of ZFS tensor D and the g-matrix of the spin 3/2 ground state spin Hamiltonian have been also determined. Extending the model with electron transfer we could simulate the temperature dependence of the magnetic susceptibility using a single electron transfer parameter B, whose value can hardly be estimated otherwise when using ab initio methods. Taking this parameter as freely variable, we can adjust its value from a best fit to the magnetic susceptibility data (B = 163 cm−1). It is 4.5 time smaller than the one previously reported.10 Employing this value in the calculation of vibronic levels, energies of the lowest two excited states, 4.2 and 43 cm−1 were computed in reasonable agreement with numbers extracted from the temperature dependence of the spin-relaxation times (5 and 32 cm−1, respectively).
(5) The expediency and limitations of the DEVC model have been discussed in the light of concurrent electron transfer pathways with parameters extracted from correlated wave functions using local Fock matrices. It is pointed out, that values of B obtained from interpretation of experimental data should be regarded with caution, leading in some cases to some unexpected observations. Thus, the value of (B/J) derived from the S = 3/2 SOC ground state herein (B/J = 163/63) = 2.58) is outside the range of 3 < B/J < 5 predicted by the simple model (eqn (1.1)).
(6) The computational protocol developed in this work, particularly the vibronic analysis part of the zero-field splitting D-tensor and g-matrix are equally applicable to any binuclear transition metal dimer and is potentially applicable to all types of spin-relaxation mechanisms.
(7) Higher-nuclearity clusters can be potentially treated using the same computational recipe by setting up a composed model spin-Hamiltonian. A prerequisite for such applications are well defined metal based oxidation states and d-electron counts at each paramagnetic center (classes I and II mixed valence complexes). Taking as an example a triangular Mn1Mn2Mn3 cluster with Mn1, Mn2 and Mn3 in oxidation state III (high-spin d4, stabilized in a Jahn-Teller distorted geometry), diamagnetic substitution of two of the manganese atoms by GaIII at the manganese sites, say Mn2 and Mn3, CASSCF/NEVPT2 calculations will give access to the zero-field splitting tensor D1 (similar substitutions of Mn1 and Mn3 to D2, and Mn1, Mn2 to D3, respectively). Diamagnetic substitution of only one MnIII center, and applying the computational CASSCF/NEVPT2 protocol described here will in turn give access to the Heisenberg exchange parameters J12 (by substituting Mn3 with Ga) and similar J13 (by substituting Mn2 with Ga) and J23 (substituting Mn1 by Ga). This allows one to set up the spin Hamiltonian of the triangular complex in the spin-uncoupled basis of the three S = 2, MnIII spin centers (eqn (10.1)) which can be solved by any program dealing with high nuclearity spin clusters, such as MagnPack36 and PHI.37
| | | Hsp-ham = − 2J12Ŝ1·Ŝ2 − 2J13Ŝ1·Ŝ3 − 2J23Ŝ2·Ŝ3 + Ŝ1D1Ŝ1 + Ŝ2D2Ŝ2 + Ŝ3D3Ŝ3 | (10.1) |
By processing in the same way, one can also treat four nuclear clusters related, say to the oxygen evolving model complex of Photosystem II of natural photosynthesis.
Open Access funding provided by the Max Planck Society.
Conflicts of interest
There are no conflicts to declare.
References
- D. A. Pantazis, ACS Catal., 2018, 8, 9477 CrossRef CAS.
- C. Van Stappen, L. Decamps, G. E. Cutsail III, R. Bjornsson, J. T. Henthorn, J. A. Birrell and S. DeBeer, Chem. Rev., 2020, 120, 5005 CrossRef CAS PubMed.
-
(a) R. Bjornsson, F. A. Lima, T. Spatzal, T. Weyhermuller, P. Glatzel, E. Bill, O. Einsle, F. Neese and S. DeBeer, Chem. Sci., 2014, 5, 3096 RSC;
(b) J. K. Kowalska, J. T. Henthorn, C. Van Stappen, C. Trncik, O. Einsle, D. Keavney and S. DeBeer, Angew. Chem., Int. Ed., 2019, 58, 9373 CrossRef CAS PubMed.
- L. Noodleman and D. A. Case, Inorg. Chem., 1992, 38, 423 CAS.
- L. Noodleman, J. Chem. Phys., 1981, 74, 5737 CrossRef CAS.
- B. Benediktsson and R. Bjornsson, Inorg. Chem., 2020, 59, 11514 CrossRef CAS PubMed.
- B. Benediktsson and R. Bjornsson, J. Chem. Theory Comput., 2022, 18, 1437 CrossRef PubMed.
-
(a) J.-P. Malrieu, R. Caballol, C. J. Calzado, C. de Graaf and N. Guihéry, Chem. Rev., 2014, 114, 429 CrossRef CAS PubMed;
(b) R. Maurice, C. de Graaf and N. Guihéry, J. Chem. Phys., 2010, 133, 084307 CrossRef PubMed;
(c) R. Maurice, R. Bastardis, C. de Graaf, N. Suaud, T. Mallah and N. Guihéry, J. Chem. Theory Comput., 2009, 5, 2977 CrossRef CAS PubMed;
(d) R. Maurice, N. Guihéry and C. de Graaf, J. Chem. Theory Comput., 2010, 6, 55 CrossRef CAS PubMed;
(e) R. Maurice, A. M. Pradipto, N. Guihéry, R. Broer and C. de Graaf, J. Chem. Theory Comput., 2010, 6, 3092 CrossRef CAS PubMed.
-
R. Maurice, R. Broer, N. Guihéry and C. de Graaf, Handbook of Relativistic Quantum Chemistry, ed. W. Liu, Springer-Verlag, Berlin Heidelberg, 2016, p. 765 Search PubMed.
- J. Henthorn, G. E. Cutsail, T. Weyhermüller and S. DeBeer, Nat. Chem., 2022, 14, 328 CrossRef CAS PubMed.
-
M. B. Robin and P. Day, Mixed Valence Chemistry, Advances in Inorganic Chemistry and Radiochemistry, 1968, vol. 10, pp. 247–422 DOI:10.1016/S0065-2792(08)60179-X.
- P. W. Anderson and H. Hasegawa, Phys. Rev., 1955, 100, 675 CrossRef CAS.
- J.-J. Girerd, J. Chem. Phys., 1983, 79, 1766 CrossRef CAS.
- G. Blondin, S. Borshch and J.-J. Girerd, Comments Inorg. Chem., 1992, 12, 315 CrossRef CAS.
- S. B. Piepho, E. R. Krausz and P. N. Schatz, J. Am. Chem. Soc., 1978, 100, 2996 CrossRef CAS.
- Trough out this work it was assumed, that during the process the Fe–Fe distance does not change. This is justified to the extent of the constraints imposed by the crystal packing.
- A. Domingo, C. Angeli, C. de Graaf and V. Robert, J. Comput. Chem., 2015, 36, 861 CrossRef CAS PubMed.
- F. Neese, Wiley Interdiscip. Rev.:Comput. Mol. Sci., 2018, 8, e1327 Search PubMed.
- F. Neese, F. Wennmohs, U. Becker and C. Riplinger, J. Chem. Phys., 2020, 152, 224108(1–18) CrossRef PubMed.
- N. Spiller, V.-G. Chilkuri, S. DeBeer and F. Neese, Eur. J. Inorg. Chem., 2020, 1525 CrossRef CAS.
-
M. Atanasov, D. Ganyushin, K. Sivalingam and F. Neese, A Modern First-Principles View on Ligand Field Theory Through the Eyes of Correlated Multireference Wavefunctions, Molecular Electronic Structures of Transition Metal Complexes II, ed. D. M. P. Mingos, P. Day and J. P. Dahl, Structure and Bonding, 2012, vol. 143, p. 149 Search PubMed.
- M. Atanasov, D. Aravena, E. Suturina, E. Bill, D. Maganas and F. Neese, Coord. Chem. Rev., 2015, 289–290, 177 CrossRef CAS.
- S. K. Singh, J. Eng, M. Atanasov and F. Neese, Coord. Chem. Rev., 2017, 344, 2 CrossRef CAS.
- B. O. Roos, P. R. Taylor and P. E. M. Sigbahn, Chem. Phys., 1980, 48, 157 CrossRef CAS.
- C. Angeli, S. Evangelisti, R. Cimiraglia and D. A. Maynau, J. Chem. Phys., 2002, 117, 10525 CrossRef CAS.
- C. Angeli, R. Cimiraglia, S. Evangelisti, T. Leininger and J.-P. Malrieu, J. Chem. Phys., 2001, 114, 10252 CrossRef CAS.
- C. Angeli, R. Cimiraglia and J.-P. Malrieu, Chem. Phys. Lett., 2001, 350, 297 CrossRef CAS.
- C. E. Schäffer and C. K. Jørgensen, Mol. Phys., 1965, 9, 401 CrossRef.
- C. E. Schäffer, Struct. Bonding, 1968, 5, 68 CrossRef.
- F. Neese, J. Chem. Phys., 2005, 122, 034107 CrossRef PubMed.
- D. Ganyushin and F. Neese, J. Chem. Phys., 2006, 125, 024103 CrossRef PubMed.
- F. Weigend and R. Ahlrichs, Phys. Chem. Chem. Phys., 2005, 7, 3297 RSC , recontracted for DKH2 by D. A. Pantazis.
- D. A. Pantazis, X.-Y. Chen, C. R. Landis and F. Neese, J. Chem. Theory Comput., 2008, 4, 908 CrossRef CAS PubMed.
- Because the two Kramers doublets originating from S = 3/2 ground state share a common spatial wave function, the excited Kramers doublet at 4.2 cm−1 yields identical results.
- Yet another source of the magnetic anisotropy is spin-spin coupling (SSC) see E. R. Davidson and A. E. Clarc, Phys. Chem. Chem. Phys., 2007, 9, 1881 RSC Compared to SOC, SSC usually yields much smaller (yet non-negligible) contributions to the anisotropy, see F. Neese, J. Am. Chem. Soc., 2006, 128, 10213 CrossRef CAS PubMed.
- J. J. Borrás-Almenar, J. M. Clemente-Juan, E. Coronado and B. S. Tsukerblat, J. Comput. Chem., 2001, 22, 985 CrossRef.
- N. F. Chilton, R. P. Anderson, L. D. Turner, A. Sonchini and K. S. Murray, J. Comput. Chem., 2013, 34, 1164 CrossRef CAS PubMed.
|
| This journal is © the Owner Societies 2022 |
 Open Access Article
 *ab,
N.
Spiller
 a and
F.
Neese
 a
a
![[thin space (1/6-em)]](https://www.rsc.org/images/entities/char_2009.gif) :
:![[thin space (1/6-em)]](https://www.rsc.org/images/entities/char_2009.gif) 1 ratio, reflecting valence localized formally high-spin Fe2+ (d6) and Fe3+(d5) centers (Robin–Day Classes I or II),11 the Mössbauer spectrum of the Te2− analogue (3, Fig. 2b) shows a single quadrupole doublet at T = 80 K, suggesting a fully valence delocalized formally Fe2.5+–Fe2.5+ complex (Robin–Day Class III).11 This finding is further supported by the X-ray structure with two crystallographically equivalent iron sites. X-Band EPR spectra of frozen solutions of 3 (Fig. 2c) have been simulated employing a S = 3/2 spin Hamiltonian. From the interpretation of the EPR-spectrum using a S′ = 1/2 pseudo-spin, large anisotropic g-factors (g = 5.740, 1.950 and 1.515) have been determined (Fig. 2c).10 The low field EPR transition (corresponding to g = 5.740) was relatively sharp; the dependence of its Lorentzian linewidth above T = 10 K allowed estimation of the energy separation between the ground and first excited spin state assuming an Orbach relaxation mechanism. This afforded an upper limit for the axial zero-field splitting parameter: D ≤ 15 cm−1.10 A very large orthorhombic |E/D| ratio (close to the limiting value of 1/3), was extracted from the simulation of the EPR spectrum.10 Variable-temperature SQUID magnetic susceptibility data of solid powder samples (Fig. 2d) has been interpreted using the Bleaney–Bowers equation for mixed valence complexes considering the magnetic exchange between the high-spin Fe2+ (S1 = 2) and Fe3+ (S2 = 5/2) centers (Heisenberg exchange Hamiltonian Hexch = −2JŜ1·Ŝ2) and a double exchange term, Htrans = −B
1 ratio, reflecting valence localized formally high-spin Fe2+ (d6) and Fe3+(d5) centers (Robin–Day Classes I or II),11 the Mössbauer spectrum of the Te2− analogue (3, Fig. 2b) shows a single quadrupole doublet at T = 80 K, suggesting a fully valence delocalized formally Fe2.5+–Fe2.5+ complex (Robin–Day Class III).11 This finding is further supported by the X-ray structure with two crystallographically equivalent iron sites. X-Band EPR spectra of frozen solutions of 3 (Fig. 2c) have been simulated employing a S = 3/2 spin Hamiltonian. From the interpretation of the EPR-spectrum using a S′ = 1/2 pseudo-spin, large anisotropic g-factors (g = 5.740, 1.950 and 1.515) have been determined (Fig. 2c).10 The low field EPR transition (corresponding to g = 5.740) was relatively sharp; the dependence of its Lorentzian linewidth above T = 10 K allowed estimation of the energy separation between the ground and first excited spin state assuming an Orbach relaxation mechanism. This afforded an upper limit for the axial zero-field splitting parameter: D ≤ 15 cm−1.10 A very large orthorhombic |E/D| ratio (close to the limiting value of 1/3), was extracted from the simulation of the EPR spectrum.10 Variable-temperature SQUID magnetic susceptibility data of solid powder samples (Fig. 2d) has been interpreted using the Bleaney–Bowers equation for mixed valence complexes considering the magnetic exchange between the high-spin Fe2+ (S1 = 2) and Fe3+ (S2 = 5/2) centers (Heisenberg exchange Hamiltonian Hexch = −2JŜ1·Ŝ2) and a double exchange term, Htrans = −B![[T with combining circumflex]](https://www.rsc.org/images/entities/i_char_0054_0302.gif) 12 accounting for the transfer of the extra electron in the 3d-shell of Fe2+ (d6) [described by B-the transfer (hopping) energy] to the half field open d-shell of Fe3+ (d5). Because of the equivalence of the two valence forms (Fe12+(d6)–Fe23+(d5) and Fe13+(d5)–Fe22+(d6)), each spin of the exchange coupled iron centers (S = |S1 − S2|, |S1 − S2| + 1, … |S1 + S2| (S = 1/2, 3/2, 5/2, 7/2 and 9/2) appears in pairs which are split into two sublevels by electron transfer. To describe and interpret the spectra and magnetic properties of these systems, the Anderson–Hasegawa double exchange model yielding eqn (1.1) for the dependence of the energy on the spin S has been extensively used.12–15
12 accounting for the transfer of the extra electron in the 3d-shell of Fe2+ (d6) [described by B-the transfer (hopping) energy] to the half field open d-shell of Fe3+ (d5). Because of the equivalence of the two valence forms (Fe12+(d6)–Fe23+(d5) and Fe13+(d5)–Fe22+(d6)), each spin of the exchange coupled iron centers (S = |S1 − S2|, |S1 − S2| + 1, … |S1 + S2| (S = 1/2, 3/2, 5/2, 7/2 and 9/2) appears in pairs which are split into two sublevels by electron transfer. To describe and interpret the spectra and magnetic properties of these systems, the Anderson–Hasegawa double exchange model yielding eqn (1.1) for the dependence of the energy on the spin S has been extensively used.12–15


![[thin space (1/6-em)]](https://www.rsc.org/images/entities/char_2009.gif) 800, 4950, 440 and 10 CSFs for S = 1/2, 3/2, 5/2, 7/2 and 9/2, respectively, is mandatory in order obtain ZFS tensors D and g-matrices for a direct comparison with experimental – EPR and magnetic data. In the ORCA code this is achieved using QDPT30,31 by diagonalization of the SOC Hamiltonian within the many particle basis of the CASSCF wave functions, large enough in order to capture properly the effect of SOC on the lowest, thermally-accessible magnetic sublevels. It follows that SOC calculations can never be state-specific and of the same quality as the scalar relativistic S states of lowest energy (see above). A compromise between accuracy and feasibility is inevitable. A trial and error analysis has shown that taking the 40 lowest scalar relativistic roots is enough to properly approximate the ZFS tensor D and g-matrices of the spin-Hamiltonians of the lowest levels for each spin. To this end, wave functions from a converged CASSCF calculation resulting from the “%casscf, mult 2,4,6,8,10, nroots 5,5,5,5,5” option were employed as the input for a spin-specific, state average SOC calculation using simple Complete Active Space Configuration Interaction, CASCI (i.e. not iterating orbitals, “%casscf maxiter 1, mult 2S + 1, nroots 40” but accounting for dynamical correlation “nevpt2 true”).
800, 4950, 440 and 10 CSFs for S = 1/2, 3/2, 5/2, 7/2 and 9/2, respectively, is mandatory in order obtain ZFS tensors D and g-matrices for a direct comparison with experimental – EPR and magnetic data. In the ORCA code this is achieved using QDPT30,31 by diagonalization of the SOC Hamiltonian within the many particle basis of the CASSCF wave functions, large enough in order to capture properly the effect of SOC on the lowest, thermally-accessible magnetic sublevels. It follows that SOC calculations can never be state-specific and of the same quality as the scalar relativistic S states of lowest energy (see above). A compromise between accuracy and feasibility is inevitable. A trial and error analysis has shown that taking the 40 lowest scalar relativistic roots is enough to properly approximate the ZFS tensor D and g-matrices of the spin-Hamiltonians of the lowest levels for each spin. To this end, wave functions from a converged CASSCF calculation resulting from the “%casscf, mult 2,4,6,8,10, nroots 5,5,5,5,5” option were employed as the input for a spin-specific, state average SOC calculation using simple Complete Active Space Configuration Interaction, CASCI (i.e. not iterating orbitals, “%casscf maxiter 1, mult 2S + 1, nroots 40” but accounting for dynamical correlation “nevpt2 true”).

![[thin space (1/6-em)]](https://www.rsc.org/images/entities/char_2009.gif) 218
218![[thin space (1/6-em)]](https://www.rsc.org/images/entities/char_2009.gif) 588
588![[thin space (1/6-em)]](https://www.rsc.org/images/entities/char_2009.gif) 163
163![[thin space (1/6-em)]](https://www.rsc.org/images/entities/char_2009.gif) 861
861![[thin space (1/6-em)]](https://www.rsc.org/images/entities/char_2009.gif) 177
177![[thin space (1/6-em)]](https://www.rsc.org/images/entities/char_2009.gif) 279
279![[thin space (1/6-em)]](https://www.rsc.org/images/entities/char_2009.gif) 167 to 24
167 to 24![[thin space (1/6-em)]](https://www.rsc.org/images/entities/char_2009.gif) 140 cm−1 those obtained when imposing a Fe2+μTe2Fe3+ electron localization.
140 cm−1 those obtained when imposing a Fe2+μTe2Fe3+ electron localization.![[thin space (1/6-em)]](https://www.rsc.org/images/entities/char_2009.gif) eH (cm−1) −16731.
eH (cm−1) −16731.

![[thin space (1/6-em)]](https://www.rsc.org/images/entities/char_2009.gif) 605
605![[thin space (1/6-em)]](https://www.rsc.org/images/entities/char_2009.gif) 500
500![[thin space (1/6-em)]](https://www.rsc.org/images/entities/char_2009.gif) 057
057![[thin space (1/6-em)]](https://www.rsc.org/images/entities/char_2009.gif) 873
873


 ; Meff = 2MTe = 255.2, ħω = 141.2 cm−1 – the vibrational frequency; q → fq; (dD/dq)o → (dD/dq)o/f; (d2D/dq2)o → (d2D/dq2)o/f2; (dg/dq)o → (dg/dq)o/f; (d2g/dq2)o → (d2g/dq2)o/f2.


![[thin space (1/6-em)]](https://www.rsc.org/images/entities/char_2009.gif) 10) results. Using this value, we computed energies of the lowest four Kramers doublets along with their anisotropic g-values (see bottom half of Table 8). The comparison between the results from the Class III and Class I modelling of 3′ shows the combined effect of electron transfer and vibronic coupling on the vibronic levels: the energies of the third and the fourth excited Kramers states change from 141.3 and 145.4 cm−1, energies stemming from a zero-field split vibrational excitation (Class I) (the value of the nominal first vibrational excitation) to as much as three times smaller energies, 44.2 and 48.4 cm−1. Energies of the lowest three excited levels of 3 are not known. However, spin-relaxation times determined from the temperature dependence of the Lorentzian broadening of spin-relaxation times have been reported (Fig. 14). From these data the authors obtained an Orbach energy gap of U = 60 cm−1 ≈ 4D. Inspection of the Arrhenius ln(1/τ) vs. 1/kT plots in Fig. 14 allows one to recognize two different slopes, a larger one for the data at higher temperatures (T = 20, 13.3 K), and a smaller slope reflected by the data at lower temperatures (T = 10, 8, 6.7 K). With some precaution (in view of the inherent approximations), we were able to simulate the data using two exponents to afford two Orbach energies U1 = 5.6 cm−1 and U2 = 30.5 cm−1. These are in a reasonable agreement with the computed values −4.2 cm−1 and 45 cm−1, respectively. A more rigorous direct access to the energies of the lowest excitations would be possible using dedicated experiments, such as inelastic neutron scattering. We hope that the theoretical results of this work will stimulate such further studies on 3.
10) results. Using this value, we computed energies of the lowest four Kramers doublets along with their anisotropic g-values (see bottom half of Table 8). The comparison between the results from the Class III and Class I modelling of 3′ shows the combined effect of electron transfer and vibronic coupling on the vibronic levels: the energies of the third and the fourth excited Kramers states change from 141.3 and 145.4 cm−1, energies stemming from a zero-field split vibrational excitation (Class I) (the value of the nominal first vibrational excitation) to as much as three times smaller energies, 44.2 and 48.4 cm−1. Energies of the lowest three excited levels of 3 are not known. However, spin-relaxation times determined from the temperature dependence of the Lorentzian broadening of spin-relaxation times have been reported (Fig. 14). From these data the authors obtained an Orbach energy gap of U = 60 cm−1 ≈ 4D. Inspection of the Arrhenius ln(1/τ) vs. 1/kT plots in Fig. 14 allows one to recognize two different slopes, a larger one for the data at higher temperatures (T = 20, 13.3 K), and a smaller slope reflected by the data at lower temperatures (T = 10, 8, 6.7 K). With some precaution (in view of the inherent approximations), we were able to simulate the data using two exponents to afford two Orbach energies U1 = 5.6 cm−1 and U2 = 30.5 cm−1. These are in a reasonable agreement with the computed values −4.2 cm−1 and 45 cm−1, respectively. A more rigorous direct access to the energies of the lowest excitations would be possible using dedicated experiments, such as inelastic neutron scattering. We hope that the theoretical results of this work will stimulate such further studies on 3.

![[T with combining circumflex]](https://www.rsc.org/images/entities/i_char_0054_0302.gif) 12. The action of
12. The action of ![[T with combining circumflex]](https://www.rsc.org/images/entities/i_char_0054_0302.gif) 12 is defined by eqn (9.1); it considers the transfer of one electron between the two resonance forms, in our case:
12 is defined by eqn (9.1); it considers the transfer of one electron between the two resonance forms, in our case:![[T with combining circumflex]](https://www.rsc.org/images/entities/i_char_0054_0302.gif) 12|Ψleft〉 = |ΨA(d6)ΨB(d5) 〉 = |Ψright〉 = |ΨA(d5)ΨB(d6)〉
12|Ψleft〉 = |ΨA(d6)ΨB(d5) 〉 = |Ψright〉 = |ΨA(d5)ΨB(d6)〉![[T with combining circumflex]](https://www.rsc.org/images/entities/i_char_0054_0302.gif) 12 acts on the complex SOC components of two S = 3/2 ground state Kramers doublets (eqn (9.2)), consisting of one- and two-electron electron transfer operators:
12 acts on the complex SOC components of two S = 3/2 ground state Kramers doublets (eqn (9.2)), consisting of one- and two-electron electron transfer operators:
![[T with combining circumflex]](https://www.rsc.org/images/entities/i_char_0054_0302.gif) 12 is written down in second quantization with a+jβ∈B, a+jβ∈A and aiβ∈A, aiβ∈B pairs of creation and annihilation operators describing the transfer of the surplus β spin from the Fe2+(d6) center (left) to the half-filled shell of Fe3+(d5) (right, or vice versa). Analysis of the local Fock operator in the basis of converged CASSCF wave function, evaluated using CAS(11,10) converged natural orbitals allows for extraction of the one-electron transfer integrals illustrated in Fig. 15 (see ESI,† for computational details). It follows from this numerical example, that out of the five possible one-electron transfer pathways, three, from the lowest occupied orbital of Fe2+ to the second, third and fourth orbital of Fe3+, are comparable in magnitude und should be simultaneously accounted for. In other words, three different parameters (B12, B13 and B14), rather than just only one B parameter, should be considered. Since four excited states of the d6 configuration may couple the ground state one (Fig. 15) via SOC, a total of as much as 25 charge transfer integrals (Table 9) would have to be considered. The quantities in Fig. 15 have been obtained using CASSCF wave functions. One expects that dynamical correlation will modify the parameters Bij to render the problem at the present stage not tractable. Efforts in this direction are the subject of ongoing projects in our group.
12 is written down in second quantization with a+jβ∈B, a+jβ∈A and aiβ∈A, aiβ∈B pairs of creation and annihilation operators describing the transfer of the surplus β spin from the Fe2+(d6) center (left) to the half-filled shell of Fe3+(d5) (right, or vice versa). Analysis of the local Fock operator in the basis of converged CASSCF wave function, evaluated using CAS(11,10) converged natural orbitals allows for extraction of the one-electron transfer integrals illustrated in Fig. 15 (see ESI,† for computational details). It follows from this numerical example, that out of the five possible one-electron transfer pathways, three, from the lowest occupied orbital of Fe2+ to the second, third and fourth orbital of Fe3+, are comparable in magnitude und should be simultaneously accounted for. In other words, three different parameters (B12, B13 and B14), rather than just only one B parameter, should be considered. Since four excited states of the d6 configuration may couple the ground state one (Fig. 15) via SOC, a total of as much as 25 charge transfer integrals (Table 9) would have to be considered. The quantities in Fig. 15 have been obtained using CASSCF wave functions. One expects that dynamical correlation will modify the parameters Bij to render the problem at the present stage not tractable. Efforts in this direction are the subject of ongoing projects in our group.


