 Open Access Article
Creative Commons Attribution 3.0 Unported Licence
NIR-II cell endocytosis-activated fluorescent probes for in vivo high-contrast bioimaging diagnostics†
Yue
He‡
a,
Shangfeng
Wang‡
 *a,
Peng
Yu‡
a,
Kui
Yan
a,
Jiang
Ming
a,
Chenzhi
Yao
a,
Zuyang
He
a,
Ahmed Mohamed
El-Toni
b,
Aslam
Khan
 b,
Xinyan
Zhu
a,
Caixia
Sun
a,
Zuhai
Lei
a and
Fan
Zhang
 *a
*a
aDepartment of Chemistry, State Key Laboratory of Molecular Engineering of Polymers and iChem, Shanghai Key Laboratory of Molecular Catalysis and Innovative Materials, Fudan University, Shanghai 200433, China. E-mail: sfwang@fudan.edu.cn; zhang_fan@fudan.edu.cn
bKing Abdullah Institute for Nanotechnology, King Saud University, Riyadh 11451, Saudi Arabia
First published on 30th June 2021
Abstract
Fluorescence probes have great potential to empower bioimaging, precision clinical diagnostics and surgery. However, current probes are limited to in vivo high-contrast diagnostics, due to the substantial background interference from tissue scattering and nonspecific activation in blood and normal tissues. Here, we developed a kind of cell endocytosis-activated fluorescence (CEAF) probe, which consists of a hydrophilic polymer unit and an acid pH-sensitive small-molecule fluorescent moiety that operates in the “tissue-transparent” second near-infrared (NIR-II) window. The CEAF probe stably presents in the form of quenched nanoaggregates in water and blood, and can be selectively activated and retained in lysosomes through cell endocytosis, driven by a synergetic mechanism of disaggregation and protonation. In vivo imaging of tumor and inflammation with a passive-targeting and affinity-tagged CEAF probe, respectively, yields highly specific signals with target-to-background ratios over 15 and prolonged observation time up to 35 hours, enabling positive implications for surgical, diagnostic and fundamental biomedical studies.
Introduction
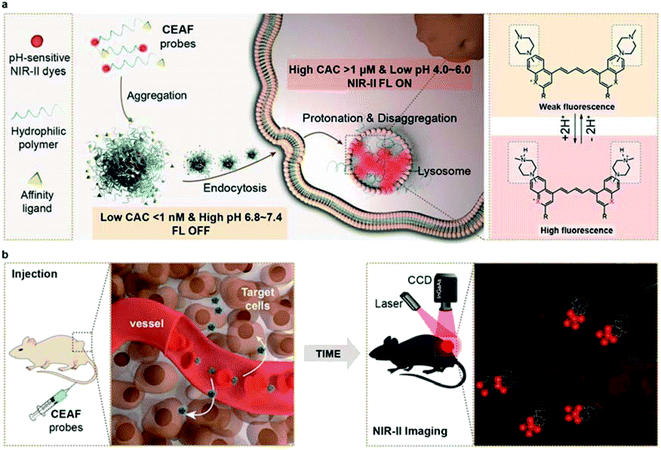
Fluorescence imaging has emerged as a powerful tool for preclinical in vivo imaging and as a promising clinical technology, particularly for surgical guidance.1–3 Systemically delivered fluorescence probes have the potential to broadly highlight disease sites without any previous knowledge of disease location. Several FDA-approved dyes such as indocyanine green (ICG) tagged affinity agents have afforded substantial clinical benefits,4,5 but the main limitation is their overall non-specific fluorescence background that results in insufficient sensitivity. Comparing with “always-on” fluorescence,6 activatable fluorescence probes that specifically respond to biomarkers in disease progress such as reactive oxygen species7 and proteases8 can reduce off-target background signals, which leads to further increased imaging contrast.9–14 However, this original intention is usually compromised and limited in its ability to diagnose diverse diseases due to the complex and heterogeneous physiological environment in vivo.15,16 In particular, most activatable probes tend to nonspecifically bind with the ubiquitous biomacromolecules (e.g., serum albumins, lipoproteins) in blood, which may trigger unwanted fluorescence and complicate the pharmacokinetics, resulting in short-term retention in lesions and low target-to-background ratio (TBR).17–19 More importantly, currently available activatable probes mostly emit visible (VIS; 400–700 nm) and near-infrared (NIR-I; 700–900 nm) signals that could be significantly altered by tissue heterogeneities and depth location, leading to limited TBR in vivo.20,21In this work, we develop a series of Cell Endocytosis-Activated Fluorescent (CEAF) probes that operate in the “tissue-transparent” NIR-II (1000–1700 nm) window to minimize the background signal and maximize the TBR. We rationally design and optimize an acidic pH-sensitive NIR-II fluorophore and by further conjugating a functionalized polyethylene glycol unit, we synthesize the amphiphilic CEAF probes which exhibit unexpectedly ultralow critical aggregation concentration (CAC) below 1 nM in water. This characteristic allows the probes to be stably present in the form of quenched nanoaggregates in blood (Scheme 1), while disaggregation and fluorescence activation (up to 72-fold) selectively occur in cell endocytosis, driven by the increased CAC value in lysosomes due to the enhanced noncovalent interaction and acid strength. Notably, protonation of fluorophores therein further produces approximately 1.5-fold fluorescence enhancement, enabling amplified fluorescence activation inside cells (up to 108-fold) and long-term intracellular retention. We demonstrate the image-guided surgery application of a passive-targeting probe CEAF-OMe for precisely locating tumors, enabling clear resection margins with no risk of fluorescence contamination from intraoperative bleeding. In addition, by using the probe CEAF-RGD with specific affinity for M1 macrophage, we realize cell-specific diagnosis of traumatic arthritis in vivo with high TBR over 15.
Results and discussion
Lysosomes are the acidic organelles at the end of the endocytic pathway, in which substances are surrounded by an area of lipid membrane and frequently interact with the densely distributed acid hydrolases and lysosomal catabolites, such as free fatty acids and lipids.22–25 We reasoned that this unique microenvironment distinct from the extracellular matrix and blood could be explored as a trigger for fluorescence activation.26–29Preparation and characterization of pH-sensitive and lysosomal-targeting NIR lyso dyes
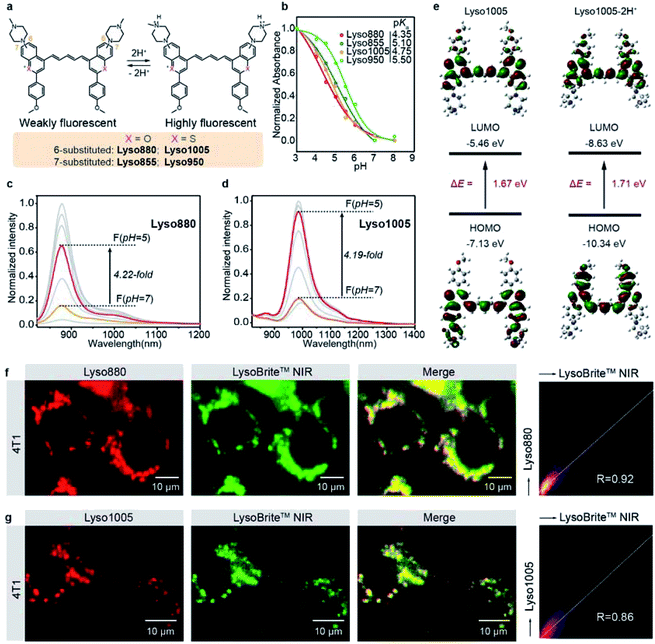
To this end, we first developed a series of acidic pH-sensitive fluorescence probes for lysosome tracking. We created four dyes, Lyso855/Lyso880 and Lyso950/Lyso1005, by introducing the lysosome-targeting piperazine moieties30,31 at the C7/C6 position of the NIR-II dye skeletons (Flav32 and BTC33) (Fig. 1a; synthetic methods are shown in the ESI†). Their spectra–structure relationship is predictable (Fig. S1–4†), that is, the sulfur heteroatom and C6 electron-donating substitution afford a longer wavelength due to enhanced delocalization and intramolecular charge transfer (ICT) effect, respectively.33,34 All dyes show excellent photo-stability and chemical stability under physiological conditions (Fig. S15–19†). To screen the optimal lysosomal pH sensitive dye, we measured the absorption and fluorescence spectra of the four dyes in the pH range of 3.0–8.0. Fig. 1b shows their pKa values centered around 5 based on the absorption changes (Fig. S1–4†), suitable for sensing the acidic environment (pH = 5.0–6.0) of lysosomes. Owing to the protonation of the piperazine groups, enhanced fluorescence of these dyes was observed at lower pH. In particular, Lyso880 and Lyso1005 with piperazine moieties substituted at the C6 position exhibited more than 4-fold fluorescence enhancement when the pH decreased from 7.0 to 5.0 (Fig. 1c and d).To further elucidate the pH sensing mechanism, TF-DFT calculations were performed for all dyes at the B3LYP/6-311 G (d, p) level after geometry optimization (Fig. 1e). For Lyso1005, the π-electron distribution of HOMO on the piperazine groups is significantly delocalized onto the p-methoxy phenyl groups of LUMO upon photoexcitation. In comparison, protonated Lyso1005 (Lyso1005-2H+) shows little difference between the HOMO and LUMO, indicating that protonation of piperazine moieties suppresses intramolecular charge transfer.34 This results in enhanced fluorescence, especially in a polar solvent, as confirmed by a 3.5-fold enhancement of quantum yield (QY) in ethanol after adding trifluoroacetic acid (Table S1†). Similar results were obtained for C6 substituted Lyso880, but not significantly for C7 substituted Lyso855 and Lyso950 (Fig. S6–8 and Table S1†), consistent with their pH-sensitive fluorescence properties. Furthermore, the S0–S1 excitation energies slightly increased from Lyso1005 (1.67 eV) to Lyso1005-2H+ (1.71 eV), corresponding to the blue-shift spectra of Lyso1005-2H+ (Fig. 1e and Table S1†). Therefore, we reasoned that weakening the electron-donating ability of piperazine moieties by the negative inductive effect of protonated nitrogen is the main reason for pH sensitivity. To confirm this conclusion, we synthesized another model compound boc-Lyso1005 by replacing the methyl groups of piperazine with the electron-withdrawing t-butyloxy carbonyl groups (synthetic methods shown in the ESI†). The higher QY (0.13%) and blue-shifted absorption of boc-Lyso1005 compared with Lyso1005 further verify that enhancing the negative inductive effect of the piperazine aliphatic amine contributes positively to the photophysical properties of dyes (Table S1†).
We next co-stained A549 and 4T1 cells with these dyes and the commercial lysosomal tracker (LysoBrite™ NIR), respectively. In addition to no obvious cytotoxicity observed (Fig. S10†), the merged fluorescence images and co-localization results show overlapped dotted signals inside cells with high Pearson coefficient over 0.80 (Fig. 1f, g and S11–14†), suggesting that almost all dyes are capable of lysosomal tracking. Lyso1005 with the optimal fluorescence enhancement and longest wavelength was thus chosen for the following experiments.
Preparation and characterization of the NIR-II cell endocytosis-activated fluorescence probe (CEAF-OMe)
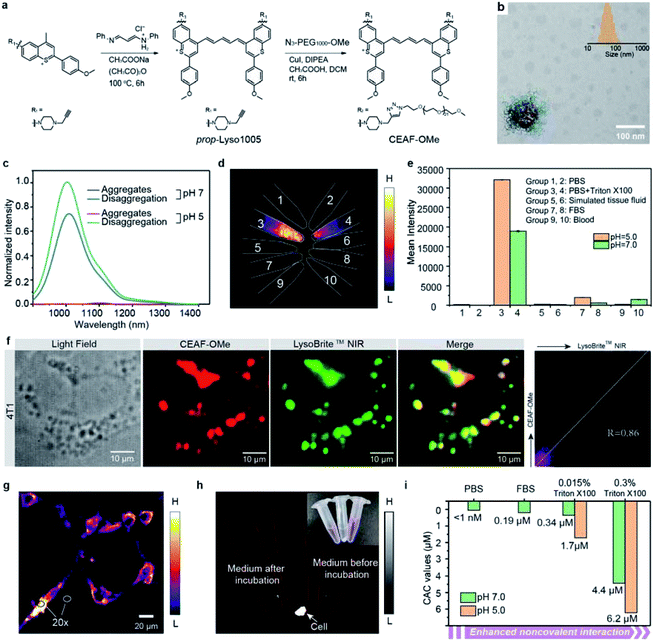
The non-specific binding trap of plasma proteins contributes greatly to the high background of small-molecule probes in blood and normal tissues.17–19 To reduce the non-specific binding effect, we synthesized the amphiphilic Lyso1005 (namely CEAF-OMe) by a click reaction between a propargyl-functionalized Lyso1005 (prop-Lyso1005) and two polyethylene glycol (PEG) chains of ∼1 kDa (N3–PEG1000–OCH3) (Fig. 2a). Maldi-TOF spectrum confirmed the bis-PEGylated structure (Fig. S59†). CEAF-OMe can form uniform spherical nanoaggregates in pH 7.4 phosphate buffer (PBS) with an average hydrodynamic diameter of ∼76 nm (Fig. 2b), which completely quenches the fluorescence due to the aggregation induced quenching (ACQ) effect. It has been demonstrated that surfactants such as Triton X-100 could be used for mimicking the non-covalent interaction between the molecules and lysosomal contents (i.e., proteins, lipids and fatty acids).35–37 Notably, after adding 0.015 wt% Triton X-100 (Fig. 2c), significant fluorescence recovery (72-fold) can be observed, corresponding to the disaggregation-induced fluorescence activation. Similar results are also concluded with the addition of other surfactants (Fig. S20†). Notably, the fluorescence recovery cannot be achieved only by lowering the pH to 5.0, despite approaching the pKa value (pKa = 5.02, Fig. S5†). However, after further addition of Triton X-100, the fluorescence increased 1.5 times more than that under the condition of Triton X-100 + pH 7.4, realizing 108-fold enhancement in all compared with the quenched state. We then tested the stability of CEAF-OMe in various biological fluids, such as fetal bovine serum (FBS), blood, and simulated tissue fluid at both pH = 7.0 and pH = 5.0 (Fig. 2d and e). NIR-II fluorescence imaging showed that CEAF-OMe remained quenched in these fluids and only exhibited bright signals under the condition of Triton X-100, illustrating that CEAF-OMe has considerable stability to plasma proteins. This will allow low fluorescence background in blood vessels when using CEAF-OMe for in vivo imaging. However, when CEAF-OMe was co-incubated with 4T1 cells for 12 h, co-localization results showed that the signals of CEAF-OMe overlapped with that of LysoBrite™ NIR in cell lysosomes with a high Pearson coefficient of 0.86 (Fig. 2f), indicating the selective activation of CEAF in cell lysosomes. Besides, “no-wash” cell imaging showed distinct fluorescence activation inside the cells, while almost no fluorescence could be detected in the cell culture (Fig. 2g and h). The ratios of intracellular to extracellular signals reached up to 20 for 4T1 cells (Fig. 2g). These results evidenced that CEAF-OMe was mainly activated inside cells through the endocytosis mechanism.In vitro mechanism study of CEAF-OMe activation
To rationalize the above phenomena, we measured the concentration-dependent fluorescence of CEAF-OMe in the relevant media/conditions (Fig. 2i, S21 and 22†). The corresponding transition point can be recognized as the critical aggregation concentration (CAC), reflecting the disaggregation tendency of CEAF-OMe under different environmental conditions.38 CEAF-OMe has an undetectable ultralow critical aggregation concentration (CAC) below 1 nM in pH 7.4 PBS (Fig. S21a and b†)—an important characteristic suggesting potential tolerance toward blood dilution.39 The CAC increased to ∼341 nM in the presence of 0.015 wt% Triton X-100 due to enhanced noncovalent interaction, and exhibited positive correlation with Triton X-100 concentration (Fig. S22†). Remarkably, lowering the pH to 5.0 further increased the CAC value by 5 fold to ∼1700 nM, indicating the significant contribution of protonation to disaggregation. In comparison, the CAC in FBS solution (pH 7.4) was only ∼190 nM (Fig. S21c and d†), illustrating the weak influence of plasma proteins on CEAF-OMe, thus ensuring the dark background of CEAF-OMe nanoaggregates in blood circulation. Collectively, the results support a reasonable CEAF mechanism according to which the high activation of the probes relies on the synergy of disaggregation and protonation, which are controlled by the difference in noncovalent interactions and acid strength of lysosomes relative to an extracellular medium or blood.In vivo NIR-II tumor imaging and surgical guidance with CEAF-OMe
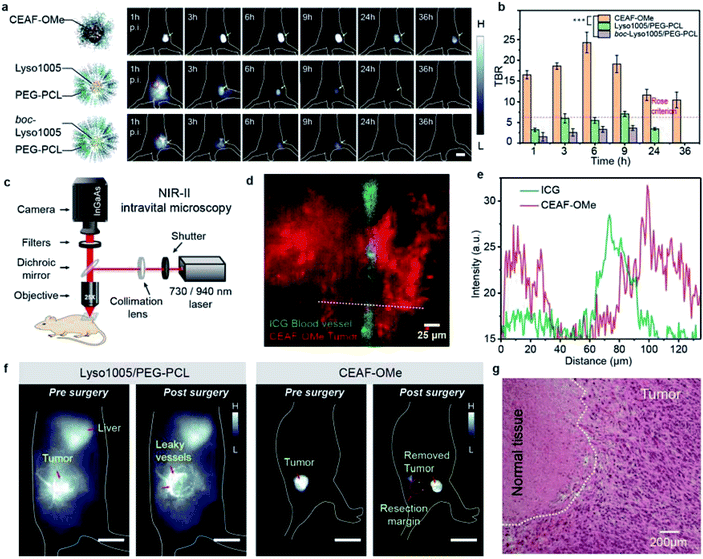
Encouraged by the above results, we applied CEAF-OMe for in vivo tumor imaging. We reasoned that tumor angiogenesis may induce CEAF-OMe nanoaggregates to exploit passive targeting for specific endocytosis activation by tumor cells. As a comparison, two “always-on” nanoprobes (Lyso1005/PEG–PCL and boc-Lyso1005/PEG–PCL) with similar hydrodynamic sizes to CEAF-OMe (Fig. S23†) were chosen as control groups, which were polyethylene glycol-b-polycaprolactone (PEG–PCL) micelles encapsulating pH sensitive Lyso1005 and non-sensitive boc-Lyso1005, respectively (Fig. S24†). In vivo whole-body NIR-II fluorescence imaging was performed in nude mice bearing subcutaneous CT26 tumors (n = 3 for each group, Fig. 3a and S25†) immediately after tail-vein injection of these probes. As shown in Fig. 3a, CEAF-OMe could clearly resolve the tumor margin after 1 h post-injection (p.i.), while the two control groups were unable to distinguish tumors due to the strong background signals from skin and blood vessels. Notably, the TBRs of the CEAF-OMe group maintained high values above 10 within 36 h p.i. (Fig. 3b), significantly higher than the Rose criterion (which states that a TBR of 5 is needed to distinguish image features with 100% certainty).40 However, in the control groups, only Lyso1005/PEG–PCL showed a signal window that met the Rose criterion and lasted for 6 h. Therefore, the results demonstrate that the CEAF strategy combined with lysosomal tracking property endows probes with long retention time and high TBR in tumor, favorable for stable image-guided surgery.To further confirm the specificity of CEAF-OMe, NIR-II intravital microscopic imaging was performed after 3 h p.i. of probes (Fig. 3c). A two-color epifluorescence image was obtained by using indocyanine green (ICG) as a vascular contrast agent simultaneously (Fig. 3d). It could be seen that the fluorescence signals of CEAF-OMe were specifically activated in tumor cells, and had little overlap with the ICG signals in the blood vessel (Fig. 3e), which further confirmed the low background of CEAF-OMe in blood. This property is particularly useful for accurate tumor-removal surgery as it can avoid the serious fluorescence contamination caused by intraoperative bleeding.41,42 To demonstrate this expectation, we conducted the fluorescence-guided surgery, where CEAF-OMe allowed a fast-acting and complete resection of the tumor within 3 h p.i., as confirmed by the tissue hematoxylin and eosin (H&E) staining results (Fig. 3f, g and Video S1†). However, the control group injected with Lyso1005/PEG–PCL showed strong fluorescence contamination from leaky blood, hindering the subsequent operations (Fig. 3f and Video S2†).
Preparation and characterization of the NIR-II functional CEAF-NHS and αvβ3-specific CEAF-RGD
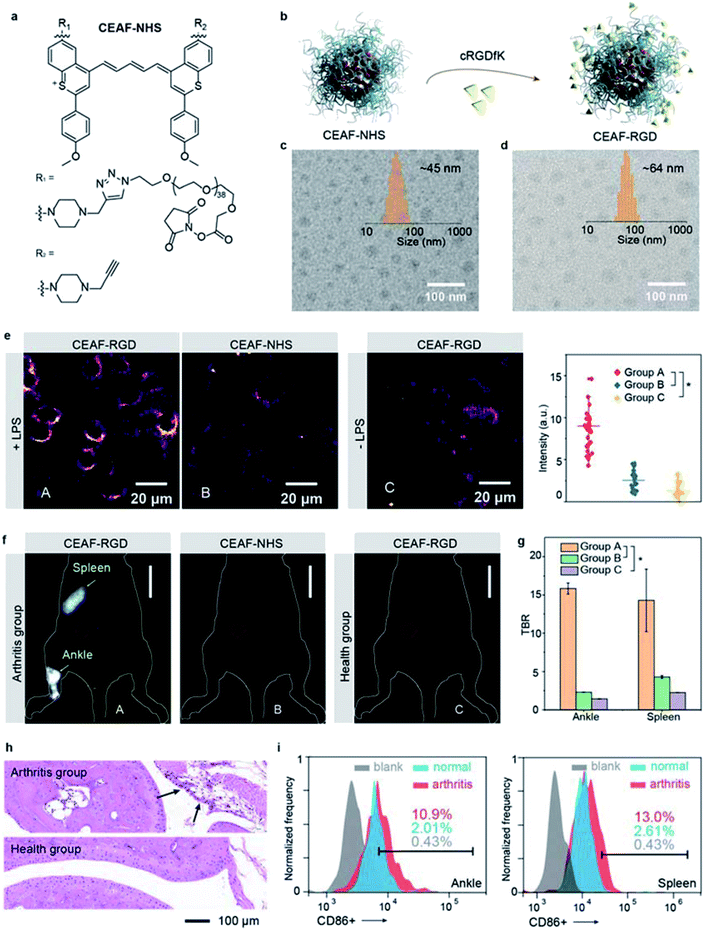
Besides tumor imaging based on passive targeting, equipping CEAF probes with affinity ligands will enable cell-specific diagnostics.43,44 Traumatic arthritis (TA) caused by intense external force is an acute inflammatory disease and its early recognition and treatment is essential for achieving effective therapeutic outcome.45 It was reported that the inflammatory response after TA involves the recruitment of M1 macrophages with highly overexpressed integrin αvβ3 to the articular cavity, which can be a potential biomarker for early diagnosis of TA.46 To demonstrate the versatility of the CEAF strategy, we synthesized a functionalized CEAF probe with terminal N-hydroxysuccinimide (NHS) active ester group (namely CEAF-NHS, Fig. 4a). Similarly, CEAF-NHS forms uniform spherical nanoaggregates in pH 7.4 phosphate buffer with quenched fluorescence, which can be facilely modified with active-targeting ligands through an amidation reaction (Fig. 4b). In this case for TA diagnosis, the selective ligands for αvβ3 integrin, cRGDfK (cyclo Arg–Gly–Asp–D–Tyr–Lys), were conjugated to the surface of CEAF-NHS nanoaggregates, which created a targetable CEAF probe CEAF-RGD for specifically recognizing M1 macrophages.47–49 Successful modification was confirmed by the increased hydrodynamic diameter of nanoaggregates from ∼45 to ∼64 nm (Fig. 4c and d).To investigate the specificity of probes for M1 macrophages, CEAF-RGD were incubated with RAW264.7 (+LPS) and RAW264.7 (−LPS) cells for 2 h, where lipopolysaccharide (LPS) serves as an inducer to polarize the RAW264.7 cells toward the M1 phenotype.50 As a control, CEAF-NHS with the active end-group blocked by glycine were further incubated with RAW264.7 (+LPS) for 2 h as well (Fig. 4e). “No-wash” cell imaging results showed that RAW264.7 (+LPS) cells incubated with CEAF-RGD exhibited 3.4- to 5.6-fold higher fluorescence than the cells of the other two groups, indicating that CEAF-RGD is capable of specific fluorescence activation to M1 macrophages through the receptor-mediated endocytosis.
In vivo NIR-II fluorescence diagnosis of arthritis with CEAF-RGD
Next, CEAF-RGD and glycine-blocked CEAF-NHS were intravenously injected into mouse models with TA on one leg, respectively, followed by in vivo NIR-II fluorescence imaging (Fig. 4f and S26†). In the TA mice using CEAF-RGD, the injured joint could be specifically resolved with a high TBR of ∼15.8 (Fig. 4f and g). Almost no signal was observed with CEAF-NHS, while a similar result was obtained in normal mice injected with CEAF-RGD (Fig. 4f). These results demonstrate the superior specificity of CEAF-RGD for the TA diagnosis. Interestingly, spleen could also be clearly distinguished with a high TBR of ∼14.3 in the TA mice using CEAF-RGD (Fig. 4f and g). This is consistent with the general understanding that massive expansion of mononuclear cells occurs in TA spleen and articular cavity.46 To further support the imaging results, we carried out the histological and flow cytometry analysis on the TA and normal mice, respectively. The results showed that macrophage infiltration (black arrow in Fig. 4h) occurred in the TA articular cavity, and increased number of M1 macrophages was observed in both the TA articular cavity and spleen (Fig. 4i and S27†), thus confirming the observation of in vivo NIR-II fluorescence imaging.Conclusions
In conclusion, we have developed CEAF probes through the creation and hydrophilic polymer modification of four NIR-II lysosome tracking dyes, and demonstrated their utilities for enhancing the effectiveness of tumor resections during fluorescence-guided surgery, as well as for cell-specific diagnosis of traumatic arthritis. The mechanism of action for CEAF probes is based on the disaggregation and protonation of probe aggregates in targeting cell lysosomes, which eliminates the fluorescence background generated in blood circulation and thus significantly enhances in vivo imaging sensitivity and contrast. Compared with activatable probes established on single physiological biomarkers, the NIR-II CEAF probes equipped with various cell-surface affinity ligands not only will provide a general and robust solution for diverse disease diagnostics, but also enable high-contrast cell-specific imaging in vivo.Ethical statement
All animal procedures were performed in accordance with the guidelines of the Institutional Animal Care and Use Committee of Fudan University, in agreement with the institutional guidelines for animal handling. All of the animal experiments were authorized by the Shanghai Science and Technology Committee.Data availability
All experimental or computational data associated with this article have been provided in the supporting information and supporting video files.Author contributions
The manuscript was written through contributions of all authors. All authors have given approval to the final version of the manuscript.Conflicts of interest
The authors declare no competing financial interest.Acknowledgements
The work was supported by the National Key R&D Program of China (2017YFA0207303), National Natural Science Foundation of China (NSFC, 22088101, 21725502, 51961145403, 22004018), Key Basic Research Program of Science and Technology Commission of Shanghai Municipality (20JC1411700, 19490713100, 20490710600, 20S31903700), Shanghai Engineering Technology Research Center of Hair Medicine (19DZ2250500), and China Postdoctoral Science Foundation (KLH1615200, KLH1615215). The authors acknowledge financial support from Researchers Supporting Project Number (RSP-2021/90), King Saud University, Riyadh, Saudi Arabia.Notes and references
- A. V. Naumova, M. Modo, A. Moore, C. E. Murry and J. A. Frank, Nat. Biotechnol., 2014, 32, 804–818 CrossRef CAS PubMed.
- R. Weissleder and M. J. Pittet, Nature, 2008, 452, 580–589 CrossRef CAS PubMed.
- P. Anees, J. Joseph, S. Sreejith, N. V. Menon, Y. Kang, S. Wing-Kwong Yu, A. Ajayaghosh and Y. Zhao, Chem. Sci., 2016, 7, 4110–4116 RSC.
- S. Zhu, Z. Hu, R. Tian, B. C. Yung, Q. Yang, S. Zhao, D. O. Kiesewetter, G. Niu, H. Sun, A. L. Antaris and X. Chen, Adv. Mater., 2018, 30, e1802546 CrossRef PubMed.
- A. Brescia, M. Pezzatini, G. Romeo, M. Cinquepalmi, F. Pindozzi, A. Dall'Oglio, M. Gasparrini and F. Lazar, Updates Surg., 2018, 70, 427–432 CrossRef PubMed.
- D. Cheng, J. Peng, Y. Lv, D. Su, D. Liu, M. Chen, L. Yuan and X. Zhang, J. Am. Chem. Soc., 2019, 141, 6352–6361 CrossRef CAS PubMed.
- J. Chan, S. C. Dodani and C. J. Chang, Nat. Chem., 2012, 4, 973–984 CrossRef CAS PubMed.
- H.-W. Liu, L. Chen, C. Xu, Z. Li, H. Zhang, X.-B. Zhang and W. Tan, Chem. Soc. Rev., 2018, 47, 7140–7180 RSC.
- N. Zhou, F. Huo, Y. Yue and C. Yin, J. Am. Chem. Soc., 2020, 142, 17751–17755 CrossRef CAS PubMed.
- X. Wu, W. Shi, X. Li and H. Ma, Acc. Chem. Res., 2019, 52, 1892–1904 CrossRef CAS PubMed.
- J. Zhang, X. Chai, X. P. He, H. J. Kim, J. Yoon and H. Tian, Chem. Soc. Rev., 2019, 48, 683–722 RSC.
- G. Saranya, P. Anees, M. M. Joseph, K. K. Maiti and A. Ajayaghosh, Chem.–Eur. J., 2017, 23, 7191–7195 CrossRef CAS PubMed.
- S. Chakraborty, M. M. Joseph, S. Varughese, S. Ghosh, K. K. Maiti, A. Samanta and A. Ajayaghosh, Chem. Sci., 2020, 11, 12695–12700 RSC.
- P. Anees, S. Sreejith and A. Ajayaghosh, J. Am. Chem. Soc., 2014, 136, 13233–13239 CrossRef CAS PubMed.
- X. Gu, E. Zhao, J. W. Y. Lam, Q. Peng, Y. Xie, Y. Zhang, K. S. Wong, H. H. Y. Sung, I. D. Williams and B. Z. Tang, Adv. Mater., 2015, 27, 7093–7100 CrossRef CAS PubMed.
- J. Huang, J. Li, Y. Lyu, Q. Miao and K. Pu, Nat. Mater., 2019, 18, 1133–1143 CrossRef CAS PubMed.
- A. L. Antaris, H. Chen, S. Diao, Z. Ma, Z. Zhang, S. Zhu, J. Wang, A. X. Lozano, Q. Fan, L. Chew, M. Zhu, K. Cheng, X. Hong, H. Dai and Z. Cheng, Nat. Commun., 2017, 8, 15269 CrossRef CAS PubMed.
- R. Tian, Q. Zeng, S. Zhu, J. Lau, S. Chandra, R. Ertsey, K. S. Hettie, T. Teraphongphom, Z. Hu, G. Niu, D. O. Kiesewetter, H. Sun, X. Zhang, A. L. Antaris, B. R. Brooks and X. Chen, Sci. Adv., 2019, 5, eaaw0672 CrossRef CAS PubMed.
- P. Xing, Y. Niu, R. Mu, Z. Wang, D. Xie, H. Li, L. Dong and C. Wang, Nat. Commun., 2020, 11, 1573 CrossRef CAS PubMed.
- S. He, J. Song, J. Qu and Z. Cheng, Chem. Soc. Rev., 2018, 47, 4258–4278 RSC.
- Kenry, Y. Duan and B. Liu, Adv. Mater., 2018, 30, 1802394 CrossRef PubMed.
- D. Asanuma, Y. Takaoka, S. Namiki, K. Takikawa, M. Kamiya, T. Nagano, Y. Urano and K. Hirose, Angew. Chem., Int. Ed., 2014, 53, 6085–6089 CrossRef CAS PubMed.
- M. Martineau, A. Somasundaram, J. B. Grimm, T. D. Gruber, D. Choquet, J. W. Taraska, L. D. Lavis and D. Perrais, Nat. Commun., 2017, 8, 1412 CrossRef PubMed.
- H. Xu and D. Ren, Annu. Rev. Physiol., 2015, 77, 57–80 CrossRef CAS PubMed.
- A. L. Tappel, S. Shibko, M. Stein and J. P. Susz, J. Food Sci., 1965, 30, 498–503 CrossRef CAS.
- K. Leung, K. Chakraborty, A. Saminathan and Y. Krishnan, Nat. Nanotechnol., 2019, 14, 176–183 CrossRef CAS PubMed.
- X. Li, C. y. Kim, S. Lee, D. Lee, H.-M. Chung, G. Kim, S.-H. Heo, C. Kim, K.-S. Hong and J. Yoon, J. Am. Chem. Soc., 2017, 139, 10880–10886 CrossRef CAS PubMed.
- Y. Urano, D. Asanuma, Y. Hama, Y. Koyama, T. Barrett, M. Kamiya, T. Nagano, T. Watanabe, A. Hasegawa, P. L. Choyke and H. Kobayashi, Nat. Med., 2009, 15, 104–109 CrossRef CAS PubMed.
- T. Yoshii, K. Mizusawa, Y. Takaoka and I. Hamachi, J. Am. Chem. Soc., 2014, 136, 16635–16642 CrossRef CAS PubMed.
- T. Myochin, K. Kiyose, K. Hanaoka, H. Kojima, T. Terai and T. Nagano, J. Am. Chem. Soc., 2011, 133, 3401–3409 CrossRef CAS PubMed.
- S. Takahashi, Y. Kagami, K. Hanaoka, T. Terai, T. Komatsu, T. Ueno, M. Uchiyama, I. Koyama-Honda, N. Mizushima, T. Taguchi, H. Arai, T. Nagano and Y. Urano, J. Am. Chem. Soc., 2018, 140, 5925–5933 CrossRef CAS PubMed.
- E. D. Cosco, J. R. Caram, O. T. Bruns, D. Franke, R. A. Day, E. P. Farr, M. G. Bawendi and E. M. Sletten, Angew. Chem., Int. Ed., 2017, 56, 13126–13129 CrossRef CAS PubMed.
- S. Wang, Y. Fan, D. Li, C. Sun, Z. Lei, L. Lu, T. Wang and F. Zhang, Nat. Commun., 2019, 10, 1058 CrossRef PubMed.
- Z. R. Grabowski, K. Rotkiewicz and W. Rettig, Chem. Rev., 2003, 103, 3899–4032 CrossRef PubMed.
- Y. Hama, Y. Urano, Y. Koyama, M. Kamiya, M. Bernardo, R. S. Paik, I. S. Shin, C. H. Paik, P. L. Choyke and H. Kobayashi, Cancer Res., 2007, 67, 2791–2799 CrossRef CAS PubMed.
- M. Ogawa, N. Kosaka, P. L. Choyke and H. Kobayashi, Cancer Res., 2009, 69, 1268–1272 CrossRef CAS PubMed.
- Y. Hama, Y. Urano, Y. Koyama, A. J. Gunn, P. L. Choyke and H. Kobayashi, Clin. Cancer Res., 2007, 13, 6335–6343 CrossRef CAS PubMed.
- M. Kastantin, D. Missirlis, M. Black, B. Ananthanarayanan, D. Peters and M. Tirrell, J. Phys. Chem. B, 2010, 114, 12632–12640 CrossRef CAS PubMed.
- Y. Lu, Z. Yue, J. Xie, W. Wang, H. Zhu, E. Zhang and Z. Cao, Nat. Biomed. Eng., 2018, 2, 318–325 CrossRef CAS PubMed.
- P. Wang, Y. Fan, L. Lu, L. Liu, L. Fan, M. Zhao, Y. Xie, C. Xu and F. Zhang, Nat. Commun., 2018, 9, 2898 CrossRef PubMed.
- L. O. Ofori, N. P. Withana, T. R. Prestwood, M. Verdoes, J. J. Brady, M. M. Winslow, J. Sorger and M. Bogyo, ACS Chem. Biol., 2015, 10, 1977–1988 CrossRef CAS PubMed.
- S. Kim, Y. T. Lim, E. G. Soltesz, A. M. De Grand, J. Lee, A. Nakayama, J. A. Parker, T. Mihaljevic, R. G. Laurence, D. M. Dor, L. H. Cohn, M. G. Bawendi and J. V. Frangioni, Nat. Biotechnol., 2004, 22, 93–97 CrossRef CAS PubMed.
- N. Trinh, K. A. Jolliffe and E. J. New, Angew. Chem., Int. Ed., 2020, 59, 20290–20301 CrossRef CAS PubMed.
- L. Wu and X. Qu, Chem. Soc. Rev., 2015, 44, 2963–2997 RSC.
- L. Punzi, P. Galozzi, R. Luisetto, M. Favero, R. Ramonda, F. Oliviero and A. Scanu, RMD Open., 2016, 2, e000279 CrossRef PubMed.
- B. D. Furman, K. A. Kimmerling, R. D. Zura, R. M. Reilly, M. P. Zlowodzki, J. L. Huebner, V. B. Kraus, F. Guilak and S. A. Olson, Arthritis Rheumatol., 2015, 67, 1234–1239 CrossRef CAS PubMed.
- Z. Sheng, B. Guo, D. Hu, S. Xu, W. Wu, W. H. Liew, K. Yao, J. Jiang, C. Liu, H. Zheng and B. Liu, Adv. Mater., 2018, 30, 1800766 CrossRef PubMed.
- Y. Wang, K. Zhou, G. Huang, C. Hensley, X. Huang, X. Ma, T. Zhao, B. D. Sumer, R. J. DeBerardinis and J. Gao, Nat. Mater., 2014, 13, 204–212 CrossRef CAS PubMed.
- M. Montalti, L. Prodi, E. Rampazzo and N. Zaccheroni, Chem. Soc. Rev., 2014, 43, 4243–4268 RSC.
- F. Li, Y. Qiu, F. Xia, H. Sun, H. Liao, A. Xie, J. Lee, P. Lin, M. Wei, Y. Shao, B. Yang, Q. Weng and D. Ling, Nano Today, 2020, 35, 100925 CrossRef CAS.
Footnotes |
| † Electronic supplementary information (ESI) available. See DOI: 10.1039/d1sc02763h |
| ‡ Y. H., S. W., and P. Y. contributed equally to this work. |
| This journal is © The Royal Society of Chemistry 2021 |

![[thin space (1/6-em)]](https://www.rsc.org/images/entities/char_2009.gif) :
: