DOI:
10.1039/D0RA09586A
(Paper)
RSC Adv., 2021,
11, 2630-2642
Engineered Fe3 triangle for the rapid and selective removal of aromatic cationic pollutants: complexity is not a necessity†
Received
11th November 2020
, Accepted 26th November 2020
First published on 20th January 2021
Abstract
In this study, a low-cost oxo-bridged {Fe3} triangular cluster was constructed based on a benzoate ligand via slow evaporation. The cluster was thoroughly characterized by FTIR and UV-visible spectroscopy, TGA, and PXRD, and the exact structure was elucidated by single-crystal XRD. The formation of C–H⋯π and π–π interactions is responsible for the extra stability of {Fe3} clusters, which further enhances the dye adsorption property. The dye adsorption experiments performed on cationic [methylene blue (MB) and rhodamine-B (Rh-B)] as well as anionic [methyl orange (MO) and congo red (CR)] dyes revealed the ultimate selectivity of the present cluster towards the cationic ones. The {Fe3} cluster exclusively adsorbs the cationic dyes, i.e., MB and Rh-B even in the presence of anionic dyes, i.e., CR and MO. The extra stability, reusability and high efficiency of the {Fe3} molecular ensemble make it an attractive and fascinating material of importance. The kinetics analysis was evaluated employing different kinetics models. Furthermore, the plausible adsorption mechanism was also proposed, which suggests the interplay of cation–π and π–π interactions consolidating the efficient adsorption. Thus, the present work opens new doors for coordination chemists to further tune the structural features to modulate the adsorption/separation capacities of simple low-cost clusters for environmental protection for future efforts.
1. Introduction
Heydays, water pollution is proliferating due to widespread industrialization and improper planning of its waste consisting of aromatic hazards.1 Most industries dispose of the wastewater in their neighborhood areas of the cities, which is directly connected with several groundwater sources. The wastewater pollutants (specialties the aromatic ones) can easily enter the underground water, which, in turn, contaminates the surface water and consequently causes harm to the human health and environment.2–5 The area covered with hard rock water easily creates a shortcut route for water pollutant transport into the groundwater. In the last few years, a new problem has emerged in developing countries due to increased water pollutant concentrations from large industrial activities and human-made chemical products. Disruption of natural self-regulatory processes occurs due to the presence of the pollutants in the waterways. Most of the problems are being created due to some of the stable chemicals, which do not easily degrade in the living body and, hence, accumulate causing harm to organs. These stable chemicals are aromatic dyes,7 organic compounds,8 heavy metals,6 and compounds containing chlorine.9 Isolation of these organic pollutants from wastewater can increase the cost of drinking water. Alleviation of the dangerous side effects on human health is one of the most crucial things that scientists need to plan. Natural dyes are the major water pollutants harmful to the aquatic atmosphere.10 Dyes are mainly used in the textile industry, but large amounts of dyes are used for coloring various materials such as leather, food, plastic, and papers. Due to their complicated aromatic structure and xenobiotic basis, natural dyestuffs are highly stable and very difficult to degrade.11 Even negligible concentrations of such aromatic dyes could highly contaminate the drinking water.12 In the wastewater, the dye molecules undergo chemical and biological changes, which further decline the solubility of oxygen and destroy aquatic life also.13 All of the dyes are very dangerous and stable, and hence, they remain in the aquatic system, degrading water quality and human health.14 Hence, the elimination of these hazardous contaminants from the wastewater is essential, which is the need of the hour. There are various water purification methods such as photodegradation, ultrafiltration, coagulation, ozonation, and adsorption.15 Due to its high efficiency, easy handling, and economically better performance, the adsorption process has emerged as a new tool in recent times.16 Nevertheless, the adsorbent selection is quite difficult for practical use in adsorption technology.17 Nowadays, adsorbents including clay material, zeolite, biomass, and activated carbon are explored by various researchers for dye removal.18–20 However, these adsorbents have low adsorption capacity, and hence, they are difficult to separate. Moreover, these adsorbents lack specific adsorption for the target dye. The coordination complexes are crystalline materials that consist of metal ions/clusters linked via various non-covalent interactions with organic ligands.21 The coordination clusters have wide applications in the field of gas adsorption and storage,22 chemical sensing,23 drug delivery,24 adsorption,25 pollutant elimination,26 and catalysis.27 The MOF materials have been exploited for the adsorption and separation of hazardous contaminants including dyes from wastewater. Jhung et al. exploited MIL-101 and MIL-53 for the removal of methyl orange (MO) from wastewater.28 After this, several researchers have been striving hard in this area using MOF materials to eliminate various hazardous dyes present in water. They have employed MOF materials of different metal ions such as aluminum,29 chromium30,31 iron32,33 cobalt34 nickel35 copper36 and zirconium37 for the purpose. It has been established that MOFs can be utilized in dye removal applications with different interactions possible between MOF and dye38 with the oxo-bridged metal. Clusters containing carboxylates as bridging ligands have been of great interest over the years owing to their applications in the field of homogenous catalysis due to their variety of oxidation reactions in the industry39–41 The oxo bridge trinuclear iron complexes are also exploited for mimicking transition metals for biological activities.42 These clusters have essential building blocks for higher nuclear species, which lead to the construction of an extended lattice in the solid state as well as biological materials, e.g., ferritins. Hence, these oxo-bridged iron clusters tend to form various mixed metal or mixed cluster complexes, which were then studied for the magnetic interactions between these metal ions of definite geometry.43–47 MOF-235 was formulated as {[Fe3O(1,4-BDC)3(DMF)3][FeCl4]−(DMF)3}, which is an orange color hexagonal crystal synthesized from organic ligand benzenetricarboxylate linked to oxo-bridged trinuclear Fe(III) clusters.48 MOF-235 came out to be very stable with many electron-deficient groups in its structure and was employed for the adsorption study. Its various electron-deficient groups present in the skeleton form strong hydrophobic interactions and hence serve as a better adsorbent for dye removal. However, the research in the field of stable and discrete coordination complexes serving as better adsorbents is scarcely explored. Due to various non-covalent interactions and the structure tunability, the coordination complexes can also be exploited for their dye adsorption property of the desired dye, i.e., cationic or anionic.49 Considering the area of oxo-bridged clusters, their adsorption property is untouched by the researchers. In this manuscript, we have synthesized a trinuclear Fe(III) complex built by carboxylate groups. The {Fe3} cluster was employed to understand the dye adsorption capacity in detail. The {Fe3} cluster was synthesized in excellent yields by a slow evaporation method. Various spectral studies further thoroughly characterized the cluster, and with the help of a single-crystal X-ray technique, the exact structure of {Fe3} was elucidated. The molecular formula of the cluster is [Fe3(μ-O)(2Me-ba)6(H2O)(CH3OH)2], which has six benzoate ligands bridged between three Fe(III) centers. The beauty of structure is that one oxygen of the carboxylate ligand forms a bridge between three iron(III) atoms. The {Fe3} cluster exhibits excellent adsorption property, which selectively adsorbs the cationic dyes in the wastewater due to cation–π and π–π interactions between the aromatic rings of the adsorbent and adsorbates and electrostatic interaction between the two. Further, the adsorption process was screened from different parameters such as pH, temperature, and contact time of the reaction. Therefore, the structural tuning of the metal clusters or cages can lead to the designing of new class of materials based on different metal ions for the adsorption of organic pollutants from wastewater.
2. Experimental protocols
2.1. Materials and method
All the experiments were performed under ambient conditions. The chemical 2-methoxy benzoic acid was commercially available and purchased from Sigma Aldrich. Anhydrous ferric chloride was purchased from Merck. All the reagents used in the experimental work were of reagent grade and used without further purification.
2.2 Instrumentation
FTIR spectroscopy of the solid sample of {Fe3} was performed using a PerkinElmer Spectrum GX spectrophotometer with KBr pellets in the wavelength range of 4000–400 cm−1. The melting point of the {Fe3} cluster was determined by an open capillary method. The carbon, hydrogen, and nitrogen (C, H, N) analysis was performed at CDRI, Lucknow, India, in Micro-Analytical Laboratory. The electronic spectra were recorded using a PerkinElmer λ-45 UV-visible spectrophotometer. Cuvettes with a path length of 1 cm containing 10−3 M solution in methanol were used in the spectrophotometer. The bulk purity was checked with the PXRD pattern obtained using a Miniflexll X-ray diffractometer with Cu-Kα radiation. The thermal study was conducted using a TGA-50H instrument (temperature range 25–800 °C, heating rate 20 °C min−1).
2.3 X-ray crystal structure determination
Single-crystal XRD analysis of the {Fe3} crystal was performed at 100 K employing a Bruker SMART APEX CCD diffractometer. The data were monitored using graphite monochromated Mo-Kα radiation with λ = 0.71073 Å. The data reduction with integration was done using SAINT. The empirical absorption adjustment was made using SADABS, and the space group was determined using XPREP. Bond length parameters were fixed by DIFX commands. The structure of the solution was studied employing SHELXL-2016/6 and refinement was accomplished on F2 (full matrix least squares) using SHELXL-2016/6.50–53 Anisotropic displacement parameters were adopted for refining H atoms. Table 1 illustrates the crystal data and refinement parameters for {Fe3}. The CCDC reference number for {Fe3} is 1953448.
Table 1 Selected crystallographic parameters for {Fe3}
| Empirical formula |
C50H52Fe3O22 |
| Formula weight |
1172.49 |
| Crystal color |
Red |
| Temperature/K |
100(2) |
| Crystal system |
Monoclinic |
| Space group |
C2/c |
| a/Å |
12.0171(3) |
| b/Å |
21.5310(7) |
| c/Å |
20.7417(5) |
| α/° |
90 |
| β/° |
92.5590(10) |
| γ/° |
90 |
| Volume/Å3 |
5361.4(3) |
| Z |
4 |
| ρcalc (g cm−3) |
1.4525 |
| μ/mm−1 |
0.880 |
| F(000) |
2429.6984 |
| Crystal size/mm3 |
0.38 |
| Radiation |
Mo K\α |
| Independent reflections |
41![[thin space (1/6-em)]](https://www.rsc.org/images/entities/char_2009.gif) 020 020 |
| wR2(all) |
0.0792 |
| wR2 |
0.0749 |
| Final R indexes [I ≧ 2σ (I)] |
0.0316 |
| Final R indexes [all data] |
0.0371 |
| θmin |
2.73 |
| θmax |
25.05 |
| GOF |
1.0608 |
2.4 Protocol for adsorption of organic pollutants
The adsorption of organic pollutants under investigation (dye molecules) onto the surface of the cluster was evaluated by conducting an adsorption experiment under ambient conditions. The stock solution was prepared for various organic pollutants (10 mg L−1) such as methylene blue (MB), methyl orange (MO), rhodamine B (Rh-B), and congo red (CR) in double-distilled water. In this way, we prepared a 10 ppm solution of dyes in water. The pH of the solution of dyes was normalized with 0.1 N NaOH and 0.1 N HCl. In an experimental setup, 25 mg of orange color crystals were added into 75 mL of aqueous solution of dyes in a round-bottom flask. The mixture was then continuously stirred at 25 °C for further few hours. After that, 3 mL of suspension was taken out from the round-bottom flask at regular intervals and subsequently centrifuged for a few minutes. The solutions were then observed using a UV-vis spectrophotometer to check the concentration by monitoring the characteristics of the absorption peak. Furthermore, the adsorption capacity qt (mg g−1) can be calculated using eqn (1):1| |
 | (1) |
where C0 is the initial concentration of dye and Ct is the final concentration of dye at a definite time (t), m is the weight of {Fe3} and V is the volume of dye taken out in the reaction. The pH effect on the adsorption process was performed under ambient conditions with the same dose of adsorbents at different times. The dilution of the sample was done with distilled water if the concentration values exceeded the maximum adsorption limit of calibration curve. The recyclability of {Fe3} is an important parameter for its application point of view and material importance. After completing the first adsorption cycle, the adsorbent was centrifuged for a few minutes and then wiped delicately by ethanol until no dye was observed on the surface of the cluster.
2.5 Crystal growth of [Fe3(μ-O)(2Me-ba)6(H2O)(CH3OH)2] {Fe3}
The synthetic procedure of {Fe3} is quite simple and economic, which adopts ambient conditions. First, 2 mmol of 2-methoxy benzoic acid was taken in a round-bottom flask along with 10 mL of methanol. Then, 2 mmol of FeCl3 in 5 mL methanol was added. After a few minutes, 1 mmol of NaOH in 5 mL water was added to the mixture, which provided the basic reaction condition (Fig. 1). The whole mixture was stirred overnight, and the red color clear solution obtained was kept in a beaker for slow evaporation. Orange colored beautiful single crystals were obtained after 2 days, which were suitable for X-ray analysis.
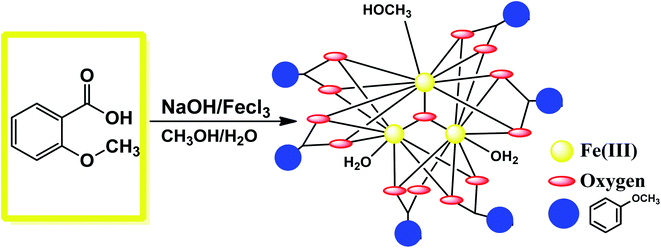 |
| | Fig. 1 Synthetic route for the formation of {Fe3}. | |
Yield: 52%, mp 305 °C, anal. calcd (%) for C50H52Fe3O22: C 51.58, H 4.67; observed: C 51.37, H 4.72. IR (KBr, cm−1): 3453br, 1622s, 1364s, 1027m, 540m and 455m.
3. Results and discussion
3.1 Synthetic approach
The synthetic strategy involves exploring the coordination chemistry of a new iron cluster for its adsorption property. In the synthetic protocols, we aimed to synthesize an iron(III)-based cluster by employing the easily available bench chemicals 2-methoxy benzoic acid (2-Meba), NaOH, and FeCl3. The object of the target molecule was to synthesize it with low-cost chemicals for environmentally friendly applications. The reaction was carried out in a basic medium by the slow evaporation method to isolate {Fe3}. For understanding the adsorption process by MOFs or clusters, we designed the eco-friendly cluster to explore its adsorption of dye. The MOF MIL-235, which is an oxo-bridge Fe3 entity formulated as {[Fe3O(1,4-BDC)3(DMF)3][FeCl4]−(DMF)3}, is an orange color hexagonal crystal previously synthesized from the organic ligand benzenetricarboxylate linked to oxo-bridge trinuclear Fe(III) clusters.48 MOF-235 came out to be very stable containing many electron-deficient groups in its structure, and it was therefore employed for the adsorption study. Inspired by the fascinating features of MOF-235, in this study we designed a low-cost {Fe3} cluster by a slow evaporation method, which was characterized using various spectroscopic tools. The exact structure of {Fe3} was elucidated applying single-crystal X-ray technique that reveals the molecular structure of the cluster to be [Fe3(μ3-O)(2Me-ba)6(H2O)(CH3OH)2]. The designed cluster was then exploited for its use in the separation of dyes and thus purification of wastewater. Only a few reports are there in the literature in which metal clusters or cages could be used for the selective adsorption of dyes.54
3.2 Structure of [Fe3(μ3-O)(2Me-ba)6(H2O)(CH3OH)2]
The balls-stick and wireframe representation of {Fe3} is shown in Fig. 2a and b. The crystallographic data parameters are given in Table 1, and the bond distances and angles are given in Table S1† ESI. The {Fe3} cluster is a trinuclear Fe(III) complex that is formed via the reaction of 2-methoxy benzoic acid with the FeCl3 salt in the mixed solvent of MeOH/H2O. The {Fe3} cluster is having a monoclinic system with a C2/c space group. The molecular formula of {Fe3} using SC-XRD data has been deduced to be [Fe3(μ-O)(2Me-ba)6(H2O)(CH3OH)2], in which six 2-methoxy benzoic acid ligands bind with three Fe(III) atoms. The oxo-bridged complex also has one water and two methanol moieties coordinated to three Fe(III) atoms. The trinuclear complex has three Fe(III) atoms positioned at the corners of equilateral triangle. The coordination environment around each iron atom is satisfied by oxygen donor sites. All the iron centres are six-coordinated with a distorted octahedral geometry. The five coordination sites around each iron atom are satisfied by an oxygen donor site of carboxylate ligands, and the remaining coordination sphere is fulfilled by water or methanol ligand. The three Fe(III) atoms are not bonded directly but bridged with the oxygen atom, which is trapped between the three Fe(III) centres. The non-bonded Fe(III) ions have a bond distance ranging between 3.283 and 3.294 Å. The oxygen atom is situated at the center of the trinuclear system of three iron centres with a bond distance ranging from 1.895 Å to 1.899 Å. The oxygen atom bridges as μ3 perfectly between three iron atoms with bond angles varying from 119.86° to 120.29°, which almost resemble the angles of the equilateral triangle (Fig. 2c).
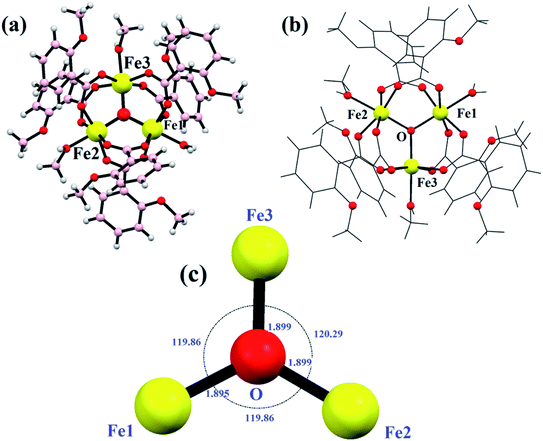 |
| | Fig. 2 Ball and stick model (a), wireframe structure (b) and the triangle supported by μ3-O (c) in {Fe3}. | |
Every pair of an iron atom is a bridge between two carboxylate ligands and one water or methanol ligand. These bridging carboxylate ligand patterns follow all the iron atoms providing the symmetry in the structure. First of all, Christou et al. reported an iron complex with Fe–Fe bond lengths of 3.253–3.372 Å, similarly bridged by the same two carboxylate ligands.55,56 The distances between two iron atoms are comparable to our bond distances, i.e., 3.283–3.294 Å. In some other reports of other trinuclear [Fe3O]7+ cores, the structure does not show the symmetry between the oxo-bridged iron(III) complexes, and the bond distances range between 1.8 and 2.0 Å.57–60 All the six coordination spheres of each iron atom are occupied by the oxygen atom of the carboxylate ligand and water or methanol solvents. The Fe–O distance between the iron and solvent is in the range of 2.060 Å to 2.078 Å. These values are quite similar to the previously reported structures like [Fe3O(CH3COO)6(H2O)3]NO3·4H2O and with some deviation from the Fe2(SO4)3·9H2O and Fe(NO3)3·9H2O complexes.59 The trinuclear iron complex results in an equilateral triangle and T-shaped structure. Moreover, various kinds of non-covalent interactions such as H-bonding, π–π interactions, and C–H–π interactions enable the formation of a supramolecular architecture in the {Fe3} cluster. The formation of H-bonding from the benzoate oxygen atom of one ligand to the H atom of other moieties of the benzoate ligand led to the formation of a supramolecular chain (Fig. 3a). In the same way, π–π interactions and C–H–π are also formed in the {Fe3} cluster, which provide extra stability and robustness to the complex (Fig. 3b). The π–π interaction was found between the benzoate moieties, which again lead to the formation of a 2-D supramolecular sheet. The C–H–π contacts also exist in the framework, which lead to the formation of a zig-zag chain.
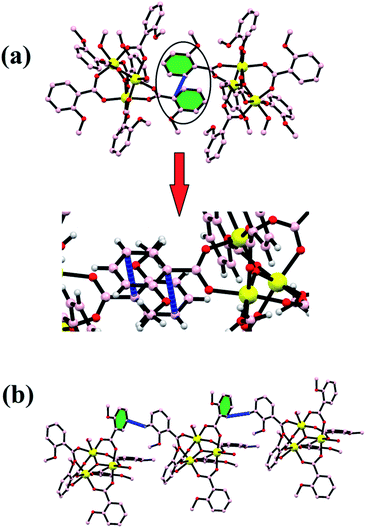 |
| | Fig. 3 Stability in the {Fe3} cluster due to π–π (a) and C–H⋯π (b) interactions. | |
All these non-covalent interactions provide extra stability to the complex, and the complex is thus quite robust in nature and therefore can further be employed in the high-temperature industrial applications. Various overall non-covalent interactions lead to the formation of a 3-D supramolecular network (Fig. 4).
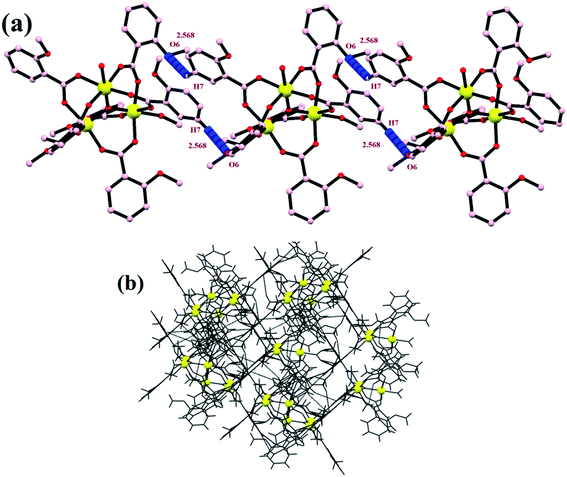 |
| | Fig. 4 (a) A 1-D zig-zag chain and (b) a supramolecular network formed by non-covalent interactions. | |
3.3 FTIR, PXRD and TG analysis of the {Fe3} cluster
The FTIR spectroscopy is a technique that provides ample information regarding the binding modes of the ligand with the central metal ion. The FTIR spectrum was obtained in the fingerprint as well as the functional group region. The FTIR spectrum corroborates the single-crystal X-ray information about the {Fe3} cluster. The FTIR spectrum shows the broad and sharp peaks at 3480 to 3390 cm−1, which could be attributed to the vibration of the water molecule coordinated to one of the iron atoms in the {Fe3} unit (Fig. S1† ESI). The band near 1600 cm−1 for the C![[double bond, length as m-dash]](https://www.rsc.org/images/entities/char_e001.gif) O band (in free ligand) disappears during the formation of {Fe3}, which authenticates the complexation of ligand. The spectrum of the {Fe3} cluster further shows strong bands at 1622 and 1364 cm−1, which are characteristic of the νassym(COOO−) and νsymm (COOO−) vibrations of any carboxylate ligand (Fig. S2† ESI). These frequencies give ample information about the benzoate binding mode with the Fe(III) atom. The difference between the νassym(COOO−) and νsymm(COOO−), which is designed as Δν is the value that provides information about the binding mode of the carboxylate ligand. In the present {Fe3} cluster, the difference, Δν = 258 cm−1, supports the said mode of bonding of benzoate. The band near 705 cm−1 is assigned to the C–H bond in the aromatic ring. The band at 1027 cm−1 is visible in the FTIR spectra, which may be due to the ν(C–O) vibration present in the benzoate moieties. The medium intensity bands 546 and 455 are due to the coordinate bond of Fe with various benzoate oxygen donors.61 The new sharp band at 596 cm−1 can be due to the formation of iron and the μ3-O atom.62,63 These data are quite informative and further corroborate the single-crystal data. The PXRD pattern of the as-synthesized cluster was performed on the crystalline powder sample of {Fe3}. The simulated pattern was obtained from the single-crystal data using the MERCURY software. It was seen from Fig. 5a that the two PXRD patterns are quite identical, which support the bulk integrity of the {Fe3} cluster. The thermal effect on the {Fe3} cluster was analyzed from the TG data. The TG data revealed that the {Fe3} cluster was relatively stable up to 300 °C, which may be due to the various non-covalent bonds present in the {Fe3} cluster. The π–π and C–H⋯π interactions provide extra stability to the {Fe3} cluster. The TG analysis of the {Fe3} cluster shows the two-step fragmentation in its structure, where the first step involves the elimination of coordinated water and methanol ligands. In contrast, the second step involves the disintegration of six benzoate ligands. In the first step, the TG reveals the fragmentation with 5.43% weight loss (Calc. 5.80%) at a temperature in the range of 25–120 °C, which may be due to coordinated water and methanol ligands (Fig. 5b). Then, the {Fe3} cluster becomes robust, which shows a flat curve up to 280 °C, after which it shows the removal of six benzoate ligands in the temperature range of 300 °C to 400 °C with a weight loss of 64.08% (Calc. 64.89%). Then, the {Fe3} cluster does not show any changes up to 600 °C and the final product left in the {Fe3} cluster may be oxides or carbon residues, which is consistent with the previous report.64 Because of the extra stability of the {Fe3} cluster, it can be used in high-temperature applications.
O band (in free ligand) disappears during the formation of {Fe3}, which authenticates the complexation of ligand. The spectrum of the {Fe3} cluster further shows strong bands at 1622 and 1364 cm−1, which are characteristic of the νassym(COOO−) and νsymm (COOO−) vibrations of any carboxylate ligand (Fig. S2† ESI). These frequencies give ample information about the benzoate binding mode with the Fe(III) atom. The difference between the νassym(COOO−) and νsymm(COOO−), which is designed as Δν is the value that provides information about the binding mode of the carboxylate ligand. In the present {Fe3} cluster, the difference, Δν = 258 cm−1, supports the said mode of bonding of benzoate. The band near 705 cm−1 is assigned to the C–H bond in the aromatic ring. The band at 1027 cm−1 is visible in the FTIR spectra, which may be due to the ν(C–O) vibration present in the benzoate moieties. The medium intensity bands 546 and 455 are due to the coordinate bond of Fe with various benzoate oxygen donors.61 The new sharp band at 596 cm−1 can be due to the formation of iron and the μ3-O atom.62,63 These data are quite informative and further corroborate the single-crystal data. The PXRD pattern of the as-synthesized cluster was performed on the crystalline powder sample of {Fe3}. The simulated pattern was obtained from the single-crystal data using the MERCURY software. It was seen from Fig. 5a that the two PXRD patterns are quite identical, which support the bulk integrity of the {Fe3} cluster. The thermal effect on the {Fe3} cluster was analyzed from the TG data. The TG data revealed that the {Fe3} cluster was relatively stable up to 300 °C, which may be due to the various non-covalent bonds present in the {Fe3} cluster. The π–π and C–H⋯π interactions provide extra stability to the {Fe3} cluster. The TG analysis of the {Fe3} cluster shows the two-step fragmentation in its structure, where the first step involves the elimination of coordinated water and methanol ligands. In contrast, the second step involves the disintegration of six benzoate ligands. In the first step, the TG reveals the fragmentation with 5.43% weight loss (Calc. 5.80%) at a temperature in the range of 25–120 °C, which may be due to coordinated water and methanol ligands (Fig. 5b). Then, the {Fe3} cluster becomes robust, which shows a flat curve up to 280 °C, after which it shows the removal of six benzoate ligands in the temperature range of 300 °C to 400 °C with a weight loss of 64.08% (Calc. 64.89%). Then, the {Fe3} cluster does not show any changes up to 600 °C and the final product left in the {Fe3} cluster may be oxides or carbon residues, which is consistent with the previous report.64 Because of the extra stability of the {Fe3} cluster, it can be used in high-temperature applications.
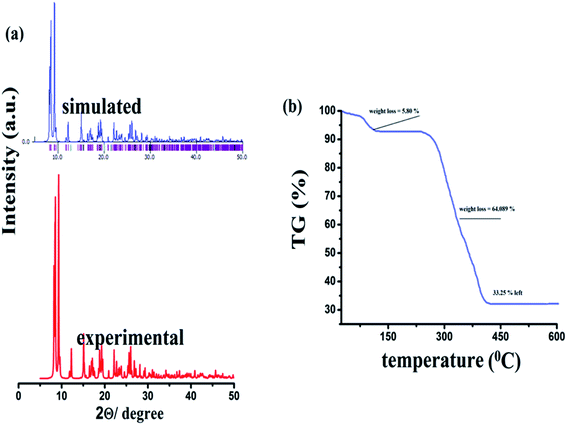 |
| | Fig. 5 PXRD pattern (a) and TG analysis (b) of the {Fe3} cluster. | |
3.4 Adsorption of organic dyes
Organic pollutants are the main ingredients of sewage from a variety of chemical industries. Nearly 700![[thin space (1/6-em)]](https://www.rsc.org/images/entities/char_2009.gif) 000 tons of dyes are used in the world by the textile industry, which is among the top three pollutants. Almost every dye is dangerous and has a high risk of carcinogenic mutations.65 Due to its environmentally friendly nature and cost-effectiveness, the adsorption process is applied nowadays to remove dye molecules from wastewater.66 Due to its easy construction method and low-cost constituents, the {Fe3} cluster was engaged for the adsorption and removal of hazardous dyes from wastewater. In the experiment, we chose four different dyes, i.e., MB, MO, Rh-B, and CR with different charges and sizes (Fig. 6).67
000 tons of dyes are used in the world by the textile industry, which is among the top three pollutants. Almost every dye is dangerous and has a high risk of carcinogenic mutations.65 Due to its environmentally friendly nature and cost-effectiveness, the adsorption process is applied nowadays to remove dye molecules from wastewater.66 Due to its easy construction method and low-cost constituents, the {Fe3} cluster was engaged for the adsorption and removal of hazardous dyes from wastewater. In the experiment, we chose four different dyes, i.e., MB, MO, Rh-B, and CR with different charges and sizes (Fig. 6).67
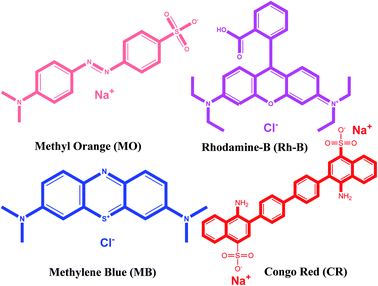 |
| | Fig. 6 Chemical structures of cationic and anionic dyes used in the present work. | |
In a setup, 25 mg of orange color crystals were added into 75 mL of aqueous dye solution in a round-bottom flask, and the reaction mixture was continuously stirred. Subsequently, 3 mL of aliquot was taken out from the round-bottom flask and centrifuged for a few minutes. After that, the different set of the solution was monitored by UV-vis spectroscopy. The characteristic peak of the dye solution was monitored to understand their concentration. The electronic spectra revealed that the cluster possesses good adsorption capability towards all the cationic dye. The dye adsorption percentage was calculated using eqn (2):68
| | |
Efficiency (%) = [(C0 − Ct)/C0] × 100%
| (2) |
where
C0 and
Ct are the initial and final concentrations of the dyes expressed in mg L
−1.
Fig. 7 illustrates that the cationic dyes show drastic changes in their concentration, while the adsorption of anionic dye does not show appreciable changes in their respective concentrations. The characteristic absorption peaks of MB (664 nm) and Rh-B (553 nm) decreases with the increasing time. The rapid adsorption of cationic dyes occurs at this moment, and in only 60 min, 67.23% of MB and 48.43% of Rh-B dyes were adsorbed onto the surface of the cluster. The adsorption process takes place for 270 min, and after that, the dye molecules resist to adsorb onto the surface of the {Fe
3} cluster. After 270 min, 92.16% of MB and 79.1% of Rh-B were adsorbed, which is the saturation point of the {Fe
3} cluster. We have further extended our adsorption experiment for 12 h, but no adsorption occurred after 270 min. It can be established very quickly that the rapid adsorption occurs at the starting of the reaction due to cation–π and π–π interactions. In only 150 min, MB adsorbed 83.61% of dye and Rh-B adsorbed 71.8% of dye molecules, and MB and Rh-B's characteristic colors started to decolorize becoming transparent. After 270 min, the crystal color of the {Fe
3} cluster changes completely from orange to brown in case of MB and pinkish in case of Rh-B adsorption. From the adsorption capacity equation, we calculated the adsorption of MB and Rh-B by the {Fe
3} cluster adsorbent, which were 67.27 and 58.22 mg g
−1, respectively.
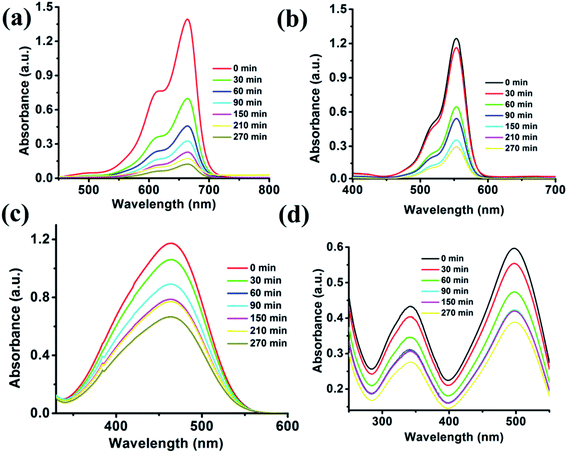 |
| | Fig. 7 Adsorption titration plots of organic dyes i.e., MB (a), Rh-B (b), MO (c) and CR (d) recorded on a UV-visible spectrophotometer using the {Fe3} cluster as the adsorbent. | |
3.5 Separation of organic dyes
From an application point of view, the selective adsorption of specific dye is challenging for an environmental chemist. The {Fe3} cluster efficiently adsorbs the cationic dye, so in an extension of our work, we further checked whether the {Fe3} cluster can selectively adsorb the cationic dye or not. We performed an independent experiment in the wastewater, where we have mixed two different dyes for investigations. The {Fe3} cluster effectively adsorbs the cationic dyes such as MB and Rh-B in the presence of MO and CR, as evident from Fig. 8.
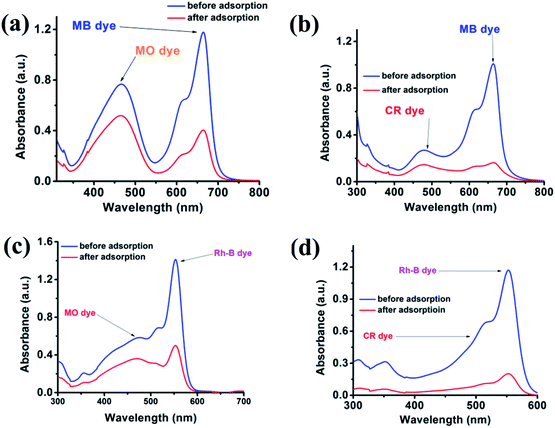 |
| | Fig. 8 Adsorption plots of MB (a and b) and Rh-B (c and d) in the presence of MO and CR using the {Fe3} cluster as the adsorbent. | |
Furthermore, we also performed the adsorption of any single cationic dye even in the presence of two anionic dyes. Fig. 9 demonstrates that the cluster can easily adsorb cationic dye in the presence of any anionic dyes. In this way, we can say that the {Fe3} cluster not only adsorbed the cationic dye but also selectively separated the dye from the mixture of anionic and cationic dye solutions. This selective adsorption process is somehow typical in the MOF or cluster; however, this becomes first report for a discrete {Fe3} cluster.
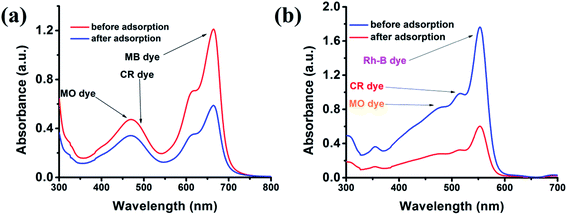 |
| | Fig. 9 Adsorption plots of MB (a) and Rh-B (b) in the presence of CR and MO dyes. | |
3.6 Recyclability of the {Fe3} adsorbent
From its material importance, the reusability of the {Fe3} cluster is a crucial task. After completing the adsorption process, we removed the crystals and performed a separate stirring reaction of the crystal in a small amount of ethanol. The reaction occurred for a few hours until no amount of MB was found on the orange color {Fe3} cluster. Then, the crystals were delicately washed with water and dried in air and in an electric oven for 30 min. After that, the {Fe3} cluster can be reused for further adsorption processes. For the second and third cycles, the adsorption capacity of the {Fe3} cluster decreases due to the little solubility of the {Fe3} cluster in water, but it can be used for at least three times with better adsorption capacity (Fig. 10a).69 The PXRD pattern was performed on the adsorbent after the completion of the first adsorption cycle, which suggests that no evidence of breaking of the framework of {Fe3} take place during the adsorption process (Fig. S3† ESI).
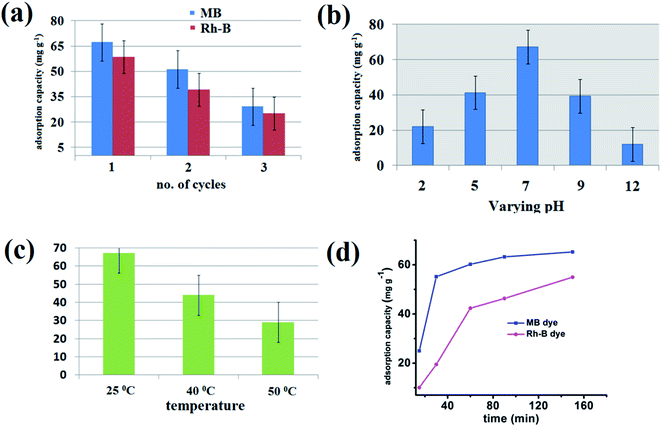 |
| | Fig. 10 Recyclability graph of the adsorbent (a), graph for the effect of pH (b), graph for the effect of temperature (c) and the plot showing effect of contact time (d) on the adsorption process. | |
3.7 Effect of pH on the adsorption process
For an adsorption process, the pH of the reaction is an essential parameter from its application point of view. The pH can easily affect the charge on the adsorbent, degree of ionization of dye molecules, and dyes' structure. For this aim in our mind, we first checked the PXRD data at different pH values from 2 to 12, which revealed that the {Fe3} cluster is quite stable at different pH values (Fig. S4† ESI). The pH of the adsorption reaction should be kept constant throughout the process; for this purpose, first, you have to know that optimum pH at which your adsorbent shows the highest adsorption capacity. For this purpose, we have performed an adsorption experiment at different pH values ranging from 2 to 12 using 0.1 N HCl and 0.1 N NaOH. All the cationic dyes showed a similar pattern at different pH values of the reaction. At a lower pH value, i.e., at pH = 2, the adsorption capacity reduces as the H+ ion of acid competes with the cationic part of the dye molecules. Therefore, at a very low pH value, the adsorption capacity is lower and increases with the increase in pH. The adsorption capacity is highest at pH = 7 due to the neutral medium of the reaction. When we increase the pH from its neutral value, the adsorption capacity decreases due to the negative part of the dye that can quickly form a salt with NaOH, and the adsorption capacity decreases significantly. Therefore, it is clear from Fig. 10b that the optimum pH of the reaction is 7, where the highest amount of dye adsorption by the {Fe3} cluster occurs. At pH 2, the adsorption capacity is 22.1 mg g−1 in the case of MB, which increases at pH = 5. The adsorption capacity, however, in the case of MB at neutral pH is 67.27 mg g−1, which is higher than different media. Moreover, at a higher pH value, again the adsorption capacity of MB decreases and at pH 12, the adsorption capacity is reported to be only 12.01 mg g−1.70
3.8 Effect of temperature on the adsorption process
The adsorption process was further assessed at different temperatures ranging from 25 °C to 50 °C to understand the thermal effect on adsorption. As shown in Fig. 10c, the adsorption of MB at ambient temperature, i.e., at 25 °C, is highest and as we increase the temperature from 25 °C to 50 °C, the adsorption capacity of the {Fe3} cluster decreases significantly. At 25 °C, the adsorption capacity is 67.27 mg L−1, whereas at 40 °C, it decreases to 43.98 mg L−1. With the further increment in the temperature, the adsorption capacity decreases significantly, which suggested that the adsorption process follows an exothermal reaction.71
3.9 Effect of contact time on the adsorption process
The contact time is also an essential parameter for assessing the organic pollutants' adsorption process from aqueous solutions. As shown in Fig. 10d, at the starting of a reaction, the adsorption process took place very rapidly. Within 30 min, 55.16 mg g−1 of MB and 19.5 mg g−1 of Rh-B dye got adsorbed by the {Fe3} cluster. After reaching a saturation point or when the equilibrium was reached, the adsorption process got slow. It is established here that in case of all the cationic dyes, the equilibrium was reached within 90 min of the reaction. This rapid adsorption process may be due to the starting of the reaction; there were various sites available in the {Fe3} cluster to accommodate the cationic dyes, but after few minutes, when these vacant sites began to occupy, the adsorption process got slow. After 270 min, the {Fe3} cluster resisted adsorbing any further amount, and the adsorption efficiency hence decreased.72
3.10 Adsorption kinetics
As we have witnessed, the {Fe3} cluster adsorbed significant amount of cationic dye on its surface, forcing us to perform the reactions' kinetics. To explore the kinetic study of the reaction, the adsorption process was observed with the increase in time. Three different kinds of kinetic models were employed to understand the kinetics of the adsorption process: pseudo-first-order, pseudo-second-order, and intraparticle diffusion models73 and the calculated kinetic parameters are given in Table 2.
Table 2 Parameters for different kinetic models of adsorption studies of MB and Rh-B
| Model |
Parameters |
MB |
Rh-B |
| Pseudo-first-order |
K1 (min−1) |
0.0057 |
0.0156 |
| qe (cal.) (mg g−1) |
7.94 |
46.55 |
| qe (exp.) (mg g−1) |
67.27 |
58.52 |
| R2 |
|
0.94 |
| Pseudo-second-order |
K2 (g mg−1 min−1) |
0.00179 |
0.0005 |
| qe (cal.) (mg g−1) |
69.44 |
61.66 |
| qe (exp.) (mg g−1) |
67.27 |
58.52 |
| R2 |
0.999 |
0.998 |
| Intraparticle diffusion |
K3 (mg g−1 min−1/2) |
1.024 |
3.03 |
| C |
51.64 |
12.84 |
| R2 |
0.8635 |
0.74 |
Pseudo-first-order equation:
where
qe is the adsorption capacity at equilibrium,
qt is the equilibrium capacity at different time points
t, and
k1 is the pseudo-first-order rate constant of the reaction. The rate constant was calculated employing the rate equation,
i.e., from the slop between log(
qe −
qt) and time. The rate constant is quite comparable to the results reported in the literature, but the values of
R2 are inconsistent from the graph. Moreover, the experimental and calculated adsorption capacity values are quite different from each other, which authenticate this model's inapplicability from the adsorption data.
Pseudo-second-order rate equation:
| |
 | (3) |
Again k2 is the rate constant of the pseudo-second-order reaction, which is calculated from the graph between t/qt and different time intervals. The pseudo-second-order plot shows excellent linearity in its pattern, and the value of the correlation coefficient is very close to zero. Moreover, the values of calculated and experimental adsorption capacities are quite similar. Therefore, this model is suitable for showing the adsorption of organic dyes.
Intra particle diffusion equation:
where
qt is the adsorption capacity at a definite time,
k3 is the rate constant for the intraparticle model, and
C is the intercept calculated from the graph between
qt and
t1/2. The inconsistency in the calculated and experimental values of adsorption capacities suggests that this model is not suitable for cationic dye adsorption kinetics (
Fig. 11).
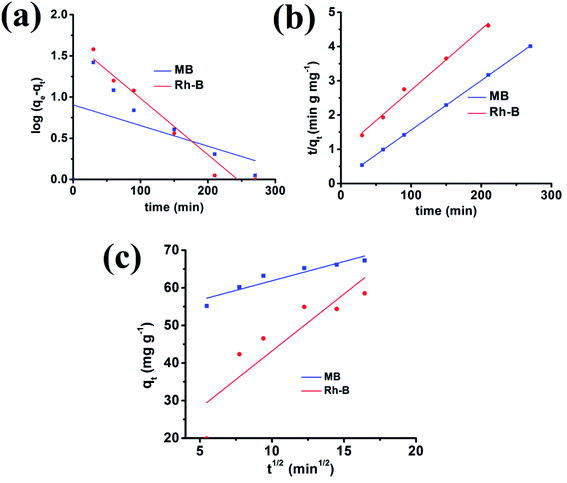 |
| | Fig. 11 Adsorption of MB and Rh-B onto the {Fe3} cluster using pseudo-first-order (a), pseudo-second-order (b) and intra-particle (c) kinetics models. | |
3.11 Adsorption mechanism
At a discrete level, the electrostatic, non-covalent, and van der Waals interactions play a key role in binding the dye with either free functionalize groups or available Lewis acid/base sites in the cluster.54 It is a well-known fact that the adsorption is a surface phenomenon, and it largely depends on the structural and functional behavior of the adsorbent, size, and shape of the adsorbate, and surface characteristics of the adsorbent. There are various possible mechanisms reported in the literature for the adsorption process, i.e., acid–base interactions, electrostatic interactions, π–π interactions, hydrogen bonding, and ion-exchange mechanism. From the structure of the {Fe3} cluster, it can be seen that there is a possibility of cation–π, π–π, and electrostatic interactions. In the case of the {Fe3} cluster, the presence of the benzoate ring's nucleophilic nature interacts with the cationic part of the dye, which forces the strong electrostatic interaction between the benzoate ring and cationic dyes. Furthermore, the aromatic ring of the benzoate ligand provides the strong π–π interactions between the {Fe3} cluster and the organic dye, which smoothly adsorb the dye on the surface of {Fe3} clusters. Therefore, we can say that the adsorption process in the case of the {Fe3} cluster is due to various electrostatic interactions and π–π interactions (Fig. 12). One more rationale that could be assumed for the rapid adsorption process might be the structural feature of the dye, i.e., linearity and the charge of the cationic dye. Thus, we can say that apart from all the interactions, the linear molecules of dyes can be readily adsorbed on the surface of {Fe3} clusters, which is quite similar to the previous report.74 Moreover, the oppositely charged (cationic) dyes interacted towards the nucleophilic center of the aromatic of the rings, which also contributes to the efficient adsorption.74 Furthermore, various Fe-based materials and their adsorption performance towards organic pollutants are documented in Table 3.
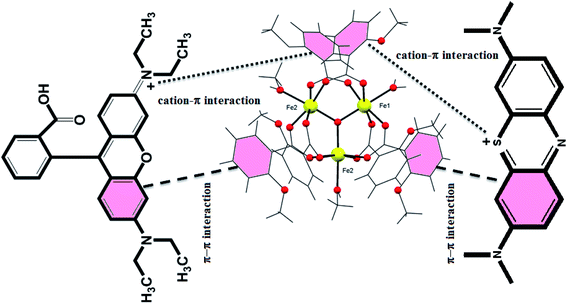 |
| | Fig. 12 Plausible mechanism for the adsorption of MB and Rh-B using low-cost {Fe3} clusters. | |
Table 3 Iron-based materials with maximum adsorption capacities (qmax) towards organic dyes
| Materials |
Organic pollutant |
Adsorption capacity/removal efficiency |
Ref. no. |
| Fe-MIL-101 |
Methylene blue |
124.07 mg g−1 |
74 |
| MIL-100 (Fe) |
Methylene blue |
1045.2 mg g−1 |
75 |
| NMIL-100 (Fe) |
Rhodamine-B |
68.69 mg g−1 |
76 |
| MOF-235 |
Congo red and lemon yellow |
1250 & 250 mg g−1 |
77 |
| Fe-BDC MOF |
Methylene blue |
92% |
78 |
| MIL-101(Fe)@PDopa@Fe3O4 |
Methyl red |
1250 mg g−1 |
79 |
| {Fe3} cluster |
Methylene blue, rhodamine-B |
67.27, 58.52 mg g−1 |
This work |
Conclusion
In this work, we have designed an oxo-bridged low-cost {Fe3} triangle shaped complex by a slow evaporation method. The {Fe3} cluster was characterized by spectral techniques, and with the assistance of single-crystal XRD, the exact structure of the {Fe3} cluster was confirmed. The {Fe3} cluster was then used as an adsorbent for organic dyes such as MB, Rh-B, and CV in the wastewater. The kinetics and isotherm experiments were also performed to understand the exact mechanism behind the adsorption of organic pollutants. The proposed mechanism was also drawn in the manuscript's main text, which suggests that the π–π interaction and other electrostatic interactions are possible for the adsorption process. Thus, the present work is a crucial instance of the structure–activity relationship and the excellent adsorption performance of the low-cost {Fe3} cluster.
Conflicts of interest
There are no conflicts of interests to declare.
References
- F. Mehrabi, A. Vafaei, M. Ghaedi, A. M. Ghaedi, E. A. Dil and A. Asfaram, Ultrason. Sonochem., 2017, 38, 672 CrossRef CAS.
- M. S. Khan, M. Khalid and M. Shahid, Mater. Adv., 2020, 1, 1575–1601 RSC.
- R. Soury, M. Jabli, T. A. Saleh, W. S. Abdul-Hassan, F. Loiseau, C. Philouze, A. Bujacz and H. Nasri, J. Mol. Liq., 2018, 264, 134 CrossRef CAS.
- M. S. Khan, M. Khalid, M. S. Ahmad, M. Shahid and M. Ahmad, Res. Chem. Intermed., 2020, 46, 2985–3006 CrossRef CAS.
- N. Tka, M. Jabli, T. A. Saleh and G. A. Salman, J. Mol. Liq., 2018, 250, 423 CrossRef CAS.
- V. K. Gupta, A. Nayak Suhas, S. Agarwal, M. Chaudhary and I. Tyagi, J. Mol. Liq., 2014, 190, 215 CrossRef CAS.
- M. Ghaedi, A. M. Ghaedi, E. Negintaji, A. Ansari, A. Vafaei and M. Rajabi, J. Ind. Eng. Chem., 2014, 20, 1793 CrossRef CAS.
- J. G. Speight, Environmental Organic Chemistry for Engineers, Butterworth Heinemann, 2017, pp. 203–261 Search PubMed.
- K. C. Engvild, Phytochemistry, 1986, 25, 781 CrossRef CAS.
- B. Song, T. Wang, H. Sun, Q. Shao, J. Zhao, K. Song, L. Hao, L. Wang and Z. Guo, Dalton Trans., 2017, 46, 15769–15777 RSC.
- A. Ayar, O. Gezici and M. Küçükosmanoglu, J. Hazard. Mater., 2007, 146, 186–193 CrossRef CAS.
- K. Elass, A. Laachach, A. Alaoui and M. Azzi, Appl. Clay Sci., 2011, 54, 90–96 CrossRef CAS.
- S. Wang, X. Xu, Y. Bai, Y. Ma, J. Zhang, F. Meng, J. Zhao and C. Tang, Sci. Adv. Mater., 2016, 8, 1020–1027 CrossRef CAS.
- T. Wang, P. Zhao, N. Lu, H. Chen, C. Zhang and X. Hou, Chem. Eng. J., 2016, 295, 403–413 CrossRef CAS.
- S. Cinar, U. H. Kaynar, T. Aydemir, S. C. Kaynar and M. Ayvacikli, Int. J. Biol. Macromol., 2017, 96, 459–465 CrossRef CAS.
- L. Zhang, M. Qin, W. Yu, Q. Zhang, H. Xie, Z. Sun, Q. Shao, X. Guo, L. Hao, Y. Zheng and Z. Guo, J. Electrochem. Soc., 2017, 164, H1086–H1090 CrossRef CAS; V. Gomez, M. S. Larrechi and M. P. Callao, Chemosphere, 2007, 69, 1151–1158 CrossRef.
- E. Yilmaz, E. Sert and F. S. Atalay, J. Taiwan Inst. Chem. Eng., 2016, 65, 323–330 CrossRef CAS; S. Wang and Z. H. Zhu, J. Hazard. Mater., 2006, 136, 946–952 CrossRef.
- K. Gong, Q. Hu, L. Yao, M. Li, D. Sun, Q. Shao, B. Qiu and Z. Guo, ACS Sustainable Chem. Eng., 2018, 6, 7283–7291 CrossRef CAS.
- S. S. Tahir and N. Rauf, Chemosphere, 2006, 63, 1842–1848 CrossRef CAS.
- J. Huang, Y. Cao, Q. Shao, X. Peng and Z. Guo, Ind. Eng. Chem. Res., 2017, 56, 10689–10701 CrossRef CAS.
- L. Zeng, L. Xiao, Y. Long and X. Shi, J. Colloid Interface Sci., 2018, 516, 274–283 CrossRef CAS.
- S. Xiong, Y. Gong, S. Hu, S. Wu, W. Li and Y. He, J. Mater. Chem. A, 2018, 6, 4752–4758 RSC.
- M. Ashafaq, M. Khalid, M. Raizada, M. S. Ahmad, M. S. Khan, M. Shahid and M. Ahmad, J. Inorg. Organomet. Polym. Mater., 2020, 30, 4496–4509 CrossRef CAS.
- M. S. Ahmad, M. Khalid, M. S. Khan, M. Shahid, M. Ahmad, M. Rao, A. Ansari and M. Ashafaq, New J. Chem., 2020, 44, 7998 RSC.
- J. Xu, W. Xing, H. Wang, W. Xu, Q. Ding and L. Zhao, Analyst, 2016, 141, 2307–2319 Search PubMed; W. Li, X. Wu, S. Li, W. Tang and Y. Chen, Appl. Surf. Sci., 2018, 436, 252–262 CrossRef CAS.
- W. Ren, J. Gao, C. Lei, Y. Cai, Q. Ni and J. Yao, Chem. Eng. J., 2018, 349, 766–774 CrossRef CAS.
- M. S. Ahmad, M. Khalid, M. S. Khan, M. Shahid and M. Ahmad, J. Struct. Chem., 2020, 61, 533 CrossRef CAS.
- E. Haque, J. E. Lee, I. T. Jang, Y. K. Hwang, J.-S. Chang, J. Jegal and S. H. Jhung, J. Hazard. Mater., 2010, 181, 535–542 CrossRef CAS.
- T. Shen, J. Luo, S. Zhang and X. Luo, J. Environ. Chem. Eng., 2015, 3, 1372–1383 CrossRef CAS.
- X. Luo, X. Fu, Y. Du, J. Guo and B. Li, Microporous Mesoporous Mater., 2017, 237, 268–274 CrossRef CAS.
- T. Wang, P. Zhao, N. Lu, H. Chen, C. Zhang and X. Hou, Chem. Eng. J., 2016, 295, 403–413 CrossRef CAS.
- S. Luo and J. Wang, Environ. Sci. Pollut. Res. Int., 2018, 25(6), 5521–5528 CrossRef CAS.
- X. Li, W. Guo, Z. Liu, R. Wang and H. Liu, Appl. Surf. Sci., 2016, 369, 130–136 CrossRef CAS.
- R. Rajak, M. Saraf, A. Mohammad and S. Mobin, J. Mater. Chem. A, 2017, 5, 17998–18011 RSC.
- L. Jin, X. Zhao, X. Qian and M. Dong, J. Colloid Interface Sci., 2018, 509, 245–253 CrossRef CAS.
- M. S. Khan, M. Khalid, M. S. Ahmad, M. Shahid and M. Ahmad, J. Struct. Chem., 2019, 60, 1833 CrossRef CAS.
- C. Cabello, M. Pico, F. Maya, M. del Rio and G. Palomino, Chem. Eng. J., 2018, 346, 85–93 CrossRef.
- J. Zhang, F. Li and Q. Sun, Appl. Surf. Sci., 2018, 440, 1219–1226 CrossRef CAS.
- J. S. Seo, D. Whang, H. Lee, S. I. Jun, J. Oh, Y. J. Jeon and K. Kim, Nature, 2000, 404, 982 CrossRef CAS.
- C. E. Summer Jr and G. R. Steinmetz, J. Am. Chem. Soc., 1985, 107, 6124 CrossRef.
- S. Ito, K. Inone and M. Mastumoto, J. Am. Chem. Soc., 1982, 104, 6450 CrossRef CAS.
- S. J. Lippard, Angew. Chem., 1988, 100, 353 CrossRef CAS.
- M. C. Ghosh, S. Mandal, S. K. Chandra and S. E. Gould, Inorg. Chem., 1995, 34, 509 CrossRef CAS.
- C. Stadler, J. Daub, J. Köhler, R. W. Saalfrank, V. Coropceanu, V. Schünemann, C. Ober, A. X. Trautwein, S. F. Parker, M. Poyraz, T. Inomata and R. D. Cannon, J. Chem. Soc., Dalton Trans., 2001, 3373 RSC.
- Y. T. Lui, C. W. Yan and H. S. Guan, Polyhedron, 2003, 22, 3223 CrossRef.
- M. Eshel and A. Bino, Inorg. Chim. Acta, 2002, 329, 45 CrossRef CAS.
- A. Harton, K. Terrell, J. C. Huffman, C. MacDonald, A. Beatty, S. Li, C. J. O'Connor and J. B. Vincent, Inorg. Chem., 1997, 36, 4875 CrossRef CAS.
- M. Anbia, V. Hoseini and S. Sheykhi, J. Ind. Eng. Chem., 2012, 18, 1149–1152 CrossRef CAS.
- H. Duo, H. Tang, J. Ma, X. Lu, L. Wang and X. Liang, New J. Chem., 2019, 43, 15351–15358 RSC.
- J. A. Ibers and W. C. Hamilton, International Tables for X-ray Crystallography, Kynoch Press, Birmingham, England, 1974, vol. IV. 26 Search PubMed; SMART & SAINT Software Reference manuals, Version 6.45, Bruker Analytical X-ray Systems, Inc., Madison, WI, 2003 Search PubMed.
- G. M. Sheldrick, SADABS, software for empirical absorption correction, Ver. 2.05, University of Göttingen, Göttingen, Germany, 2002 Search PubMed.
- XPREP, version 5.1, Siemens Industrial Automation Inc., Madison, WI, 1995 Search PubMed.
- L. J. Bourhis, O. V. Dolomanov, R. J. Gildea, J. A. K. Howard and H. Puschmann, Acta Crystallogr., Sect. A: Found. Adv., 2015, 71, 59 CrossRef CAS.
- K. Iman, M. Shahid and M. Ahmad, Dalton Trans., 2020, 49, 3423–3433 RSC.
- C. C. Vilalta, E. Rumberger, E. K. Brechin, W. Wernsdorfer, K. Folting, E. R. Davidson, D. N. Hendrikson and G. Christou, J. Chem. Soc., Dalton Trans., 2002, 4005 RSC.
- E. J. Seddon, J. C. Huffman and G. Christou, J. Chem. Soc., Dalton Trans., 2000, 4446 RSC.
- X. M. Ren, H. Okudera and R. K. Kremer, Acta Crystallogr., Sect. E: Struct. Rep. Online, 2004, 60, m14–m16 CrossRef CAS.
- J. Overgaard, F. K. Larsen, B. Schitt and B. B. Iversen, J. Am. Chem. Soc., 2003, 125, 11088 CrossRef CAS.
- K. I. Turte, S. G. Shova, F. A. Spatar, M. D. Mazus and T. I. Malinovskii, J. Struct. Chem., 1994, 35, 248–255 CrossRef.
- A. K. Boudalis, Y. Sanakis, C. P. Raptopoulou, A. Terzis, J.-P. Tuchagues and S. P. Perlepes, Polyhedron, 2005, 24, 1540 CrossRef CAS.
- M. S. Khan, M. U. Hayat, M. Khanam, H. Saeed, M. Owais, M. Khalid, M. Shahid and M. Ahmad, J. Biomol. Struct. Dyn., 2020 DOI:10.1080/07391102.2020.1776156.
- E. Bill, C. Krebs, M. Winter, M. Gerdan, A. Trautwein, U. Flörke, H.-J. Haupt and P. Chaudhuri, Chem. - Eur. J., 1997, 3, 193 CrossRef CAS.
- P. Chaudhuri, M. Winter, P. Fleischhauer, W. Haase, U. Flörke and H.-J. Haupt, Inorg. Chim. Acta, 1993, 212, 241 CrossRef CAS.
- M. S. Khan, M. Khalid, M. S. Ahmad, M. Ahmad, M. Ashafaq, R. Uddin, R. Arif and M. Shahid, J. Mol. Struct., 2019, 1175, 889 CrossRef CAS.
- X. Ren, G. Zeng, L. Tang, J. Wang, J. Wan, Y. Liu, J. Yu, H. Yi, S. Ye and R. Deng, Sci. Total Environ., 2018, 1154, 610–611 Search PubMed.
- L. Qin, G. Zeng, C. Lai, D. Huang, P. Xu, C. Zhang, M. Cheng, X. Liu, S. Liu, B. Li and H. Yi, Coord. Chem. Rev., 2018, 359, 1–3 CrossRef CAS.
- X. Zhang, Y. Gao, H. Liu and Z. Liu, CrystEngComm, 2015, 17, 6037 RSC.
- A. Mariyam, M. Shahid, I. Mantasha, M. S. Khan and M. S. Ahmad, J. Inorg. Organomet. Polym. Mater., 2019, 30, 1935–1945 CrossRef , 1-9.
- S. Kamal, M. Khalid, M. S. Khan, M. Shahid, M. Ashafaq, I. Mantasha, M. S. Ahmad, M. Ahmad, M. Faizan and S. Ahmad, Inorg. Chim. Acta, 2020, 512, 119872 CrossRef CAS.
- M. S. Khan, M. Khalid, M. S. Ahmad, M. Shahid and M. Ahmad, Dalton Trans., 2019, 48, 12918 RSC.
- I. Mantasha, H. A. M. Saleh, K. M. A. Qasem, M. Shahid, M. Mehtab and M. Ahmad, Inorg. Chim. Acta, 2020, 511, 119787 CrossRef.
- K. Iman, M. Shahid, M. S. Khan, M. Ahmad and F. Sama, CrystEngComm, 2019, 21, 5299–5309 RSC.
- M. N. Ahamad, M. S. Khan, M. Shahid and M. Ahmad, Dalton Trans., 2020, 49, 14690–14705 RSC.
- S. M. Hassan, A. A. Ibrahim and D. A. Mohamed, Int. J. Mod. Chem., 2017, 9, 111 CAS.
- M. Tong, D. Liu, Q. Yang, S. Devautour-Vinot, G. Maurin and C. Zhong, J. Mater. Chem. A, 2013, 1, 8534 RSC.
- S. Duan, J. Li, X. Liu, Y. Wang, S. Zeng, D. Shao and T. Hayat, ACS Sustainable Chem. Eng., 2016, 4, 3368 CrossRef CAS.
- H. Duo, H. Tang, J. Ma, X. Lu, L. Wang and X. Liang, New J. Chem., 2019, 43, 15351–15358 RSC.
- C. Arora, S. Soni, S. Sahu, J. Mittal, P. Kumar and P. K. Bajpai, J. Mol. Liq., 2019, 284, 343–352 CrossRef CAS.
- A. Hamedi, M. B. Zarandi and M. R. Nateghi, J. Environ. Chem. Eng., 2019, 7, 102882 CrossRef CAS.
Footnote |
| † Electronic supplementary information (ESI) available. CCDC 2054444. For ESI and crystallographic data in CIF or other electronic format see DOI: 10.1039/d0ra09586a |
|
| This journal is © The Royal Society of Chemistry 2021 |
 Open Access Article
 ,
Mohd Khalid
 * and
M. Shahid
![[thin space (1/6-em)]](https://www.rsc.org/images/entities/char_2009.gif) 020
020


![[double bond, length as m-dash]](https://www.rsc.org/images/entities/char_e001.gif) O band (in free ligand) disappears during the formation of {Fe3}, which authenticates the complexation of ligand. The spectrum of the {Fe3} cluster further shows strong bands at 1622 and 1364 cm−1, which are characteristic of the νassym(COOO−) and νsymm (COOO−) vibrations of any carboxylate ligand (Fig. S2† ESI). These frequencies give ample information about the benzoate binding mode with the Fe(III) atom. The difference between the νassym(COOO−) and νsymm(COOO−), which is designed as Δν is the value that provides information about the binding mode of the carboxylate ligand. In the present {Fe3} cluster, the difference, Δν = 258 cm−1, supports the said mode of bonding of benzoate. The band near 705 cm−1 is assigned to the C–H bond in the aromatic ring. The band at 1027 cm−1 is visible in the FTIR spectra, which may be due to the ν(C–O) vibration present in the benzoate moieties. The medium intensity bands 546 and 455 are due to the coordinate bond of Fe with various benzoate oxygen donors.61 The new sharp band at 596 cm−1 can be due to the formation of iron and the μ3-O atom.62,63 These data are quite informative and further corroborate the single-crystal data. The PXRD pattern of the as-synthesized cluster was performed on the crystalline powder sample of {Fe3}. The simulated pattern was obtained from the single-crystal data using the MERCURY software. It was seen from Fig. 5a that the two PXRD patterns are quite identical, which support the bulk integrity of the {Fe3} cluster. The thermal effect on the {Fe3} cluster was analyzed from the TG data. The TG data revealed that the {Fe3} cluster was relatively stable up to 300 °C, which may be due to the various non-covalent bonds present in the {Fe3} cluster. The π–π and C–H⋯π interactions provide extra stability to the {Fe3} cluster. The TG analysis of the {Fe3} cluster shows the two-step fragmentation in its structure, where the first step involves the elimination of coordinated water and methanol ligands. In contrast, the second step involves the disintegration of six benzoate ligands. In the first step, the TG reveals the fragmentation with 5.43% weight loss (Calc. 5.80%) at a temperature in the range of 25–120 °C, which may be due to coordinated water and methanol ligands (Fig. 5b). Then, the {Fe3} cluster becomes robust, which shows a flat curve up to 280 °C, after which it shows the removal of six benzoate ligands in the temperature range of 300 °C to 400 °C with a weight loss of 64.08% (Calc. 64.89%). Then, the {Fe3} cluster does not show any changes up to 600 °C and the final product left in the {Fe3} cluster may be oxides or carbon residues, which is consistent with the previous report.64 Because of the extra stability of the {Fe3} cluster, it can be used in high-temperature applications.
O band (in free ligand) disappears during the formation of {Fe3}, which authenticates the complexation of ligand. The spectrum of the {Fe3} cluster further shows strong bands at 1622 and 1364 cm−1, which are characteristic of the νassym(COOO−) and νsymm (COOO−) vibrations of any carboxylate ligand (Fig. S2† ESI). These frequencies give ample information about the benzoate binding mode with the Fe(III) atom. The difference between the νassym(COOO−) and νsymm(COOO−), which is designed as Δν is the value that provides information about the binding mode of the carboxylate ligand. In the present {Fe3} cluster, the difference, Δν = 258 cm−1, supports the said mode of bonding of benzoate. The band near 705 cm−1 is assigned to the C–H bond in the aromatic ring. The band at 1027 cm−1 is visible in the FTIR spectra, which may be due to the ν(C–O) vibration present in the benzoate moieties. The medium intensity bands 546 and 455 are due to the coordinate bond of Fe with various benzoate oxygen donors.61 The new sharp band at 596 cm−1 can be due to the formation of iron and the μ3-O atom.62,63 These data are quite informative and further corroborate the single-crystal data. The PXRD pattern of the as-synthesized cluster was performed on the crystalline powder sample of {Fe3}. The simulated pattern was obtained from the single-crystal data using the MERCURY software. It was seen from Fig. 5a that the two PXRD patterns are quite identical, which support the bulk integrity of the {Fe3} cluster. The thermal effect on the {Fe3} cluster was analyzed from the TG data. The TG data revealed that the {Fe3} cluster was relatively stable up to 300 °C, which may be due to the various non-covalent bonds present in the {Fe3} cluster. The π–π and C–H⋯π interactions provide extra stability to the {Fe3} cluster. The TG analysis of the {Fe3} cluster shows the two-step fragmentation in its structure, where the first step involves the elimination of coordinated water and methanol ligands. In contrast, the second step involves the disintegration of six benzoate ligands. In the first step, the TG reveals the fragmentation with 5.43% weight loss (Calc. 5.80%) at a temperature in the range of 25–120 °C, which may be due to coordinated water and methanol ligands (Fig. 5b). Then, the {Fe3} cluster becomes robust, which shows a flat curve up to 280 °C, after which it shows the removal of six benzoate ligands in the temperature range of 300 °C to 400 °C with a weight loss of 64.08% (Calc. 64.89%). Then, the {Fe3} cluster does not show any changes up to 600 °C and the final product left in the {Fe3} cluster may be oxides or carbon residues, which is consistent with the previous report.64 Because of the extra stability of the {Fe3} cluster, it can be used in high-temperature applications.
![[thin space (1/6-em)]](https://www.rsc.org/images/entities/char_2009.gif) 000 tons of dyes are used in the world by the textile industry, which is among the top three pollutants. Almost every dye is dangerous and has a high risk of carcinogenic mutations.65 Due to its environmentally friendly nature and cost-effectiveness, the adsorption process is applied nowadays to remove dye molecules from wastewater.66 Due to its easy construction method and low-cost constituents, the {Fe3} cluster was engaged for the adsorption and removal of hazardous dyes from wastewater. In the experiment, we chose four different dyes, i.e., MB, MO, Rh-B, and CR with different charges and sizes (Fig. 6).67
000 tons of dyes are used in the world by the textile industry, which is among the top three pollutants. Almost every dye is dangerous and has a high risk of carcinogenic mutations.65 Due to its environmentally friendly nature and cost-effectiveness, the adsorption process is applied nowadays to remove dye molecules from wastewater.66 Due to its easy construction method and low-cost constituents, the {Fe3} cluster was engaged for the adsorption and removal of hazardous dyes from wastewater. In the experiment, we chose four different dyes, i.e., MB, MO, Rh-B, and CR with different charges and sizes (Fig. 6).67


