DOI:
10.1039/C8NA00236C
(Paper)
Nanoscale Adv., 2019,
1, 1165-1174
Platinum single-atom adsorption on graphene: a density functional theory study†
Received
23rd September 2018
, Accepted 8th December 2018
First published on 8th January 2019
Abstract
Single-atom catalysis, which utilizes single atoms as active sites, is one of the most promising ways to enhance the catalytic activity and to reduce the amount of precious metals used. Platinum atoms deposited on graphene are reported to show enhanced catalytic activity for some chemical reactions, e.g. methanol oxidation in direct methanol fuel cells. However, the precise atomic structure, the key to understand the origin of the improved catalytic activity, is yet to be clarified. Here, we present a computational study to investigate the structure of platinum adsorbed on graphene with special emphasis on the edges of graphene nanoribbons. By means of density functional theory based thermodynamics, we find that single platinum atoms preferentially adsorb on the substitutional carbon sites at the hydrogen terminated graphene edge. The structures are further corroborated by the core level shift calculations. Large positive core level shifts indicate the strong interaction between single Pt atoms and graphene. The atomistic insight obtained in this study will be a basis for further investigation of the activity of single-atom catalysts based on platinum and graphene related materials.
1 Introduction
High-performance electrocatalysts are highly desired for electrochemical energy conversion devices, such as photovoltaic cells and fuel cells. Platinum (Pt) is widely used as an electrocatalyst, as it exhibits high catalytic activity not only for hydrogen oxidation but also for oxygen reduction at low temperatures.1,2 Nevertheless, there is still an urgent need to address the high cost of Pt and to search for alternative catalysts, which use small amounts of Pt or no Pt with earth-abundant materials. Tremendous efforts have been devoted to achieve these goals, including the use of non-precious metals for Pt–metal alloys,3–9 or the use of noble metal-free catalysts.10–13 Particularly interesting are Pt clusters supported by graphitic materials, such as carbon black, carbon nanotubes, and graphene, which have been extensively studied both experimentally,14–20 and theoretically.21–34 A better catalytic activity of small Pt clusters supported by graphene sheets has been demonstrated experimentally.16,17 These results lead to the hypothesis that downsizing the Pt clusters to single atoms can enhance the catalytic activity. Recently, Sun et al. have successfully deposited single Pt atoms on graphene nanosheets using atomic layer deposition and then demonstrated a significant improvement of the catalytic activity for the methanol oxidation reaction.35 Cheng et al. also showed that a Pt single-atom catalyst deposited on nitrogen doped graphene nanosheets exhibits enhanced catalytic activity for the hydrogen evolution reaction.36 The vacancies usually formed during the preparation are expected to have strong interactions with the Pt atoms as demonstrated in several theoretical studies.23,31,32 Back et al. have predicted the great potential of a single atom catalyst supported on defective graphene for CO2 electroreduction applications.37 However, the dispersion of the single Pt atoms on graphene is limited to the number of point defects. On the other hand, the graphene edge might offer more space for depositing single Pt atoms. Kong et al. have theoretically investigated Pt single-atom adsorption at the edges of graphite nanofibers and found that the atoms are tightly bound to the edges due to the existence of active dangling bonds.38 By employing transmission electron microscopy, the structure and dynamics of Au,39 Fe,40 Cu,41 and Pt41,42 atoms at the edges have been studied. Some experimental studies also observed that Pt nano-clusters at the graphene edges are stable at high-temperatures.43–45 However, the adsorption state and the catalytic activities of single Pt atoms are not yet fully understood.
In this work, we investigate Pt single-atom adsorption on graphene by means of density functional theory (DFT) that includes van der Waals forces. We perform systematic calculations to determine the adsorption state of single Pt atoms on graphene, including defective graphene structures and graphene edges. Special emphasis is devoted to the graphene edges, as they are abundant under realistic conditions. We consider both zigzag and armchair edges, including the dependence on hydrogen termination. We examine their stability by taking into account the environmental effects, via DFT based thermodynamics.46 We find that single Pt atoms adsorb preferentially at the edge rather than on graphene, and the substitutional carbon site is the most stable one under the conditions relevant to experiments. Furthermore, the core level shift (CLS) of Pt atoms is calculated for each structure, which is used to validate the predicted structure against the experiment.
2 Computational details
All the DFT calculations are performed by using STATE code47,48 with ultrasoft pseudopotentials.49 A plane-wave basis set is used to expand wave functions and charge density with cutoff energies of 36 Ry and 400 Ry, respectively. We use rev-vdW-DF2 (ref. 50) exchange correlation functional as implemented51 in the code with an efficient algorithm.52,53 Pseudopotentials are generated using the Perdew–Burke–Ernzerhof (PBE)54 functional and the use of PBE pseudopotentials in rev-vdW-DF2 calculations is validated in ref. 55. We use a (6 × 6) supercell to simulate Pt single-atom adsorption on pristine (GR), mono-carbon vacancy (V1), and di-carbon vacancy (V2) graphene structures. We introduce the 7575 membered rings of graphene as a boundary between zigzag and armchair as observed in ref. 56, denoted as grain-boundary graphene (GB-GR). We place the GB-GR in a 17.23 Å × 14.03 Å rectangular unit cell. We also construct disorder graphene (DisGR) reported in ref. 57, and place it in a 20.37 Å × 24.67 Å rectangular cell. Brillouin zone integration is performed for all structures using the Γ-centered 4 × 4 k-point mesh for pristine, mono-carbon vacancy, and di-carbon vacancy graphenes; 2 × 3 k-point mesh for GB-GR; and the Γ-point for DisGR. To investigate the edge effect in the Pt adsorption, we employ graphene nanoribbons (GNRs) with zigzag (zGNR) and armchair (aGNR) edges with different terminations, including non-hydrogenated, mono-hydrogenated, and di-hydrogenated ones. We follow the convention used in ref. 58, i.e., zn to denote zGNR with n hydrogen atoms at the edge carbon (C) site, and an for aGNR with n hydrogen (H) atoms. Spin polarization is taken into account for all systems. zGNR has the localized spin with ferromagnetic order along the edge and antiparallel orientation between the edges as reported in ref. 59 and 60, while such localized spin does not appear at the edge of aGNR. GNRs are modeled using a periodic supercell along the edges, having the same configurations on both edges. Following the conventional notation, the width of GNR is specified by the number of zigzag chains and dimer lines for zGNR and aGNR, respectively, and we use 5-zGNR and 10-aGNR in this work. We use supercells containing 4 hexagons for both zGNR and aGNR, and the resulting supercells contain 40 carbon atoms. Supercells in the graphene plane directions correspond to  and
and  supercells of graphene for zGNR and aGNR, respectively, and graphene planes are separated by a vacuum of ∼15 Å thickness. Vacuum thicknesses between edges are 16.48 Å and 18.70 Å for zGNR and aGNR, respectively. Brillouin zone integration is performed using the Γ-centered 6 × 2 k-point set for both zGNR and aGNR. All the graphene based structures considered in this work are constructed using the lattice constant of graphene obtained using rev-vdW-DF2 (2.46 Å),61 which is in good agreement with the experimental value for graphite (2.4589 ± 0.0005 Å).62 The structures are fully relaxed until the forces acting on the atoms become smaller than 5.14 × 10⁻² eV Å−1 (1 × 10⁻³ Hartree/Bohr). The Pt 4f CLS including the final state screening is calculated as the difference between the core level binding energy of Pt adsorbed GNR and bulk Pt.63,64
3 Results and discussion
3.1 Pt single-atom adsorption on pristine and defective graphene structures
We first consider pristine and defective graphene structures and adsorption of single Pt atoms on them as shown in Fig. 1. We calculate the binding energy defined by| | | Eb = EPt/G − EG − μPt, | (1) |
where EPt/G, EG, and μPt are the total energy of the adsorption system, the total energy of the substrate, and the chemical potential of Pt, respectively. We use the total energy of an isolated Pt atom for μPt. In Table 1, we summarize the calculated binding energies of a single Pt atom on pristine and defective graphene structures. The binding energy for the pristine graphene is slightly larger than those reported in ref. 26 because of the exchange–correlation functionals used (see Table S1 in the ESI† for the binding energies calculated using the PBE54 functional). The Pt single-atom adsorption on graphene with vacancy is significantly stable, because the Pt atom terminates dangling bonds associated with the C vacancy. However, the energies necessary to create the C vacancies (formation energies for C vacancy with respect to the C atom in graphene) are 7.77 eV and 7.86 eV for V1 and V2, respectively, and the effective binding energies are +0.07 eV and +0.29 eV, respectively. Thus we conclude that the Pt single-atom adsorption at the C vacancy site is thermodynamically less favorable. The binding energies of a single Pt atom for GB-GR and DisGR are apparently much larger than that for pristine graphene. However, this is because GB-GR and DisGR are less stable and thus more reactive than the pristine one. They are less stable than pristine graphene by 0.17 and 0.39 eV per C atom, respectively.
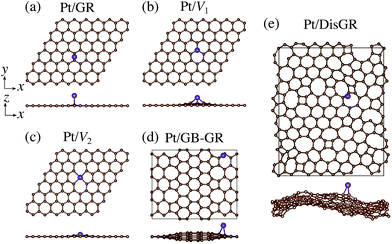 |
| | Fig. 1 Optimized structures of Pt single-atom adsorption on (a) pristine graphene (GR), (b) graphene with a carbon mono-vacancy (V1), (c) graphene with a carbon di-vacancy (V2), (d) grain-boundary graphene (GB-GR), and (e) disorder graphene (DisGR). | |
Table 1 Binding energy (Eb) of Pt single-atom adsorption for several graphene based structures
| Structure |
E
b/eV |
| Pt/GR |
−1.97 |
| Pt/V1 |
−7.70 |
| Pt/V2 |
−7.57 |
| Pt/GB-GR |
−2.55 |
| Pt/DisGR |
−2.99 |
3.1.1 Pristine GNR.
We then investigate the most stable GNR by calculating the formation energy defined by| |  | (2) |
where EGNR, EGR, and μH2 are the total energy of GNR, total energy of C atoms in bulk graphene (total energy of graphene per atom), and chemical potential of H2 molecule, respectively; NC (NH) is the number of C (H) atoms in GNR; and L is the length of the unit cell along the edge. Fig. 2 shows the calculated formation energy as a function of H2 chemical potential. It is found that at high H2 chemical potential, aGNR (a2) is stable, whereas zGNRs are more stable at low H2 chemical potential, and non-hydrogenated GNR is unstable in a wide range of H2 chemical potential, in good agreement with the previous study.58 The positions of the intersections differ from those reported in ref. 58, because the exchange–correlation functionals used are different (see Fig. S1 in the ESI† for comparison of the results obtained using rev-vdW-DF2 and PBE). We also confirm that the stability is insensitive to the GNR width (see Fig. S2 in the ESI†).
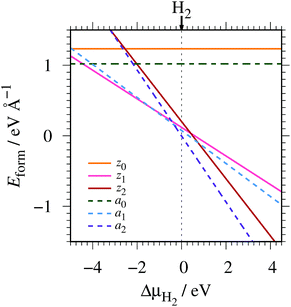 |
| | Fig. 2 Formation energy of GNR as a function of H2 chemical potential. ΔμH2 = μH2 − EH2, where EH2 is the total energy of a gas-phase H2 molecule at 0 K. | |
To compare the stability of the GNRs with the defective graphene structures, we calculate the formation energy per C atom (replace 2L in eqn (2) with NC). At μH2 = EH2, the formation energy per C atom of z0, z1, z2, a0, a1, and a2 are 0.61, 0.06, 0.10, 0.44, 0.03, and ∼0.00 eV, respectively. Thus, although most GNRs considered here are less stable than pristine graphene (i.e. most GNRs have positive Eform at μH2 = EH2), hydrogenated GNRs are more stable than defective graphene structures.
3.2 Pt single-atom adsorption on zGNRs
We consider Pt single-atom adsorption on non-hydrogenated zGNR (z0). We systematically construct the adsorption configurations with and without defects, and label them according to the Kröger–Vink notation,65 as shown in Fig. 3. We first consider the Pt single-atom adsorption at the top- and bridge-site of perfect z0, denoted as PtT@z0 (Fig. 3(a)) and PtB@z0 (Fig. 3(b)), respectively. Second, we introduce a Stone–Wales (SW) defect at the edge of z0, denoted as z(57)0, and a Pt atom adsorbed at the long-bridge (LB) site of the SW defect, denoted as PtLB@z(57)0 (Fig. 3(c)). We introduce substitutional Pt with single edge carbon atoms (Cα, Cβ) denoted as PtCα@z0 (Fig. 3(d)) and PtCβ@z0 (Fig. 3(e)), respectively. We also consider two outermost carbon vacancies (VC), and obtained the Pt substituted with two VC's (Pt(Cα)@z0, Fig. 3(f)) and a complex of a substitutional Pt and VC (PtCαVCα@z0, Fig. 3(g)). Finally we consider Pt configurations with a divacancy formed with the outermost and second outermost atoms and that with second and third outermost C atoms (PtCαCβ@z0 (Fig. 3(h)) and PtCβCγ@z0 (Fig. 3(i), respectively).
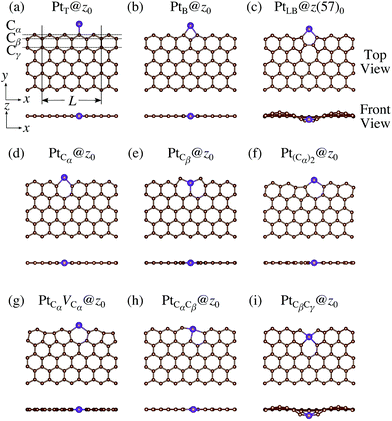 |
| | Fig. 3 Optimized structures of Pt single-atom adsorption at the edge of non-hydrogenated zGNRs. Purple (brown) spheres represent Pt (H) atoms. The first, second, and third outermost carbon atoms are denoted as Cα, Cβ, and Cγ, respectively. L indicates the periodicity of the ribbons along the edge direction. | |
For the optimized structures with a single Pt atom at the edge of z0, we calculate the Gibbs free energy defined by
| | | ΔΩ(μC) = EPt@GNR − Eref − μPt − ΔNCμC, | (3) |
where
EPt@GNR and
Eref are the total energies of adsorbed and reference systems, respectively; Δ
NC is the difference of the number of C atoms from the reference system; and
μPt and
μC are the chemical potentials of Pt and C, respectively. Here we choose pristine graphene as the reference (
Eref =
EGR ×
NC, where
NC is the number of C atoms in the perfect GNR).
μPt is chosen to be the total energy of an isolated Pt atom (
EPt) and
μC varies around the chemical potential of graphene.
Fig. 4 shows the Gibbs free energy as a function of C chemical potential for nine structures considered in this work, and those at
μC =
EGR (the system is in equilibrium with graphene) are summarized in
Table 2. We can see that all the structures have large positive Gibbs free energies at
μC =
EGR, suggesting that Pt single-atom adsorption at the edges of
z0 is thermodynamically unstable. Among the Pt adsorption structures on
z0, Pt
Cα@
z0 is the most favorable configuration. However, the calculated CLS for Pt
Cα@
z0 is too small compared with the experimental value of (+2.0 ± 0.4) eV,
42 suggesting that this adsorption configuration is unlikely. On the other hand, Pt
Cβ@
z0 and Pt
CβCγ@
z0 show a relatively large CLS of +1.44 and +1.67 eV, respectively. However, their Gibbs free energies are significantly large, ruling out these configurations. Thus, we conclude that Pt single-atom adsorption on the non-hydrogenated GNR is unlikely under the equilibrium conditions.
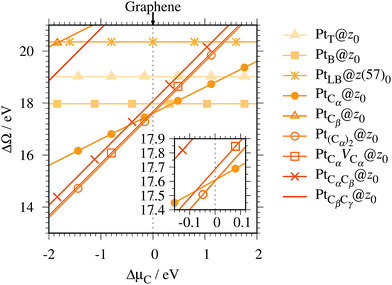 |
| | Fig. 4 The Gibbs free energy for the pristine GNRs as a function of C chemical potentials. ΔμC = μC − EGR is the C chemical potential referenced to the total energy of graphene at 0 K (EGR). | |
Table 2 Gibbs free energy (ΔΩ) and core level shift (CLS) of Pt atom@zGNRs at μC = EGR and μH = EH2
|
|
ΔΩ(EGR,EH2)/eV |
CLS/eV |
|
z
0
|
z
1
|
z
2
|
z
0
|
z
1
|
z
2
|
|
PtLB should be adsorbed at the edge of z(57)n.
Taken from ref. 42.
|
| PtT |
+19.02 |
+0.15 |
+1.61 |
−0.56 |
−0.93 |
−1.30 |
| PtB |
+17.98 |
+1.57 |
+2.57 |
+0.44 |
+0.35 |
+0.35 |
| PtLBa |
+20.35 |
+3.88 |
+4.86 |
+0.44 |
+0.44 |
+0.29 |
| PtCα |
+17.61 |
−0.25 |
+1.92 |
+0.50 |
+1.43 |
+1.20 |
| PtCβ |
+22.16 |
+1.89 |
+0.51 |
+1.44 |
+1.37 |
+1.42 |
| Pt(Cα) |
+17.60 |
+1.79 |
+2.98 |
−0.29 |
+0.24 |
+0.48 |
| PtCαVCα |
+17.69 |
+2.02 |
+3.33 |
−0.42 |
+0.54 |
+0.88 |
| PtCαCβ |
+18.08 |
+0.14 |
+1.62 |
+0.81 |
+0.81 |
+0.52 |
| PtCβCγ |
+22.87 |
+2.11 |
+1.21 |
+1.67 |
+0.82 |
+1.11 |
| Expt |
— |
— |
— |
+2.0 ± 0.4b |
We then investigate the stability of Pt single-atom adsorption on mono- and di-hydrogenated zGNRs (z1 and z2). The structures are similar to those adopted for non-hydrogenated zGNRs as shown in Fig. 5 and 6 for z1 and z2, respectively. We optimized all the structures and calculated the Gibbs free energy given by
| |  | (4) |
where
EPt@GNR (
Eref) is the total energy of the adsorbed system (reference system),
μPt =
EPt, Δ
NC, and Δ
NH are the difference of numbers of C and H atoms from the reference system, respectively, and
μC and
μH2 are chemical potentials of C atom and H
2 molecule, respectively. As in the case of
z0, pristine graphene is chosen as the reference. We calculate Δ
Ω for
z0,
z1, and
z2 as a function of
μH2 and
μC and generate the phase diagram as shown in
Fig. 7. We also calculate Δ
Ω at
μC =
EGR and
μH2 =
EH2 for the structures considered, where
EH2 is the total energy of an isolated H
2 molecule. The results are summarized in
Table 2 along with the calculated CLSs for each structure. As expected, single Pt atom adsorbed non-hydrogenated
zGNR is unstable and does not appear in the phase diagram. We find that Pt
Cα@
z1 only exhibits negative Δ
Ω at
μC =
EGR and
μH2 =
EH2, suggesting that this structure is thermodynamically stable under these conditions. Furthermore, the calculated CLS for this structure is in reasonable agreement with the experiment. Among the hydrogenated GNR structures, calculated CLSs for Pt
Cβ@
z1 and Pt
Cα@
z2 are also reasonable. However, they show positive Δ
Ω's, implying that these structures are less likely than Pt
Cα@
z1.
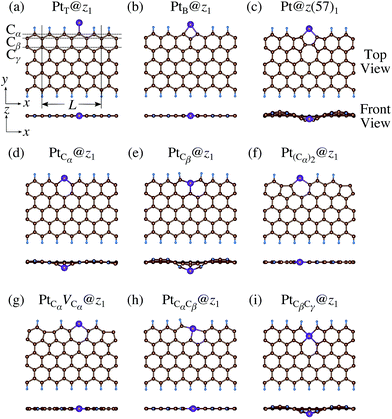 |
| | Fig. 5 Optimized structures of Pt single-atom adsorption at the edges of mono-hydrogenated zGNRs. Purple, brown, and light blue spheres represent Pt, C, and H atoms, respectively. The first, second, and third outermost C atoms are denoted as Cα, Cβ, and Cγ, respectively. L indicates the periodicity of the ribbons along the edge direction. | |
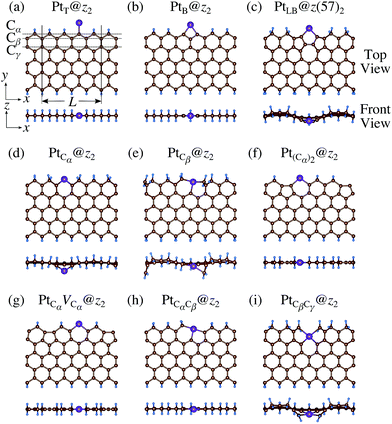 |
| | Fig. 6 Optimized structures of Pt single-atom adsorption at the edges of di-hydrogenated zGNRs. Purple, brown, and light blue spheres represent Pt, C, and H atoms, respectively. The first, second, and third outermost C atoms are denoted as Cα, Cβ, and Cγ, respectively. L indicates the periodicity of the ribbons along the edge direction. | |
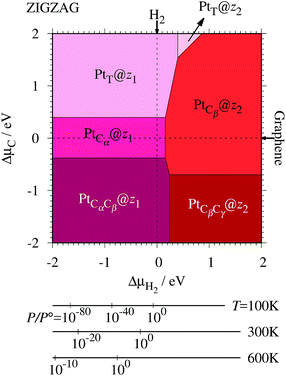 |
| | Fig. 7 The Gibbs free energy for Pt single-atom adsorption at the edge of zGNRs as a function of C and H2 chemical potentials. ΔμC = μC − EGR and ΔμH2 = μH2 − EH2 are C and H2 chemical potentials referenced to the total energies of gas-phase H2 and graphene, respectively. The bottom axes show the corresponding H2 chemical potentials at the absolute temperature T and partial pressure P (with P° = 1 atm), μH2 = H°(T) − H°(0) − TS°(T) + kBT![[thin space (1/6-em)]](https://www.rsc.org/images/entities/char_2009.gif) ln(P/P°), where the enthalpy H° and the entropy S° are obtained from ref. 66. ln(P/P°), where the enthalpy H° and the entropy S° are obtained from ref. 66. | |
3.3 Pt single-atom adsorption on aGNRs
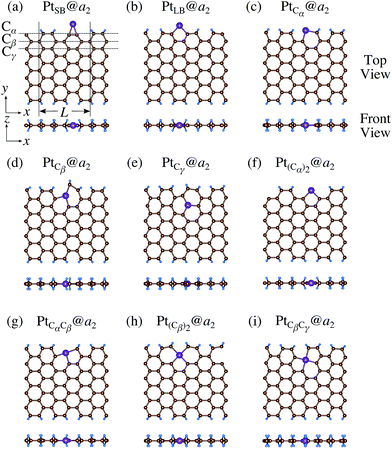
We investigate the Pt single-atom adsorption at the edge of mono- and di-hydrogenated aGNRs. We do not consider non-hydrogenated aGNRs as the non-hydrogenated structures are unstable as observed in the case of zGNR. We consider the following structures: Pt adsorbed at short-bridge (SB) and long-bridge (LB) sites (Fig. 8(a) and (b), respectively); substitutional Pt with single C atom respectively (Fig. 8(c)–(e)); substitutional Pt with two C atoms (Fig. 8(f)–(i)). We construct similar structures for dihydrogenated aGNR (Fig. 9). The structures are fully optimized and the Gibbs free energies are calculated according to eqn (4). The phase diagram for aGNR is shown in Fig. 10, and ΔΩ's at μC = EGR and μH2 = EH2 for different adsorption configurations are summarized in Table 3. We find that PtCα@z2 is the most stable at μC = EGR and μH2 = EH2 with reasonable CLS, suggesting that this structure is the most likely candidate under these conditions. Furthermore, the absolute value of calculated ΔΩ is much larger than that of the most stable zGNR, suggesting that Pt adsorbed at aGNR is thermodynamically more stable than Pt adsorbed at zGNR. We also find that PtCβ@a1, PtCγ@a1, and PtCγ@a2 show relatively large positive CLSs. However, they show large positive ΔΩ at μC = EGR and μH2 = EH2 and therefore appear in the phase diagram (Fig. 10). In particular the latter two show large positive ΔΩ and are less likely.
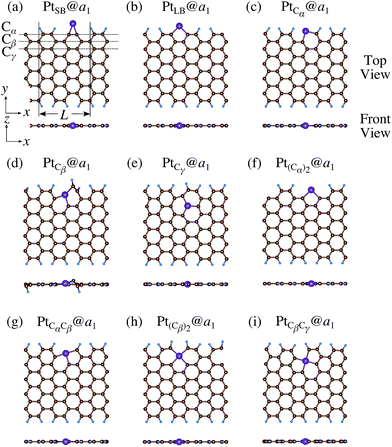 |
| | Fig. 8 Optimized structures of Pt single-atom adsorption at the edges of mono-hydrogenated aGNRs. Purple, brown, and light blue spheres represent Pt, C, and H atoms, respectively. The first, second, and third outermost C atoms are denoted as Cα, Cβ, and Cγ, respectively. L indicates the periodicity of the ribbons along the edge direction. | |
 |
| | Fig. 9 Optimized structures of Pt single-atom adsorption at the edges of di-hydrogenated aGNRs. Purple, brown, and light blue spheres represent Pt, C, and H atoms, respectively. The first, second, and third outermost C atoms are denoted as Cα, Cβ, and Cγ, respectively. L indicates the periodicity of the ribbons along the edge direction. | |
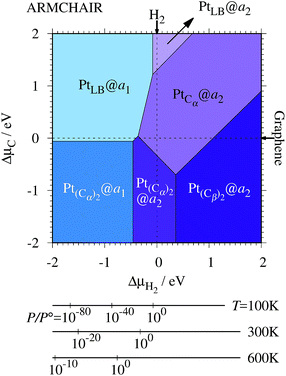 |
| | Fig. 10 The Gibbs free energy for Pt single-atom adsorption at the edges of aGNRs as a function of C and H2 chemical potentials. ΔμC = μC − EGR and ΔμH2 = μH2 − EH2 are C and H2 chemical potentials referenced to the total energies of gas-phase H2 and graphene, respectively. The bottom axes show the corresponding H2 chemical potentials at the absolute temperature T and partial pressure P (with P° = 1 atm), μH2 = H°(T) − H°(0) − TS°(T) + kBT![[thin space (1/6-em)]](https://www.rsc.org/images/entities/char_2009.gif) ln(P/P°), where the enthalpy H° and the entropy S° are obtained from ref. 66. ln(P/P°), where the enthalpy H° and the entropy S° are obtained from ref. 66. | |
Table 3 The Gibbs free energy (ΔΩ) for Pt atom adsorption at aGNRs at μC = EGR and μH = EH2 and the corresponding core level shift (CLS)
|
|
ΔΩ(EGR,EH2)/eV |
CLS/eV |
|
a
1
|
a
2
|
a
1
|
a
2
|
|
Taken from ref. 42.
|
| PtSB |
+0.67 |
−0.32 |
+0.63 |
+0.60 |
| PtLB |
−0.69 |
−0.94 |
+0.44 |
+0.77 |
| PtCα |
−0.35 |
−2.24 |
+1.33 |
+1.33 |
| PtCβ |
+0.91 |
−0.02 |
+1.56 |
+0.82 |
| PtCγ |
+4.15 |
+3.00 |
+2.36 |
+2.33 |
| Pt(Cα)2 |
−0.57 |
−1.90 |
+0.17 |
+0.51 |
| PtCαCβ |
+0.33 |
−1.40 |
+0.53 |
+0.77 |
| Pt(Cβ)2 |
+0.51 |
−1.17 |
−0.11 |
−0.74 |
| PtCβCγ |
+1.48 |
−0.44 |
+0.05 |
−0.03 |
| Expt. |
— |
— |
+2.0 ± 0.4a |
3.4 Impact of the substrate
Here we examine the effect of the substrate, as in the experiment,42 Pt single-atom adsorption has been observed at the step edge of graphite, and the graphene underneath may play some role. We perform the structural optimization with the graphene substrate and calculate the CLS of Pt single-atom at the edge of zGNR. We adopt the adsorption structures with z1 and introduced graphene underneath as shown in Fig. 11. We optimize the structures and calculate the binding energy defined by| |  | (5) |
where EPt@zGNR is the total energies of Pt adsorbed at zGNR (with and without the graphene substrate) and Eref is the total energy of the reference system, where we use perfect z1 and perfect z1 on graphene (z1/GR) as references for the binding energies for a Pt single-atom at z1 and at z1/GR, respectively. Calculated binding energies and corresponding CLSs are summarized in Table 4. We can see that the difference of the binding energies with and without the substrate is insignificant, and in most cases, the substrate plays a role in stabilizing the Pt single-atom adsorption, except for PtCβ@z1. The most stable adsorption structure (PtCα@z1) is unchanged and the binding energy difference is 0.16 eV upon inclusion of the substrate. The substrate does have an insignificant impact on the calculated core level shift, especially for the most stable PtCα@z1. The change is −0.19 eV and the conclusion is unaltered.
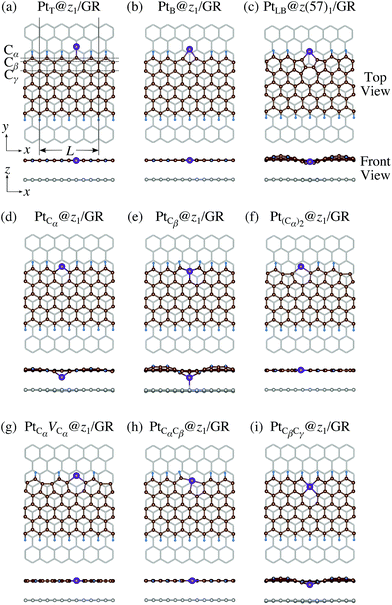 |
| | Fig. 11 Optimized structures of Pt single-atom adsorption at the edges of mono-hydrogenated zGNRs with a graphene substrate. Purple, brown, and light blue spheres represent Pt, C, and H atoms, respectively and the grey honeycomb corresponds to the graphene layer. The first, second, and third outermost C atoms are denoted as Cα, Cβ, and Cγ, respectively. L indicates the periodicity of the ribbons along the edge direction. | |
Table 4 The binding energy (Eb) and the core level shift (CLS) of Pt single-atom adsorption at the edges of z1 with and without the substrate graphene (GR)
|
|
E
b/eV |
CLS/eV |
| w/o GR |
w/GR |
w/o GR |
w/GR |
|
Taken from ref. 42.
|
| PtT@z1 |
−2.19 |
−2.32 |
−0.93 |
−0.94 |
| PtB@z1 |
−0.77 |
−0.88 |
+0.35 |
+0.34 |
| PtLB@z(57)1 |
+1.55 |
+1.70 |
+0.44 |
+0.51 |
| PtCα@z1 |
−2.58 |
−2.74 |
+1.43 |
+1.24 |
| PtCβ@z1 |
−0.44 |
−0.33 |
+1.37 |
+1.99 |
| Pt(Cα)@z1 |
−0.54 |
−0.58 |
+0.24 |
+0.21 |
| PtCαVCα@z1 |
−0.32 |
−0.36 |
+0.54 |
−0.50 |
| PtCαCβ@z1 |
−2.19 |
−2.17 |
+0.81 |
+0.81 |
| PtCβCγ@z1 |
−0.22 |
−0.01 |
+0.82 |
+0.78 |
| Expt |
— |
— |
+2.0 ± 0.4a |
4 Discussion
Experimentally, both zigzag and armchair edges coexist depending on the environment. Thus, it is desirable to compare the stability of single Pt atoms adsorbed at the edges of zGNR and aGNR on the same footing, and investigate the favorable adsorption site when both edges are exposed. For this purpose, we define the binding energy of a single Pt atom as| |  | (6) |
where EPt@z(a)GNR and Ez(a)GNR are total energies of Pt adsorbed zGNR (aGNR) and pristine zGNR (aGNR), respectively. We note that the total energy of the most stable form of GNR at a given μH2 is used as a reference (Ez(a)GNR, see also Fig. 2). Eb is an indicator of the strength of Pt single-atom adsorption and can be used to discuss the stability of Pt when both zGNR and aGNR are present. Calculated Eb's as a function of μC and μH2 (phase diagram) are shown in Fig. 12 and those at μC = EGR and μH2 = EH2 are summarized in Table 5. We find that although aGNRs and Pt adsorbed aGNRs are thermodynamically more stable than zGNRs in terms of the Gibbs free energy (see Tables 3 and 2), Pt adsorption at the edges of zGNRs is more favorable. This suggests that when armchair and zigzag edges coexist, single Pt atoms prefer to adsorb at the zigzag edge. At around μC = EGR, PtCα@z1 and PtCβ@z2 are the most likely adsorption structures. In particular, the calculated CLS for the former agrees reasonably with the experimental one, and thus, we conclude that PtCα@z1 is the most probable structure. Note that at −0.38 eV ≤ ΔμH2 ≤ −0.22 eV, Pt(Cα)2@a2 appears as a stable structure among PtCαCβ@z1. This narrow a2 region corresponds to the region where intersections of formation energies are found (Fig. 2) and the stable (unstable) phase is determined by a subtle energy balance. As a result, a2 becomes unstable, i.e., more reactive, and Pt(Cα)2@a2 emerges as a stable adsorption structure. To determine the precise stability (boundary) when the different phases compete, however, more accurate and precise calculation of total energy is required. Nevertheless, the stability at around μC = EGR and μH2 = EH2 is unaffected, and we pursue this in future work. Very recently, Yamazaki et al. proposed the threefold-coordinated Pt atom at the edges of graphene flakes based on X-ray photoelectron spectroscopy and DFT calculations,42 which contradicts our finding that the thermodynamically most stable configuration (PtCa@z1) has a twofold-coordinated Pt atom. On the other hand, the metastable PtCβ@z1 in our study, which has a threefold-coordinated Pt atom, gives relatively large binding energy and reasonable CLS, and we do not rule out the possibility of the threefold-coordinated Pt atom at the edge at this point. To resolve the discrepancy, we may need to employ the state-of-the-art theoretical method to calculate the absolute binding energy,67 and to investigate the models for the graphene edge, because we and Yamazaki et al. use different models (GNR and graphene flakes, respectively) for the graphene edge. Nevertheless, we can conclude that the Pt single-atom adsorption takes place dominantly at the edge of graphene, and determination of a more precise position and CLS will be done in the near future.
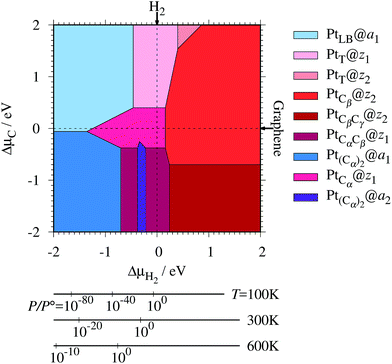 |
| | Fig. 12 The binding energy for Pt single-atom adsorption at the edge of GNRs as a function of C and H2 chemical potentials. The chemical potentials of C (ΔμC) and H2 (ΔμH2) are referenced to the total energies of graphene and gas-phase H2 molecule at 0 K, respectively. The bottom axes show the corresponding H2 chemical potentials at the absolute temperature T and partial pressure P (with P° = 1 atm), μH2 = H°(T) − H°(0) − TS°(T) + kBT![[thin space (1/6-em)]](https://www.rsc.org/images/entities/char_2009.gif) ln(P/P°), where the enthalpy H° and the entropy S° are obtained from ref. 66. ln(P/P°), where the enthalpy H° and the entropy S° are obtained from ref. 66. | |
Table 5 The binding energies (Eb) of the favorable Pt single-atom adsorption configurations at μC = EGR and μH = EH2
| Configuration |
E
b/eV |
| PtT@z1 |
−2.19 |
| PtCα@z1 |
−2.58 |
| PtCαCβ@z1 |
−2.19 |
| PtT@z2 |
−0.72 |
| PtCβ@z2 |
−1.82 |
| PtCβCγ@z2 |
−1.13 |
| PtLB@a1 |
−0.61 |
| Pt(Cα)2@a1 |
−0.49 |
| Pt(Cα)2@a2 |
−1.82 |
Here, let us discuss the oxidation state of a single Pt atom, as it is crucial to the understanding of its catalytic activity. We calculated the density of states projected on the atomic orbitals of Pt for PtCα@z1 (Fig. S3 in the ESI†), which gives CLS in good agreement with the experimental value. We found that the Pt d states hybridize with the GNR state. In particular, the Pt dxy state hybridizes strongly with the C sp state and forms a fully unoccupied antibonding state, resulting in the formal oxidation state of 2+. We also performed the Bader charge analysis (Table S2 in the ESI†), and found that it is not straightforward to assign the oxidation state of Pt only from the Bader charge analysis, especially those at the edges, because of the strong hybridization of Pt d states with GNR.
5 Conclusions
We present a systematic density functional theory-based thermodynamics study of Pt single-atom adsorption on graphene. We find that single Pt atoms adsorb more preferably at the graphene edge than on the bulk. Although pristine aGNR is thermodynamically more stable than zGNR under a wide range of hydrogen pressure, single Pt atoms preferably adsorb at the edge of hydrogenated zGNR. The calculated core level shifts for the stable structures are in reasonable agreement with the experiment, supporting our findings. Our study will serve as a basis for further investigation of the catalytic activity of single-atom catalysts based on single Pt atoms and graphene based nanostructures.
Conflicts of interest
There are no conflicts to declare.
Acknowledgements
We thank Professor Kazutoshi Gohara for providing ref. 42 prior to publication. This work was partially supported by the Advanced Catalytic Transformation Program for Carbon Utilization (ACT-C) of the Japan Science and Technology Agency, by Grants-in-Aid for Scientific Research on Innovative Areas 3D Active-Site Science (JP26105010, JP26105011, and JP15K21719) from the Japan Society for the Promotion of Science, and by the Elements Strategy Initiative for Catalysts and Batteries supported by the Ministry of Education, Culture, Sports, Science, and Technology, Japan. S. A. W. acknowledges financial support by the Marubun Research Promotion Foundation and WCU-ITB Sandwich Program. Numerical calculations were performed by using the computer facilities at the Institute for Solid State Physics, University of Tokyo, at the HPCI systems provided by Nagoya University, at the University of Tokyo, and at Tohoku University through the HPCI System Research Project (Project ID: hp130112, hp140166, and hp150201).
References
- P. Costamagna and S. Srinivasan, J. Power Sources, 2001, 102, 242–252 CrossRef CAS.
- H. Liu, C. Song, L. Zhang, J. Zhang, H. Wang and D. P. Wilkinson, J. Power Sources, 2006, 155, 95–110 CrossRef CAS.
- H. A. Gasteiger, N. M. Marković, P. N. Ross and E. J. Cairns, Electrochim. Acta, 1994, 39, 1825–1832 CrossRef CAS.
- A. Kabbabi, R. Faure, R. Durand, B. Beden, F. Hahn, J. M. Leger and C. Lamy, J. Electroanal. Chem., 1998, 444, 41–53 CrossRef CAS.
- B. N. Grgur, N. M. Marković and P. N. Ross, J. Phys. Chem. B, 1998, 102, 2494–2501 CrossRef CAS.
- H. A. Gasteiger, N. M. Marković and P. N. Ross, Catal. Lett., 1996, 36, 1–8 CrossRef CAS.
- M. Watanabe, Y. Zhu and H. Uchida, J. Phys. Chem. B, 2000, 104, 1762–1768 CrossRef CAS.
- H. Igarashi, T. Fujino, Y. Zhu, H. Uchida and M. Watanabe, Phys. Chem. Chem. Phys., 2001, 3, 306–314 RSC.
- J. Lai, R. Luque and G. Xu, ChemCatChem, 2015, 7, 3206–3228 CrossRef CAS.
- T. Ozaki, J.-I. andi Anahara, N. Kimura and A. Oya, Carbon, 2006, 44, 3358–3361 CrossRef.
- J.-I. Ozaki, N. Kimura, T. Anahara and A. Oya, Carbon, 2007, 45, 1847–1853 CrossRef CAS.
- P. H. Matter, E. Wang, M. Arias, E. J. Biddinger and U. S. Ozkan, J. Mol. Catal. A: Chem., 2007, 264, 73–81 CrossRef CAS.
- X. Huang, Y. Wang, W. Li and Y. Hou, Sci. China: Chem., 2017, 60, 1494–1507 CrossRef CAS.
- F. Rodríguez-Reinoso, I. Rodríguez-Ramos, C. Moreno-Castilla, A. Guerrero-Ruiz and J. D. López-González, J. Catal., 1986, 99, 171–183 CrossRef.
- T. Yoshitake, Y. Shimakawa, S. Kuroshima, H. Kimura, T. Ichihashi, Y. Kubo, D. Kasuya, K. Takahashi, F. Kokai, M. Yudasaka and S. Iijima, Phys. Rev. B: Condens. Matter Mater. Phys., 2002, 323, 124–126 CrossRef CAS.
- E. Yoo, T. Okata, T. Akita, M. Kohyama, J. Nakamura and I. Honma, Nano Lett., 2009, 9, 2255–2259 CrossRef CAS PubMed.
- J. Oh, T. Kondo, D. Hatake, Y. Iwasaki, Y. Honma, Y. Suda, D. Sekiba, H. Kudo and J. Nakamura, J. Phys. Chem. Lett., 2010, 1, 463–466 CrossRef CAS.
- J. Nakamura, Carbon, 2015, 85, 443–444 CrossRef.
- K. Ding, A. Gulec, A. M. Johnson, N. M. Schweitzer, G. D. Stucky, L. D. Marks and P. C. Stair, Science, 2015, 350, 189–192 CrossRef CAS PubMed.
- L. Xin, F. Yang, S. Rasouli, Y. Qiu, Z.-F. Li, A. Uzunoglu, C.-J. Sun, Y. Liu, P. Ferreira, W. Li, Y. Ren, L. A. Stanciu and J. Xie, ACS
Catal., 2016, 6, 2642–2653 CrossRef CAS.
- H. C. Dam, N. T. Cuong, N. A. Tuan, Y.-T. Kim, H. T. Bao, T. Mitani, T. Ozaki and H. Nagao, Chem. Phys. Lett., 2006, 432, 213–217 CrossRef.
- H. C. Dam, N. T. Cuong, A. Sugiyama, T. Ozaki, A. Fujiwara, T. Mitani and S. Okada, Phys. Rev. B: Condens. Matter Mater. Phys., 2009, 79, 115426 CrossRef.
- K. Okazaki-Maeda, Y. Morikawa, S. Tanaka and M. Kohyama, Surf. Sci., 2010, 604, 144–154 CrossRef CAS.
- T. L. Pham, P. V. Dung, A. Sugiyama, N. D. Duc, T. Shimoda, A. Fujiwara and D. H. Chi, Comput. Mater. Sci., 2010, 49, S15–S20 CrossRef CAS.
- M. Zhou, A. Zhang, Z. Dai, C. Zhang and Y. P. Feng, J. Chem. Phys., 2010, 132, 194704 CrossRef PubMed.
- Y. Tang, Z. Yang and X. Dai, Phys. Chem. Chem. Phys., 2012, 14, 16566–16572 RSC.
- I. Fampiou and A. Ramasubramaniam, J. Phys. Chem. C, 2012, 116, 6543–6555 CrossRef CAS.
- K. E. Hayes and H.-S. Lee, Chem. Phys., 2012, 393, 96–106 CrossRef CAS.
- J. Russell, P. Zapol, P. Král and L. A. Curtiss, Chem. Phys. Lett., 2012, 536, 9–13 CrossRef CAS.
- A. Chutia, I. Hamada and M. Tokuyama, Surf. Sci., 2014, 628, 116–125 CrossRef CAS.
- R. J. Gasper and A. Ramasubramaniam, J. Phys. Chem. C, 2016, 120, 17408–17417 CrossRef CAS.
- H. Shi, S. M. Auerbach and A. Ramasubramaniam, J. Phys. Chem. C, 2016, 120, 11899–11909 CrossRef CAS.
- C. R. C. Rêgo, P. Tereshchuk, L. N. Oliveira and J. L. F. Da Silva, Phys. Rev. B: Condens. Matter Mater. Phys., 2017, 95, 235422 CrossRef.
- M. Mahmoodinia, P.-O. Åstrand and D. Chen, J. Phys. Chem. C, 2017, 121, 20802–20812 CrossRef CAS.
- S. Sun, G. Zhang, N. Gauquelin, N. Chen, J. Zhou, S. Yang, W. Chen, X. Meng, D. Geng, M. N. Banis, R. Li, S. Ye, S. Knights, G. A. Botton, T.-K. Sham and X. Sun, Sci. Rep., 2013, 3, 1775 CrossRef.
- N. Cheng, S. Stambula, D. Wang, M. N. Banis, J. Liu, A. Riese, B. Xiao, R. Li, T.-K. Sham, L.-M. Liu, G. A. Botton and X. Sun, Nat. Commun., 2016, 7, 13638 CrossRef CAS PubMed.
- S. Back, J. Lim, N.-Y. Kim, Y.-H. Kim and Y. Jung, Chem. Sci., 2017, 8, 1090–1096 RSC.
- K.-J. Kong, Y. Choi, B.-H. Ryu, J.-O. Lee and H. Chang, Mater. Sci. Eng., C, 2006, 26, 1207–1210 CrossRef CAS.
- H. Wang, K. Li, Y. Cheng, Q. Wang, Y. Yao, U. Schwingenschlögl, X. Zhang and W. Yang, Nanoscale, 2012, 4, 2920–2925 RSC.
- J. Zhao, Q. Deng, S. M. Avdoshenko, L. Fu, J. Eckert and M. H. Rümmeli, Proc. Natl. Acad. Sci. U. S. A., 2014, 111, 15641–15646 CrossRef CAS PubMed.
- E. Kano, A. Hashimoto and M. Takeguchi, Appl. Phys. Express, 2017, 10, 025104 CrossRef.
- K. Yamazaki, Y. Maehara, C.-C. Lee, J. Yoshinobu, T. Ozaki and K. Gohara, J. Phys. Chem. C, 2018, 122, 27292–27300 CrossRef CAS.
- A. Hashimoto and M. Takeguchi, J. Electron Microsc., 2012, 61, 409–413 CAS.
- T. Tomai, Y. Kawaguchi, S. Mitani and I. Honma, Electrochim. Acta, 2013, 92, 421–426 CrossRef CAS.
- Y. Shen, Z. Zhang, K. Xiao and J. Xi, Phys. Chem. Chem. Phys., 2014, 16, 21609–21614 RSC.
- K. Reuter and M. Scheffler, Phys. Rev. B: Condens. Matter Mater. Phys., 2003, 68, 045407 CrossRef.
- Y. Morikawa, K. Iwata and K. Terakura, Appl. Surf. Sci., 2001, 169–170, 11–15 CrossRef CAS.
- Y. Morikawa, H. Ishii and K. Seki, Phys. Rev. B: Condens. Matter Mater. Phys., 2004, 69, 041403 CrossRef.
- D. Vanderbilt, Phys. Rev. B: Condens. Matter Mater. Phys., 1990, 41, 7892–7895 CrossRef.
- I. Hamada, Phys. Rev. B: Condens. Matter Mater. Phys., 2014, 89, 121103 CrossRef.
- Y. Hamamoto, I. Hamada, K. Inagaki and Y. Morikawa, Phys. Rev. B: Condens. Matter Mater. Phys., 2016, 93, 245440 CrossRef.
- G. Román-Pérez and J. M. Soler, Phys. Rev. Lett., 2009, 103, 096102 CrossRef PubMed.
- J. Wu and F. Gygi, J. Chem. Phys., 2012, 136, 224107 CrossRef PubMed.
- J. P. Perdew, K. Burke and M. Ernzerhof, Phys. Rev. Lett., 1996, 77, 3865–3868 CrossRef CAS PubMed.
- M. Callsen and I. Hamada, Phys. Rev. B: Condens. Matter Mater. Phys., 2015, 91, 195103 CrossRef.
- P. Y. Huang, C. S. Ruiz-Vargas, A. M. van der Zande, W. S. Whitney, M. P. Levendorf, J. W. Kevek, S. Garg, J. S. Alden, C. J. Hustedt, Y. Zhu, J. Park, P. L. McEuen and D. A. Muller, Nature, 2011, 469, 389 CrossRef CAS PubMed.
- F. R. Eder, J. Kotakoski, U. Kaiser and J. C. Meyer, Sci. Rep., 2014, 4, 4060 CrossRef PubMed.
- T. Wassmann, A. P. Seitsonen, A. M. Saitta, M. Lazzeri and F. Mauri, Phys. Rev. Lett., 2008, 101, 096402 CrossRef PubMed.
- S. Okada and A. Oshiyama, Phys. Rev. Lett., 2001, 87, 146803 CrossRef CAS PubMed.
- H. Lee, Y.-W. Son, N. Park, S. Han and J. Yu, Phys. Rev. B: Condens. Matter Mater. Phys., 2005, 72, 174431 CrossRef.
- S. A. Wella, H. Sawada, N. Kawaguchi, F. Muttaqien, K. Inagaki, I. Hamada, Y. Morikawa and Y. Hamamoto, Phys. Rev. Mater., 2017, 1, 061001 CrossRef.
- Y. Baskin and L. Meyer, Phys. Rev., 1955, 100, 544 CrossRef CAS.
- E. Pehlke and M. Scheffler, Phys. Rev. Lett., 1993, 71, 2338–2341 CrossRef CAS PubMed.
- S. García-Gil, A. García and P. Ordejón, Eur. Phys. J. B, 2012, 85, 239 CrossRef.
-
F. A. Kröger and H. J. Vink, in Relations between the Concentrations of Imperfections in Crystalline Solids, ed. F. Seitz and D. Turnbull, Academic Press, 1956, vol. 3, pp. 307–435 Search PubMed.
-
M. W. Chase Jr, C. A. Davies, J. R. Downey Jr, D. J. Frurip, R. A. McDonald and A. N. Syverud, NIST-JANAF Thermochemical Tables, J. Phys. Chem. Ref. Data, Monograph 9, 4th edn, 1998, pp. 1–1951 Search PubMed.
- T. Ozaki and C.-C. Lee, Phys. Rev. Lett., 2017, 118, 026401 CrossRef PubMed.
Footnote |
| † Electronic supplementary information (ESI) available: Functional dependence study on the stability of graphene nanoribbons and electronic structure analysis of single platinum atoms at the graphene edge. See DOI: 10.1039/c8na00236c |
|
| This journal is © The Royal Society of Chemistry 2019 |
Click here to see how this site uses Cookies. View our privacy policy here.  Open Access Article
 ab,
Yuji
Hamamoto
 ac,
Suprijadi
 b,
Yoshitada
Morikawa
 acd and
Ikutaro
Hamada
 *ac
*ac
 and
and  supercells of graphene for zGNR and aGNR, respectively, and graphene planes are separated by a vacuum of ∼15 Å thickness. Vacuum thicknesses between edges are 16.48 Å and 18.70 Å for zGNR and aGNR, respectively. Brillouin zone integration is performed using the Γ-centered 6 × 2 k-point set for both zGNR and aGNR. All the graphene based structures considered in this work are constructed using the lattice constant of graphene obtained using rev-vdW-DF2 (2.46 Å),61 which is in good agreement with the experimental value for graphite (2.4589 ± 0.0005 Å).62 The structures are fully relaxed until the forces acting on the atoms become smaller than 5.14 × 10⁻² eV Å−1 (1 × 10⁻³ Hartree/Bohr). The Pt 4f CLS including the final state screening is calculated as the difference between the core level binding energy of Pt adsorbed GNR and bulk Pt.63,64


![[thin space (1/6-em)]](https://www.rsc.org/images/entities/char_2009.gif) ln(P/P°), where the enthalpy H° and the entropy S° are obtained from ref. 66.
ln(P/P°), where the enthalpy H° and the entropy S° are obtained from ref. 66.
![[thin space (1/6-em)]](https://www.rsc.org/images/entities/char_2009.gif) ln(P/P°), where the enthalpy H° and the entropy S° are obtained from ref. 66.
ln(P/P°), where the enthalpy H° and the entropy S° are obtained from ref. 66.


![[thin space (1/6-em)]](https://www.rsc.org/images/entities/char_2009.gif) ln(P/P°), where the enthalpy H° and the entropy S° are obtained from ref. 66.
ln(P/P°), where the enthalpy H° and the entropy S° are obtained from ref. 66.


