
 Open Access Article
 This Open Access Article is licensed under a Creative Commons Attribution-Non Commercial 3.0 Unported Licence
Microfluidic Schottky-junction photovoltaics with superior efficiency stimulated by plasmonic nanoparticles and streaming potential†
Mitradip
Bhattacharjee‡
a,
Seim
Timung‡
b,
Tapas Kumar
Mandal‡
ab and
Dipankar
Bandyopadhyay‡
 *ab
*ab
aCentre for Nanotechnology, Indian Institute of Technology Guwahati, Guwahati, India. E-mail: dipban@iitg.ernet.in
bDepartment of Chemical Engineering, Indian Institute of Technology Guwahati, Guwahati, India
First published on 17th December 2018
Abstract
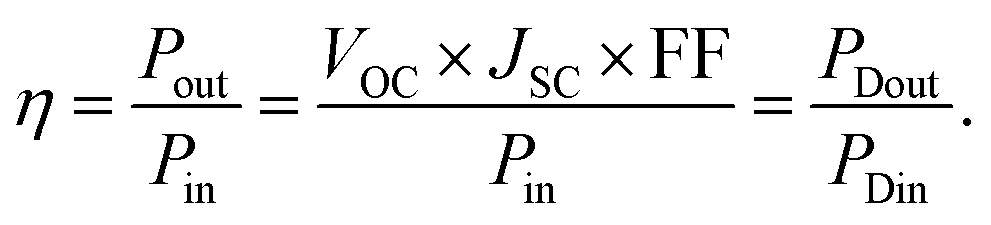
A droplet energy harvester (DEH) composed of aqueous salt solution could generate electrical energy from light when placed on a metal–semiconductor Schottky-junction emulating the principles of electrochemical photovoltaics (ECPV). The maximum potential difference generated was ∼95 mV under sun, which was enhanced by ∼1.5 times after the addition of gold nanoparticles (AuNPs) in the droplet because of the generation of additional charge carriers from the localized surface plasmon resonance (LSPR). Focusing the solar illumination through a bi-convex lens on five such droplets increased the voltage to ∼320 mV with a power density of ∼0.25 mW cm−2. When the DEH was converted to a microfluidic energy harvester (MEH) by flowing the AuNP laden salt solution through a microchannel integrated with an array of Schottky-junction electrodes, at an optimal flow rate, another two-fold increase in the power density was observed. In the MEH, because the ECPV aided by the LSPR converted the solar energy into electrical energy, the streaming potential (SP) generated across the electrodes because of the fluid flow converted the mechanical energy into electrical energy. Increase in the number of electrode pairs improved the voltage generation, which suggested that the MEH had potential for microscale-very-large-scale-integration (μ-VLSI). The combined effects of ECPV, LSPR, and SP in the MEH could show an efficiency ∼2.5%, which was one of the highest ones reported, for Schottky-junction energy harvesters. This study shows some simple and efficient pathways to harvest high-density electrical power using microchannels and droplets from the naturally abundant solar or hydroelectric (hydel) energy resources.
1. Introduction
In recent times, a rapid progress in the micro and nanoscale technologies has enabled the development of next generation energy harvesters suitable for use in mobile phones, calculators, healthcare devices, laptops, computers, and sensors.1–7 The economic, scalable, proficient, and eco-friendly technologies are envisaged to be able to harvest high-density power from the various naturally abundant resources.1–3 Arguably, this journey started about a hundred years ago with the inventions of the photovoltaic effect,8,9 solar cells,10 and the photoelectric effect,11,12 which initiated the pathways to convert solar energy into electrical power with usable efficiencies.13–17 Subsequently, the inventions of multi-junction solar cells18 and the silicon-based first19 and second19,20 generation solar cells with improved efficiency helped in fulfilling the needs of multifarious portable technologies. Of late, the third generation solar devices21–23 such as the organic24–26 or perovskite cells27 emerged to address the limitations associated with the silicon solar cells. Presently, the focus is on the specialities of nanowires, nanocomposites, nanoparticles, or nanotubes of functional materials28–31 to develop the next generation optoelectronic, photo-electrochemical, dye-sensitized, photovoltaic, and micro or nanofluidic based energy harvesters, which are low cost, eco-friendly, stable, and efficient.32–37In the present paper, the development of a pair of ‘hybrid’ energy harvesters composed of a microdroplet and a microfluidic channel are reported. The proposed energy harvesters are integrated to Schottky-junction electrodes in such a manner that: (i) they convert solar energy into the electrical energy by charge separation and transfer under solar irradiation, (ii) they show enhanced efficiency because of the generation of active charge carriers through localized surface plasmon resonance (LSPR)38 when nanoparticles are suspended inside the fluid medium, and (iii) they generate additional energy when the fluid is flowing though the channel to produce additional streaming potential (SP) across the electrodes. The reported prototypes show some simple pathways to harvest high density electrical power from the solar and hydroelectric (hydel) energy resources at an enhanced efficiency.
It is well known that the Schottky-junction solar cells are in general composed of metal–semiconductors such as the copper–copper(I) oxide (Cu–Cu2O). The specialities of these devices include lower cost, high minority carrier diffusion length, and higher absorption coefficient in the visible region at a theoretical efficiency of ∼20%.39–43 Because the p-type Cu2O has a bandgap of ∼2 eV, the Cu–Cu2O solar energy harvesters show higher efficiencies in the yellow to near UV region than the silica-based solar cells.39–41,44,45 In the past, a variety of solar cells have been constructed using metal/p-Cu2O, n-ZnO/p-Cu2O, or n-CdO/p-Cu2O.42,43,46,47 Since the invention of this phenomenon, the experimental power conversion efficiencies have improved progressively from less than 1%, to about 2% and then to about 8.6% in recent years. The results of previous studies suggest that the maximum efficiency of the Cu–Cu2O based Schottky-junction cells are ∼2%,42,48 which is perhaps the simplest and low cost option in the terms of fabrication. Recently a few researchers have reported that altering the heterojunction cells can be one of the ways to improve the efficiency of these devices.46,47 All these studies have attempted to improve the efficiency of the Cu–Cu2O based Schottky-junction cells because of their extensive use not only as solar energy harvesters but also as supercapacitors,49 photodetectors,42,43 photocatalysts,49 in environmental remediation,50 and in water-splitting,50 amongst others. However, a lot of research activity has been needed to determine the alternatives routes to gain higher efficiencies.
For example, the use of microfluidic devices to develop the Schottky-junction solar cells is found to an entirely unexplored area of research. Recent studies have shown that microfluidic devices can also harvest high density power,51–54 exploiting droplet actuation,53–55 reverse electro-wetting,56 or piezoelectric effects.57 The typical power densities of the micro-power harvesters are envisioned to match the naturally abundant radio frequency (∼1 μW cm−2), solar irradiation (∼100 mW cm−2), ambient illumination (∼100 μW cm−2), thermoelectric devices (∼60 μW cm−2), vibration generators (∼10–800 μW cm−3), or ambient air flow (∼1 mW cm−2).58
Of particular interest here is the design and development of droplet energy harvesters (DEH) and microfluidic energy harvesters (MEH). The DEH consists of a salt-water microdroplet placed at the junction of metal–semiconductor Schottky barrier electrodes, which can convert the solar energy into electrical energy, emulating the principles of electrochemical photovoltaics (ECPV).39–41 Use of suspended gold nanoparticles (AuNPs) inside the microdroplet helps to improve the efficiency the DEH. This happens because of the generation of additional current inside the DEH from the LSPR of AuNPs in the presence of any electromagnetic irradiation present.59–64 Whereas ECPV engenders charge separation and transfer, the LSPR contributes to enhancement of the absorption of visible light to generate a host of additional active charge carriers. In order to achieve higher efficiencies, the DEH is converted into MEH in which the nanoparticle laden salt-water solution flowing inside a microfluidic channel integrated with the Schottky barrier Cu–Cu2O electrodes. The mechanical energy generated because of the flow of the electrolyte generates the SP across the electrodes to harvest additional electrical energy.
In general, solar energy generation using the Schottky-junction solar cells is a batch process, which limits its applicability. The results of the present study show that such systems can be made more efficient with the introduction of the MEH concept. Furthermore, the combined effects of the ECPV, LSPR, and SP in the MEH help in obtaining an efficiency of ∼2.5% under solar irradiation, which is perhaps the highest among the previously reported ones. Experimental evidence uncovered the potential of the proposed prototypes to match the throughput of their macroscopic counterparts with the help of microscale-very-large-scale-integration (μ-VLSI) electrodes, microdroplets and microchannels. It is envisioned that the μ-VLSI of the prototypes can be used to help develop low cost, portable, and economic energy harvesters to supply high-density power to diverse modern day gadgets at a better efficiency.
2. Materials and methods
2.1 Materials
Hydrochloric acid, sodium hydroxide pellets, sodium chloride (NaCl), (all 99.8% pure) were obtained from Merck (India). Gold(III) chloride (HAuCl4·3H2O), sodium borohydride, 98% were obtained from Sigma-Aldrich (India). Poly(dimethylsiloxane) (PDMS, Sylgard 184, Dow Corning) was purchased from Kevin Electrochem (India). The chemicals were of analytical grade and used as received for the study. The Cu wire, glass substrate, double sided tapes, lenses, lasers, bulbs, and light-emitting diodes (LEDs) were purchased from local venders. Milli-Q water was used for cleaning and preparation of the solutions.2.2 Methods
The methodologies used to synthesize AuNPs and Cu2O electrodes are discussed in Section I of the ESI.† Fig. S1 and S2 (ESI†) show the typical characterization results of the AuNPs and Cu2O electrodes, respectively. The Cu2O electrodes were prepared using thermal heating of the Cu wires for different time durations. The electrodes were characterized using Raman spectroscopy (LabRam HR, Horiba Jobin Yvon), X-ray diffraction (D8 Advance, Bruker), and ultraviolet-visible (UV-Vis) spectroscopy (PerkinElmer), as shown in Fig. S3 (ESI†).Fig. 1(A) shows the setup used for the DEH experiments. A water microdroplet of aqueous NaCl solution was dispensed at the junction of a Cu–Cu2O electrodes (diameter: ∼240 μm). Then the microdroplet was exposed to the different light sources such as an incandescent bulb (100 W, 220 V, 50 Hz AC, Bajaj, India), lasers of wavelengths of 650 nm, 532 nm and 405 nm with a maximum output 5 mW (Huonje, China), and direct solar illumination (DSI). The voltage and current were measured using a digital multimeter with a range from 0–200 MΩ ± 1.0% (Mastech, India). The intensity of the light sources was measured using a lux meter (LX-101A, HTC). The concentration of NaCl in the droplet (Cs) and the distance between the artificial light source and the droplet surface (ds) were optimized by evaluating the maximum potential difference obtained for a particular combination of Cs = 4 M and ds = 12.5 cm. The distance was maintained to create a ∼4.5 klx light intensity for all the experiments unless stated otherwise. In order to intensify the power generation, in some of the experiments, a bi-convex lens (6 mm diameter and 10 cm focal length) was used to focus solar illumination on the DEH.
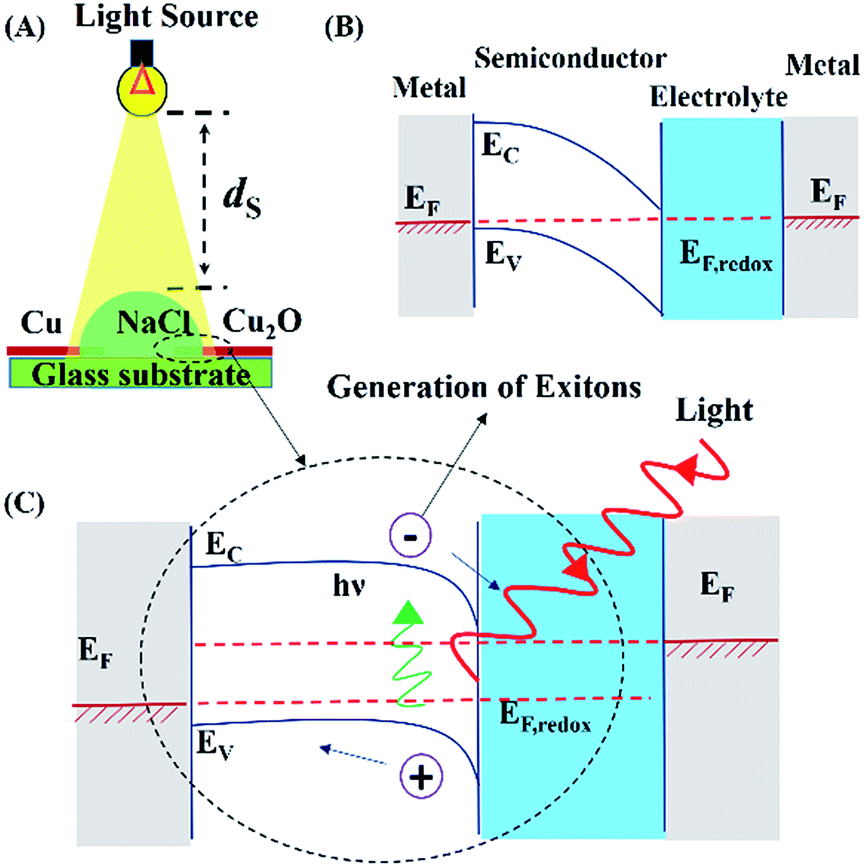 | ||
| Fig. 1 Image (A) shows the experimental set-up in which a droplet of aqueous solution of NaCl was dispensed between the Cu and Cu2O electrodes before being illuminated by a light source from the top. The electrodes were placed on a glass slide as shown. Images (B) and (C) schematically show the band diagrams of the configuration in the absence and presence of the photo-excitations, respectively. The notations EF, Ec, and Ev indicate the Fermi level and energy levels for the conduction and valance bands, respectively. The notation EF,redox denotes the Fermi level in the electrolyte. | ||
The setup shown in the Fig. 1(A) was also used for the MEH experiments except that the DEH was replaced by a microchannel integrated with the Cu–Cu2O electrodes. The methods to prepare such microchannels and the cleaning protocol before experimental use are discussed in Section II (ESI†). For the MEH experiments, the aqueous salt solution flowed through the microchannel with the help of a dual syringe pump (PHD 2000, Harvard Apparatus) at different flow rates. The MEH experiments were conducted under the same set of light exposures which were used for the DEH experiments. Again, in order to intensify the power generation, a bi-convex lens was used to focus the solar illumination on the MEH.
In order to determine the influence of AuNPs on the power generation, the DEH and MEH experiments were conducted when the aqueous NaCl solution (4.0 M) was loaded with AuNPs at different volume ratios (v/v). The AuNP laden fluid was irradiated with lasers of wavelengths 650 nm, 532 nm, and 405 nm to investigate the effect of the LSPR on the power generated. Additionally, AuNP laden fluid experiments were also performed with a LED 100 W bulb, and under solar illumination. The experimental setup used to evaluate the efficiency of the proposed DEH and MEH is shown in Fig. S4 (ESI†). The procedure to evaluate the efficiency of the different DEH and MEH prototypes are discussed in detail, in Section III (ESI†).
3. Results and discussion
3.1 Droplet energy harvester
Fig. 1(A) shows the setup for the DEH experiments. The DEH setup resembled an electrochemical photovoltaic (ECPV) system composed of a glass substrate, a semiconductor p-type Cu2O electrode, an electrolyte microdroplet of aqueous NaCl solution, and a metal Cu counter electrode. The droplet of 4 M aqueous NaCl solution was dispensed at the junction of the Cu and Cu2O electrodes before a 100 W incandescent bulb with a light intensity of ∼4.5 klx was illuminated from a vertical distance of ds = 12.5 cm. The bulb could generate a potential difference of ∼43 mV across the Cu–Cu2O electrodes, as shown in Video S1 (ESI†). The control experiments described in Video S2 (ESI†) show that the use of a pair of Cu electrodes could not generate any such potential difference under similar conditions.Images (B) and (C) in Fig. 1 show the energy band diagrams of DEH under dark and illuminated conditions. In these diagrams, the metal on the right hand side is the Cu electrode (grey zone) having a Fermi level of EF, which is coated with the Cu2O semiconductor (white zone) having a band gap of (Ec − Ev), between the conduction (Ec) and the valance (Ev) bands. The Cu2O-electrolyte (blue zone) which has a Fermi level of EF,redox is integrated to the counter Cu electrode (metal, grey zone) in the left hand side which has a Fermi level of EF. The energy band diagrams follow the same order of materials decorated on the glass substrate from right to left, as shown in Fig. 1(A). The image (C) suggests that the proposed arrangement could generate excitons upon electromagnetic excitation (E = hν) when the electrons from the valance band of the semiconductor Cu2O electrode jump to the conduction band. Consequently, the electrons reduce the Na+ concentration in the electrolyte whereas the holes reach the Cu counter electrode through the external circuit to oxidize the Cl− in the electrolyte. Over a long period, the reduced (oxidized) Na+ (Cl−) on the Cu2O (Cu) electrode transfer back to the electrolyte to enable the ECPV arrangement to become a regenerative one.65
Fig. 2(A) shows the variations in the potential difference (VD) and current density (JD) across the droplet for different concentrations of NaCl (Cs). The plots show that VD and JD were amplified with the increase in Cs because of the enhancement in the electrical conductance of the microdroplet. Fig. 2(B) shows that the VD was enhanced significantly as the light intensity was increased by bringing the light source closer to the DEH. Fig. 2(C) shows that the phenomenon was repeatable because a finite VD was observed when the light source was turned ‘on’ and decreased when it was turned ‘off’ for three consecutive cycles. It is important to note that, Fig. 2(D) and Video S3 (ESI†) suggest that the potential difference was maximum at ∼90 mV when the DEH was exposed to DSI with an intensity of 24 klx. The experiment highlighted the potential of the DEH-ECPV prototype for solar energy harvesting.
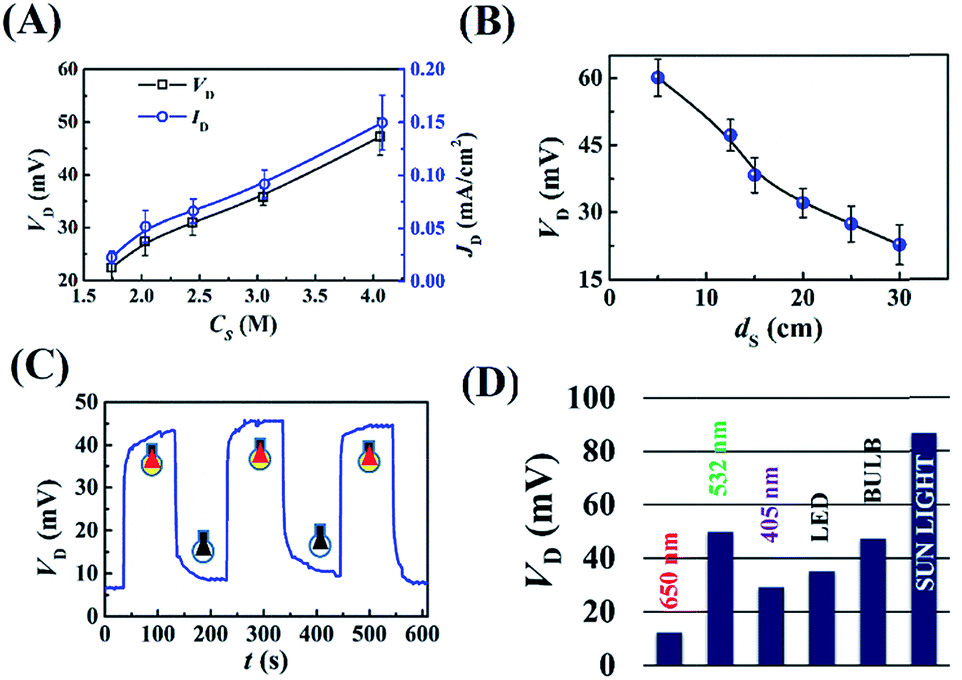 | ||
| Fig. 2 Image (A) shows the variations in the voltage generated (VD) and the current density (JD) when the NaCl concentration (CS) in the droplet was varied. Image (B) shows the change in VD as the distance between the light source and the droplet (ds) was varied. Image (C) illustrates the variation in VD when the light source was turned on and off for three consecutive cycles. Image (D) shows the variation in VD for different light sources such as red laser (650 nm), green laser (532 nm), blue laser (405 nm), LED, incandescent bulb, and solar illumination of ∼24 klx. | ||
Fig. 3 shows a few strategies for improving the efficiency of the DEH-ECPV system. The graph in Fig. 3(A) shows that the power density, PD (=VD × JD), of the DEH increased with the reduction in the droplet volume (ΦD). The results highlight the importance of miniaturisation for improving the power density of such systems. In this case, PD improved because the VD and JD did not decrease significantly with the marked reduction in the surface area of the droplet at a very low ΦD. The results in Fig. 3(B) show that when the DEH was loaded with different proportions of AuNPs (CAu – %v/v), the VD initially increased with the AuNP loading and reached a maximum value before reducing. The results of control experiments suggested that the phenomenon was only possible when the nanoparticles of the noble metals such as AuNPs were used. For example, Fig. S5 (ESI†) shows that use of nickel nanoparticles led to a reduction in VD. Fig. 3(B) suggests that the optimum CAu was found to be ∼20% (v/v) in 4 M aqueous NaCl solution for which VD was ∼100 mV when the light source was a green laser.
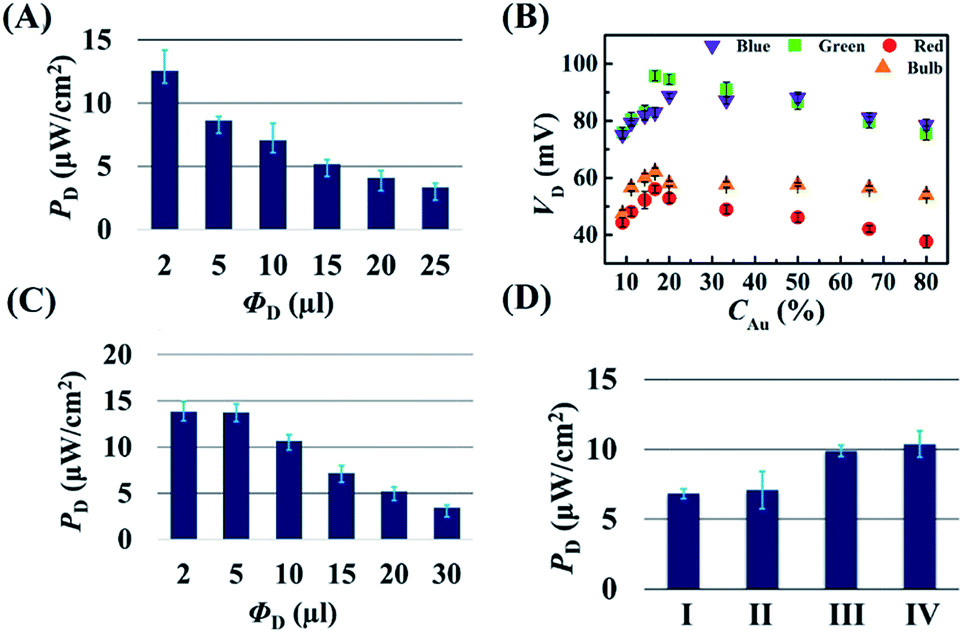 | ||
| Fig. 3 Plot (A) shows the power density (PD) for 4 M aqueous NaCl microdroplets of different volumes (ΦD) under a 100 W bulb when ds = 12.5 cm. Image (B) shows the variation in VD when the AuNPs were loaded inside the 4 M aqueous NaCl droplet in different proportions (CAu as %, v/v). The plots also show the influence of different light sources on the NaCl droplets. Image (C) shows the power density for AuNP laden salt water droplets of different volumes (ΦD) with a 20% AuNP loading. Image (D) shows the PD for: (I) 500 μl 4 M NaCl solution film with a 1 cm × 2 cm area, (II) 4 M NaCl droplet of 10 μl, (III) 500 μl 4 M NaCl solution film with a 1 cm × 2 cm area with 20% AuNP loading, (IV) 4 M NaCl droplet of 10 μl with 20% AuNP loading. In the images (A), (C) and (D) the intensity of the light was ∼4.5 klx. | ||
Fig. 3(C) shows that the PD improved significantly for an AuNP laden DEH for a smaller ΦD. Fig. 3(D) illustrates the variation in VD for four different systems: (I) a film with a 1 cm × 2 cm area composed of 500 μl of a 4 M aqueous NaCl solution, (II) with a 4 M aqueous NaCl droplet of 10 μl, (III) a film with a 1 cm × 2 cm area composed of 500 μl of 4 M aqueous NaCl solution with 20% AuNPs, and (IV) a 4 M aqueous NaCl droplet of 10 μl with 20% AuNPs. All the systems were illuminated with a 100 W bulb from 12.5 cm at ∼4.5 klx. The experiments showed that AuNP loaded microdroplets had a more efficient harvesting power than the similar thin film based systems. Briefly, the Fig. 2 shows that about a 1.5- to a 2-fold rise in VD and PD is possible with the reduction in size of the droplet and the use of an optimum level of AuNPs in the DEH.
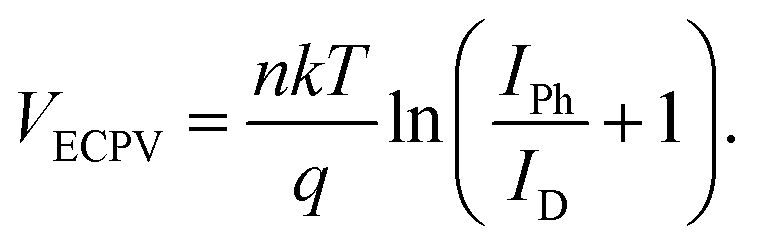
The schematic illustrations in Fig. 4(A) show the effects of AuNPs as active charge carriers. In this analysis, it was assumed that the energy levels of AuNPs were still non-discrete and similar to those of bulk materials,66 which ensure that the Fermi level is same as the work function. Thus, under electromagnetic irradiation (E = hν), the LSPR of AuNPs generated an induced dipolar energy band separation of the electron (e−) and holes (h+) at the metal–electrolyte interface, as shown in the Fig. 4(A). Subsequently, a flurry of additional active charge carriers was created as the photoelectrons travel from the AuNPs to the electrolyte and then to the conduction band of Cu2O. The open circuit voltage (VOC) for this system can be determined from: VOC = EC − μ, where the chemical potential of the electrolyte is μ and the potential of the conduction band of Cu2O is EC. The enhancement of VOC can be explained by reduction in the chemical potential (μ′) of the electrolyte under solar irradiation because the generation of the electric field was: μ′ = μ − qV. Here, q is the charge inside the system and V is the potential of the external electric field. Subsequently, the increase in the photocurrent can be correlated by the pumping of carriers at a higher rate because of the presence of a stronger electric field associated with LSPR coupled with ECPV.
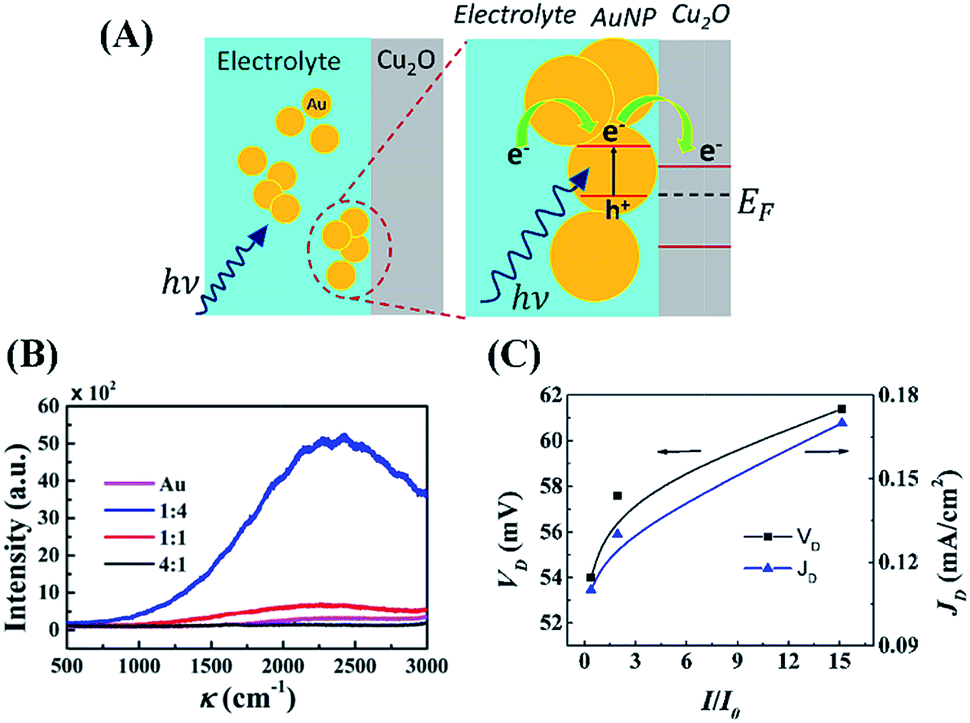 | ||
Fig. 4 A schematic diagram (A) which briefly describes the LSPR in the DEH-ECPV system. Image (B) shows the Raman spectroscopy results for AuNP in aqueous 4 M NaCl solution at different AuNP loadings (e.g., 1![[thin space (1/6-em)]](https://www.rsc.org/images/entities/char_2009.gif) :4, 1:1, and 4:1). Image (C) shows variations in the voltage generated (VD) and current density (JD) with increase in the normalized Raman intensity (I/I0). The intensity of the light was ∼4.5 klx for all the experiments. :4, 1:1, and 4:1). Image (C) shows variations in the voltage generated (VD) and current density (JD) with increase in the normalized Raman intensity (I/I0). The intensity of the light was ∼4.5 klx for all the experiments. | ||
Fig. 4(B) shows the Raman spectra with 488 nm laser excitation of the AuNP loaded aqueous NaCl solution at different proportions, which confirmed the maximum surface enhanced Raman scattering (SERS) when 1:4 (v/v) AuNP- aqueous NaCl was used.67–69 The SERS results corroborated with the maximum voltage generation of the droplet composed of aqueous NaCl solution with ∼20% (v/v) AuNP loading, as shown in Fig. 3(B). The transmission electron microscopy images in Fig. S6 (ESI†) show that with increase of CAu the AuNPs agglomerated, which led to the reduction in the LSPR.70 The agglomeration of AuNPs was also supported by the shifting and broadening of the peaks in UV-Vis spectra at higher loading, as shown in Fig. S6 (ESI†). Fig. 4(C) shows the increase in the generated voltage (VD) and current density (JD) because of the increase in the normalized Raman intensity (I/I0). Briefly, Fig. 3 and 4 summarize the mechanisms of the enhancement of power density of DEH through LSPR and miniaturisation.
Fig. 5 shows that the properties of the electrodes could play important roles in improving the VD for the DEH-ECPV systems. Fig. 5(A) shows that the VD increased with the diameter of the electrodes (dE). However, the electrodes with a diameter of ∼240 μm were used for the experiments because beyond this diameter the increase in VD was not so profound. The effect of the time duration (th) of the thermal heating on the growth of Cu2O on the Cu electrodes was also studied. Fig. 5(B) shows that with the increase in th the performance of Cu2O–Cu system improved. The results in Fig. 5(B) also suggest that heating a Cu microwire for th ∼80 s could provide the optimal Cu2O electrode. Interestingly, with the increase in the number of electrode pairs (NE) the value of PD also increased, as shown in the Fig. 5(C). The results shown in the graph suggest that the increase in the total surface area of the electrodes for the charge transfer increased the efficiency of the proposed DEH-ECPV system. Furthermore, the results opened up the possibility of μ-VLSI occurring because of the integration of multiple electrodes under each DEH-ECPV system to extract more power.
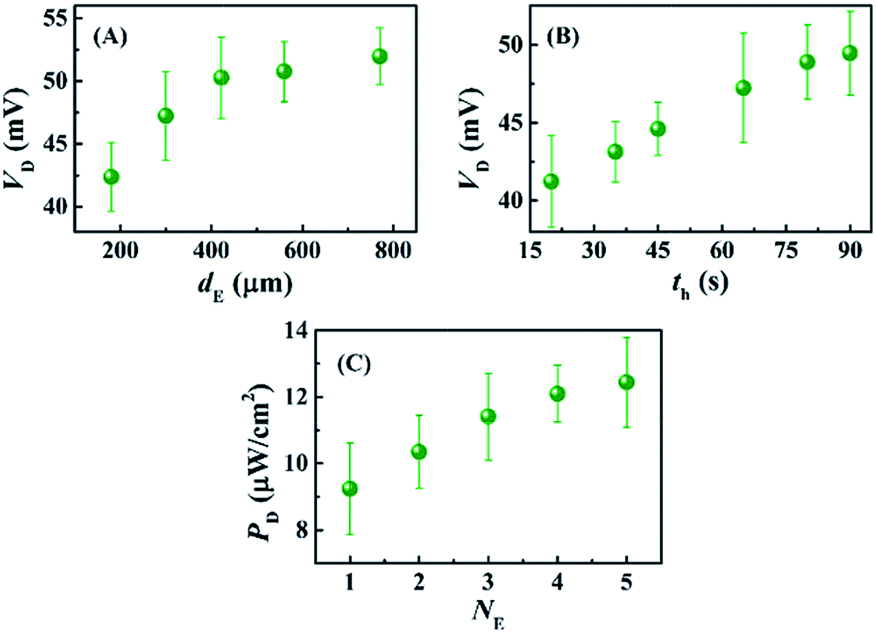 | ||
| Fig. 5 This image shows the variations in VD with (A) different electrode diameters (dE), (B) different electrode heating times (th), and variations in PD with (C) number of electrodes (NE). | ||
Fig. 6 summarizes the performance of the DEH-ECPV system under DSI and focussed solar illuminations (FSI), as shown in Fig. 6(A). Video S3 (ESI†) shows that, although the response of the prototype was maximal under DSI, it could be further enhanced using FSI on the DEH with the help of a bi-convex lens. Fig. 6(B) shows the variations in VD for three different conditions: (i) DSI on a droplet of 4 M aqueous NaCl solution, (ii) DSI on a droplet of 4 M aqueous NaCl solution with 20% AuNPs, and (iii) FSI on a droplet of 4 M aqueous NaCl solution with 20% AuNPs. Whereas the DSI could generate about ∼90 mV of potential difference, use of FSI could increase the potential difference up to ∼120 mV in presence of 20% AuNPs, as shown in Fig. 6(B). Remarkably, the use of five such DEHs could enhance the VD to about 300 mV as shown in Fig. 6(C).
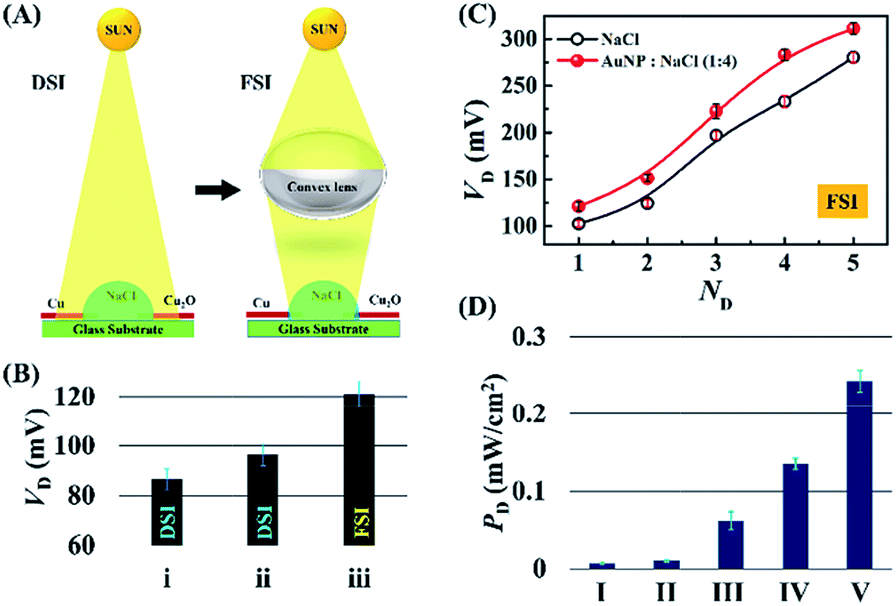 | ||
| Fig. 6 Image (A) shows the schematic diagram of the experimental set-up under direct solar illumination (DSI) and focussed solar illumination (FSI). Image (B) shows the variations in generated voltage VD for three different conditions: (i) DSI on a droplet of 4 M aqueous NaCl solution, (ii) DSI on a droplet of 4 M aqueous NaCl solution with 20% AuNPs, and (iii) FSI on a droplet of 4 M aqueous NaCl solution with 20% AuNPs. Image (C) shows the variations in VD under FSI with the number of DEH (ND) composed of 4 M aqueous NaCl solution and 4 M aqueous NaCl solution with 20% AuNPs. Image (D) shows the variation in PD for: (I) 4 M aqueous NaCl droplet under a 100 W bulb, (II) 4 M aqueous NaCl droplet with 20% AuNP loading under a 100 W bulb, (III) 4 M aqueous NaCl droplet with 20% AuNP under a green laser, (IV) 4 M aqueous NaCl droplet under FSI, and (V) 4 M aqueous NaCl droplet with 20% AuNP loading under FSI. | ||
Video S4 (ESI†) illustrates the enhancement of voltage when using four such DEHs. Fig. 6(D) shows that, in this scenario, the use of AuNPs together with the convex lens, five units of DEH-ECPV could enhance the PD about 35-fold (from 0.007 mW cm−2 to 0.242 mW cm−2), which was found to be unusually high for such a simple system. Simple scale-up calculations from this graph revealed that the proposed DEH-ECPV unit could harvest ∼1 W in a ∼0.4 m2 area.
3.2 Microfluidic energy harvester
Interestingly, the principles of the DEH-ECPV system discussed so far could be extended to develop a MEH with enhanced efficiency. Fig. 7 shows the typical MEH setup used for the experiments. Fig. 7(A) and (B) show the photographic images of the MEH, which was composed of a transparent PDMS cake with a central channel for the flow of the electrolyte. The central channel was connected to a series of tributary channels at the sides through which the Cu electrodes were inserted at one side and the Cu2O electrodes were inserted at the other. The images suggest that the option to insert nine pairs of electrodes in the MEH was kept to uncover its potential for use as a μ-VLSI. Fig. 7(C) shows an illustration of the multi-electrode system. A similar experimental setup was fabricated where the light source was illuminated from the top and a micropump was used to force the electrolyte to flow through the central microchannel at different flow rates (FR). It should be noted here that instead of pumps, the hydrostatic heads were also used for the electrolyte flow and similar results were found, as reported later. Thus, naturally abundant hydel power resources could easily be integrated to the prototype for fluid flow.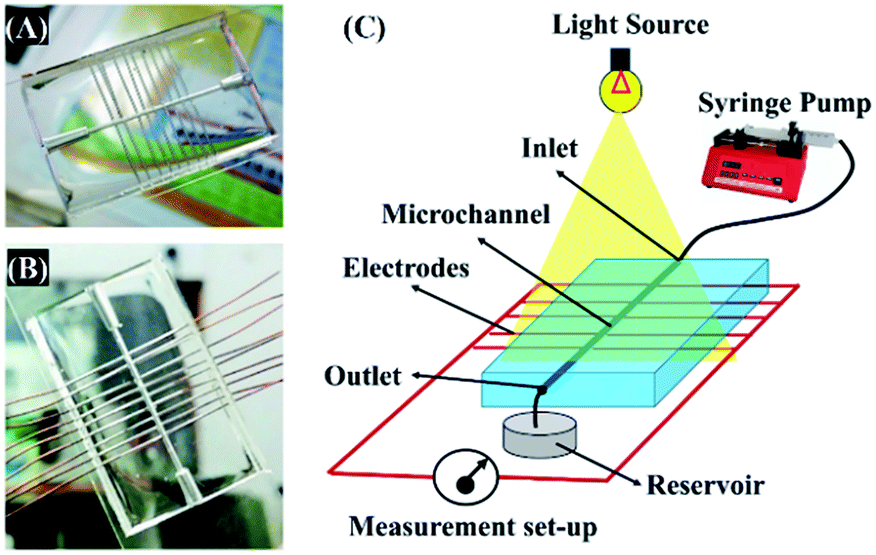 | ||
| Fig. 7 Images (A) and (B) of the MEH. Image (C) shows the experimental setup for energy harvesting using the MEH. | ||
Two types of electrolyte were used to flow through the channel: (i) 4 M aqueous NaCl, and, (ii) 4 M aqueous NaCl loaded with AuNPs. Fig. S7(A) and S7(B) (ESI†) suggest that even for the nine pairs of electrodes in the MEH, use of the 20% (v/v) AuNPs with aqueous NaCl solution gave optimal results. Fig. 8(A)–(C) show the variations in the voltage generated (VC), current density (JC), and power density (PC), in the MEH with flow rate (FR) when 4 M aqueous NaCl solution (blue plot) and 4 M aqueous NaCl solution loaded with AuNPs [20% (v/v)] (red plot) were used. Experiments using different light intensities were also performed as illustrated in Fig. S8 (ESI†). These plots suggest that the VC, JC, and PC values were similar to those obtained with the DEH with smaller values of FR before reaching a maximum (denoted as, VCm, JCm, and PCm) at the intermediate values of FR. However, beyond a threshold value of FR the magnitudes of VC, JC, and PC reduced. The graphs revealed that use of the MEH could show significant improvement in enhancing VC, JC, and PC as compared to the DEH at moderately high values of FR. From the graphs the optimum flow rate for energy harvesting we evaluated as: FR ∼0.025 ml min−1. Furthermore, as observed for DEH, the magnitudes of VC, JC, and PC could be amplified significantly with the use of optimal AuNP loading and increase in the intensity of light exposure. Video S5 (ESI†) shows the typical voltage (VCm) generated using a MEH under DSI and FSI at a FR ∼ 0.025 ml min−1.
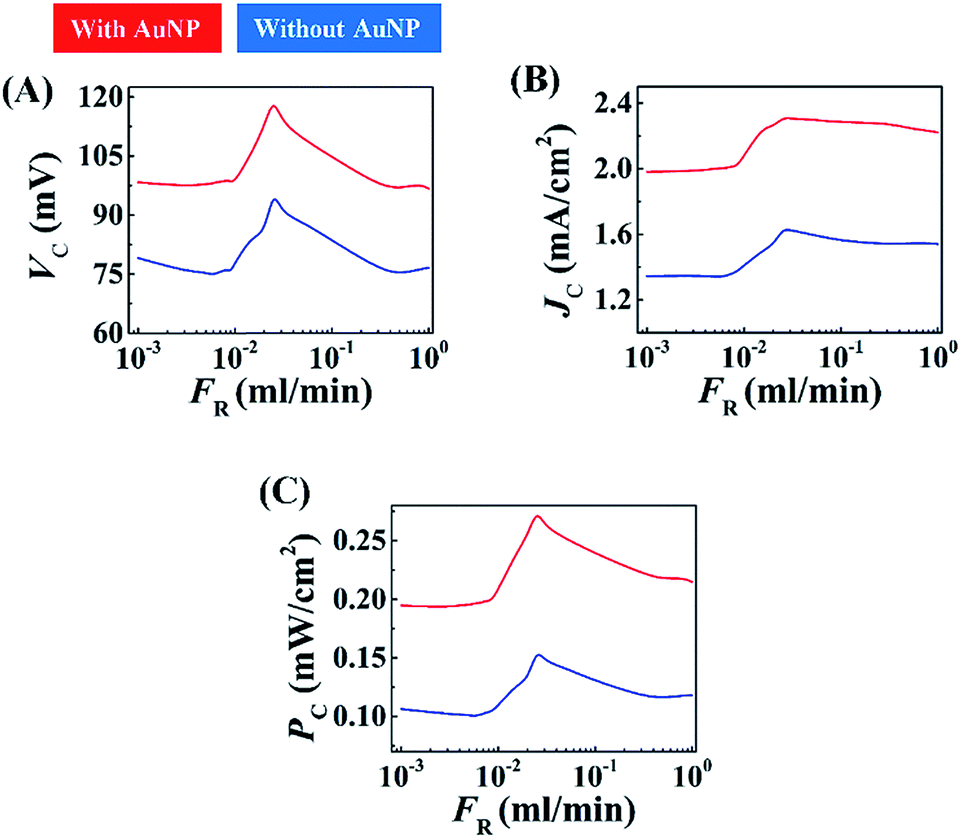 | ||
| Fig. 8 Images (A)–(C) show the variations in the voltage generated (VC), current density (JC), and power density (PC), respectively, with the flow rate (FR) of the electrolyte 4 M aqueous NaCl solution with 20% (v/v) AuNP (red) and without AuNPs (blue) in the MEH-ECPV setup at 14 klx. | ||
The enhancement of the VC, JC, and PC with FR could be attributed to the generation of streaming potential (VSP) across the electrodes, when the electrolyte was forced through the channel. The contact of the Cu and Cu2O electrodes with the electrolyte ensured that electrical double layers were generated around them. In consequence, the Cu and Cu2O electrodes developed a difference in ζ-potentials, which led to additional voltage generation in the MEH prototype apart from the ones induced by the excitations from photon and LSPR on the AuNPs. The VSP in the MEH increased with the pressure drop and flow rate, which is perhaps one of the very simple ways to enhance the streaming potential of a system. At higher FR, perhaps a partial destruction of the double layer because of the flow, led to the reduction in the voltage generation. However, at higher FR, the MEH could generate a larger VC compared to the situation when the fluid was stationary.
In order to improve the performance of the MEH, experiments were conducted by varying the number of electrodes (NE) at a fixed light intensity of 1.1 klx for the electrolyte 4 M aqueous NaCl solution with AuNPs flowing at a FR = 0.025 ml min−1. Fig. 9(A) shows that the PCm increased with NE, which confirmed that a μ-VLSI of electrodes across the central microchannel could enhance the PCm of the MEH. Importantly, the size and spacing of the electrodes ultimately dictated the maximum number to be integrated in the MEH for VLSI. In order to identify the individual contribution of the ECPV (VECPV), LSPR (VSPR), and SP (VSP) inside the MEH, a set of control experiments were performed. The VECPV was identified when a stationary 4.0 M aqueous NaCl solution inside the MEH with nine pairs of electrodes was exposed to the light. The VSP was identified using a flow of a 4.0 M aqueous NaCl solution at a FR = 0.025 ml min−1 to generate (VECPV + VSP) and then subtracting the magnitude of the VECPV obtained from that obtained in the previous experiment. The VSPR was identified by using a flow of a 4.0 M aqueous NaCl solution loaded with AuNPs at a FR = 0.025 ml min−1 to generate (VECPV + VSP + VSPR) and then subtracting the sum of VECPV and VSP from the same equation.
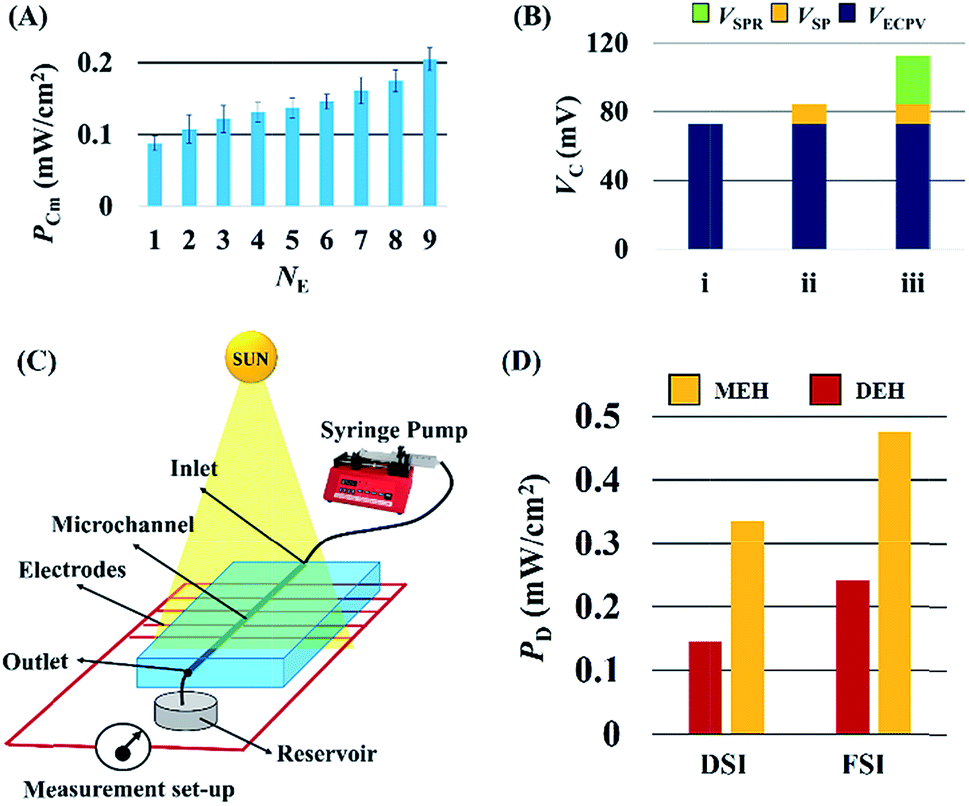 | ||
| Fig. 9 Image (A) shows the change in PCm with the number of pairs of Cu–Cu2O electrodes (NE) for a 4 M aqueous NaCl solution with AuNPs. Image (B) shows the potential difference generated (VC) because of the ECPV (VECPV), LSPR (VSPR), and streaming potential (VSP) for the nine electrode MEH. In all cases the light intensity was 1.1 klx and FR = 0.025 ml min−1. Image (C) shows a schematic diagram of the MEH setup under DSI. Image (D) illustrates the comparison between power densities (PD) of MEH and DEH under DSI and FSI. | ||
Fig. 9(B) shows the values of the VSP = 15 mV, VECPV = 76 mV, and VSPR = 27 mV obtained from these experiments. The MEH was further tested under solar illumination as shown in Fig. 9(C). The power density of the MEH was found to be ∼two times higher compared to the DEH results under DSI and FSI as illustrated in Fig. 9(D). The results of experiments suggest that the MEH system could harvest ∼1 W in a ∼0.2 m2 area.
3.3 Comparison of efficiencies
Fig. 10 shows that the potential difference generated by the DEH and MEH could be also be evaluated by simple theoretical calculations. Fig. 10(A) shows the schematic a single unit cell of MEH composed of a microchannel of diameter, d, and length, L. It was assumed that the electrode distance was similar to d. In such a situation, the VSP can be expressed as: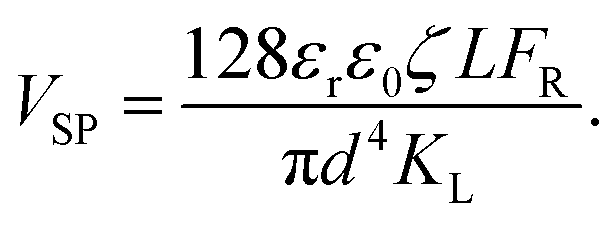 | (1) |
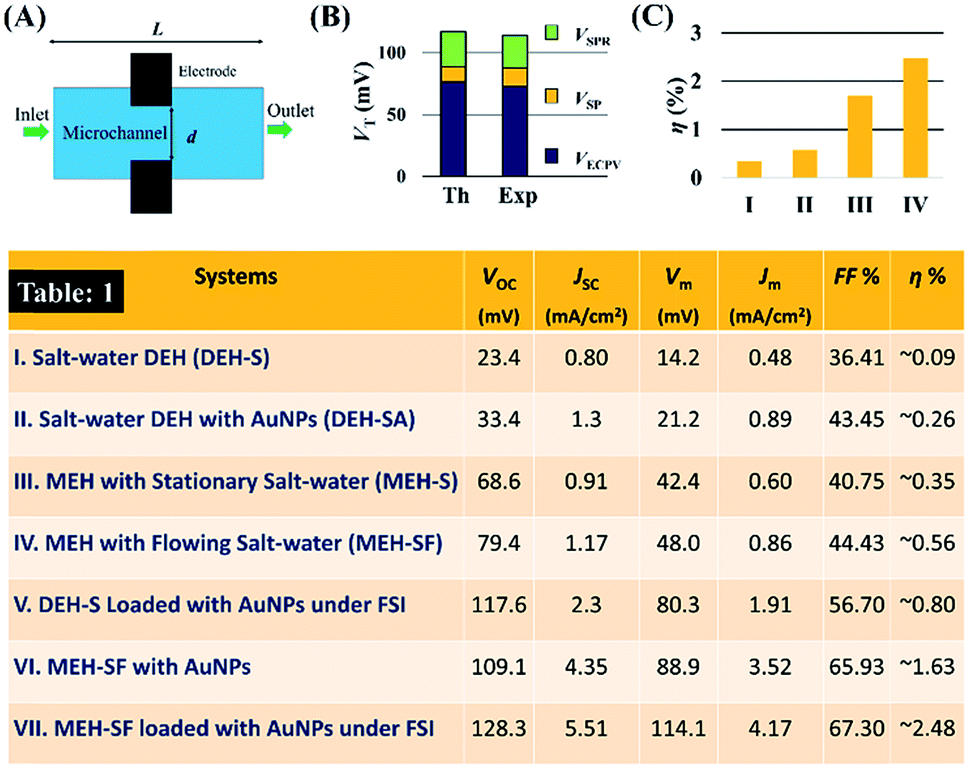 | ||
| Fig. 10 Image (A) shows the theoretical domain chosen for the calculations with a microchannel of length, L, having a pair of electrodes separated by a distance, d. Image (B) shows the comparison between the experimental (Exp) and theoretical (Th) values of the VSP, VSPR, and VECPV. Image (C) shows the efficiencies of the different MEH systems: (I) the salt-water electrolyte was stationary, (II) when the salt-water electrolyte was flowing at FR = 0.025 ml min−1, (III) when the salt-water electrolyte with suspended AuNPs (20%, v/v) was flowing at FR = 0.025 ml min−1, and (IV) when the salt-water electrolyte with suspended AuNPs (20%, v/v) was flowing at FR = 0.025 ml min−1 under FSI. Table 1 summarizes the values of different efficiency parameters for both DEH and MEH discussed in the present paper: (I) salt-water DEH (DEH-S), (II) salt-water DEH with AuNPs (DEH-SA), (III) MEH with stationary salt-water (MEH-S), (IV) MEH with flowing salt-water at optimum flow rate (MEH-SF), (V) DEH with salt-water (DEH-S) loaded with AuNPs and under FSI, (VI) MEH with flowing salt-water (MEH-SF) with AuNPs, and (VII) MEH with flowing salt-water loaded with AuNPs and under FSI. | ||
Furthermore, the VECPV was calculated using the equation:
 | (2) |
The enhancement of potential because of the LSPR was evaluated theoretically from the equation:
| VSPR = nabsVECPV. | (3) |
Combining all the previously mentioned theoretical potentials the total theoretical value VTh = VSP + VECPV + VSPR = 119.1 mV was obtained, which could be generated by the MEH. Again, the magnitude of VTh was found to be close to the experimental one: VEx = VSP + VECPV + VSPR = 115 mV, as shown in Fig. 10(B). The fill-factor (FF) and power efficiency (η) were evaluated for the DEH and MEH using the equations:
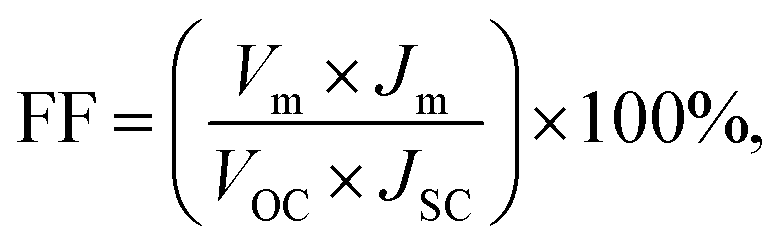 | (4) |
 | (5) |
Fig. 10(C) shows the typical variations in the power efficiency (η) for the MEH where: (I) the salt-water electrolyte was stationary, (II) when the salt-water electrolyte was flowing at an optimum FR, (III) when the salt-water electrolyte with suspended AuNPs (20%, v/v) was flowing at an optimum FR, and (IV) when the salt-water electrolyte with suspended AuNPs (20%, v/v) was flowing at an optimum FR and the light was focussed using a bi-convex lens. Clearly, the results in Table 1 show that the use of the combined influences of ECPV, LSPR, and SP could increase the efficiency of the device up to ∼2.5%, which is one of the highest reported values so far using the Schottky-junction energy harvesters.
Table 1 in Fig. 10 shows the typical experimentally obtained VOC, JSC, Vm, Jm, FF, and η values for the DEHs and MEHs considered in this research. The results in Table 1 suggest that a DEH with salt water could show ∼0.1% efficiency, which was enhanced by about 2.5-fold to 0.24% with the use of the LSPR from the AuNPs. Furthermore, using this electrolyte at an optimal flow rate through the MEH could increase the efficiency of it by about 6-fold to ∼1.63%. Finally, focussing the light source into the MEH, undergoing a flow of AuNP laden salt electrolyte at an optimal flow rate, led to an additional 1.5-fold increase in efficiency to ∼2.5%.
3.4 Application
The system was further used to demonstrate a potential application where a LED light was turned on. For this purpose, the DEH was connected to a LED through an amplifier circuit. The details of the fabrication of the proof-of-concept prototype are shown in the image (A) of Fig. 11. Image (B) shows the equivalent circuit associated with the prototype. The experimental outcome is demonstrated in Video S6 (ESI†). The video shows that when a 100 W incandescent bulb was illuminated on a DEH from a distance of dS = 12.5 cm, an LED could be turned on using the setup. Intuitively, the energy conversion will be more efficient with the use of a MEH under optical operating conditions. The experiment shown in Fig. 11 highlights the potential of the proposed devices for real life applications.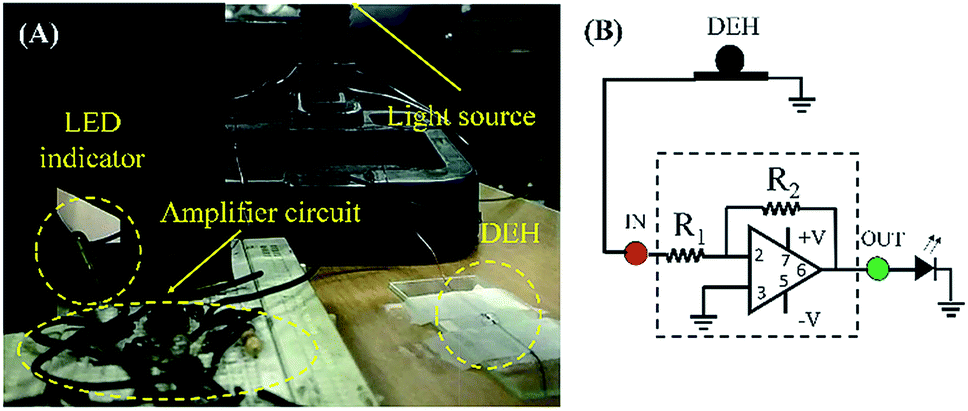 | ||
| Fig. 11 Image (A) shows the experimental set-up and details of the fabrication of the proof-of-concept prototype. Image (B) illustrates the equivalent circuit associated with the experimental set-up. | ||
4. Conclusions
A microdroplet of aqueous salt solution could be used to electrochemically harvest energy from various light sources including solar irradiation, when placed in between a metal and a Schottky-junction Cu–Cu2O electrodes. Introduction of AuNPs inside the microdroplet improved the power density and the efficiency of the energy harvested because of the inclusion of the plasmonic effects together with the electrochemical photovoltaics. Use of FSI through a lens for five such microdroplets showed a ∼30-fold enhancement of the power density and a ∼7-fold increase in the efficiency, which opens up the possibility of harvesting high density power using a very large scale integration of such systems. Remarkably enough, flowing the nanoparticle laden salt solution inside a microfluidic energy harvester integrated with the Cu–Cu2O electrodes energy could be harvested at an efficiency of ∼2.5%, which is perhaps the highest reported so far using the Schottky-junction energy harvesters. In this situation, the combined effects of the streaming potential because of the flow, surface plasmon resonance because of the nanoparticles and the electrochemical photovoltaics led to the increase in the efficiency under a focussed illumination of the light source on the microfluidic energy harvester. The power density of the microfluidic device could be increased by a factor of ∼13 with the use of multiple electrodes, which opened up the possibility of the μ-VLSI of such systems for large scale energy harvesting from naturally abundant solar and hydel power resources. Whereas an array of microdroplets could be used to harvest solar energy at a higher efficiency, the microfluidic setup integrated with a large collection of electrodes could harvest hydel power when integrated to a hydrostatic head generating a flow equivalent to that of a pump.Conflicts of interest
There are no conflicts of interest to declare.Acknowledgements
The authors wish to thank the DST Nano Mission Program Grant, No. SR/NM/NS-1109/2012(C), the MeitY Grant, No. 5(9)/2012-NANO, and the FIST Grant, No. SR/FST/ETII-028/2010, and the Government of India, for financial aid. The authors also thank the Central Instrumental Facility, IIT Guwahati for their support and the use of their characterization facilities. Contributions from Amit Kumar Singh are also acknowledged.Notes and references
- S. Holmberg, A. Perebikovsky, L. Kulinsky and M. Madou, Micromachines, 2014, 5, 171–203 CrossRef.
- M. Bhattacharjee, H. B. Nemade and D. Bandyopadhyay, Biosens. Bioelectron., 2017, 94, 544–551 CrossRef CAS PubMed.
- S. Dutta, N. Mandal and D. Bandyopadhyay, Biosens. Bioelectron., 2016, 78, 447–453 CrossRef CAS PubMed.
- B. Yin, W. Zheng, M. Dong, W. Yu, Y. Chen, S. W. Joo and X. Jiang, Analyst, 2017, 142, 2954–2960 RSC.
- M. K. Tripathi, K. C. Sahu and R. Govindarajan, Nat. Commun., 2015, 6, 6268 CrossRef CAS PubMed.
- A. K. Singh, K. K. Dey, A. Chattopadhyay, T. K. Mandal and D. Bandyopadhyay, Nanoscale, 2014, 6, 1398–1405 RSC.
- S. Kumar, A. K. Singh, A. K. Dasmahapatra, T. K. Mandal and D. Bandyopadhyay, Carbon, 2015, 89, 31–40 CrossRef CAS.
- E. Becquerel, Comptes Rendus, 1839, 9, 561–567 Search PubMed.
- L. Clark, Nature News, 1873, 7, 303 CrossRef.
- C. E. Fritts, Am. J. Sci., 1883, 26, 465–472 CrossRef.
- A. Einstein, Ann. Phys., 1905, 322, 132–148 CrossRef.
- R. A. Millikan, Phys. Rev., 1916, 4, 73–75 Search PubMed.
- D. M. Chapin, C. S. Fuller and G. L. Pearson, US Pat., US2780765, 1957.
- J. D. C. Dickson, US Pat., US2938938, 1960.
- L. Mei, L.-H. Yeh and S. Qian, Nano Energy, 2017, 32, 374–381 CrossRef CAS.
- F. C. Krebs, H. Spanggard, T. Kjær, M. Biancardo and J. Alstrup, Mater. Sci. Eng., B, 2007, 138, 106–111 CrossRef CAS.
- K. Schwarzburg and F. Willig, J. Phys. Chem. B, 1999, 103, 5743–5746 CrossRef CAS.
- R. R. King, D. C. Law, K. M. Edmondson, C. M. Fetzer, G. S. Kinsey, H. Yoon, R. A. Sherif and N. H. Karam, Appl. Phys. Lett., 2007, 90, 183516 CrossRef.
- M. A. Green, Sol. Energy, 2004, 76, 3–8 CrossRef CAS.
- R. B. Bergmann, Appl. Phys. A: Mater. Sci. Process., 1999, 69, 187–194 CrossRef CAS.
- C. M. Lampert, Sol. Energy Mater. Sol. Cells, 2003, 76, 489–499 CrossRef CAS.
- S. Th, M. Pietsch, G. Andrä, F. Falk, E. Ose and S. Christiansen, Nanotechnology, 2008, 19, 295203 CrossRef PubMed.
- A. C. Mayer, S. R. Scully, B. E. Hardin, M. W. Rowell and M. D. McGehee, Mater. Today, 2007, 10, 28–33 CrossRef CAS.
- Y.-J. Cheng, S.-H. Yang and C.-S. Hsu, Chem. Rev., 2009, 109, 5868–5923 CrossRef CAS PubMed.
- S. K. Hau, H.-L. Yip, N. S. Baek, J. Zou, K. O'Malley and A. K. Y. Jen, Appl. Phys. Lett., 2008, 92, 253301 CrossRef.
- M. Yamaguchi, Sol. Energy Mater. Sol. Cells, 2003, 75, 261–269 CrossRef CAS.
- N.-G. Park, J. Phys. Chem. Lett., 2013, 4, 2423–2429 CrossRef CAS.
- G. R. Dillip, K. Munirathnam, B. D. P. Raju, N. J. Sushma and S. W. Joo, Luminescence, 2017, 32, 772–778 CrossRef CAS PubMed.
- B. Tan and Y. Wu, J. Phys. Chem. B, 2006, 110, 15932–15938 CrossRef CAS PubMed.
- A. B. F. Martinson, J. W. Elam, J. T. Hupp and M. J. Pellin, Nano Lett., 2007, 7, 2183–2187 CrossRef CAS PubMed.
- J. Liu, T. Tanaka, K. Sivula, A. P. Alivisatos and J. M. J. Fréchet, J. Am. Chem. Soc., 2004, 126, 6550–6551 CrossRef CAS PubMed.
- S. Majumder, J. Dhar and S. Chakraborty, Sci. Rep., 2015, 5, 14725 CrossRef CAS PubMed.
- M. Gratzel, Nature, 2001, 414, 338–344 CrossRef CAS PubMed.
- C. Bakli and S. Chakraborty, Electrophoresis, 2015, 36, 675–681 CrossRef CAS PubMed.
- R. Dey, U. U. Ghosh, S. Chakraborty and S. DasGupta, Langmuir, 2015, 31, 11269–11278 CrossRef CAS PubMed.
- K. L. Chopra, P. D. Paulson and V. Dutta, Prog. Photovoltaics Res. Appl., 2004, 12, 69–92 CrossRef CAS.
- C. Krumm, S. Maduskar, A. D. Paulsen, A. D. Anderson, N. L. Barberio, J. N. Damen, C. A. Beach, S. Kumar and P. J. Dauenhauer, Energy Environ. Sci., 2016, 9, 1645–1649 RSC.
- K. Zhang, H. Wang, Z. Gan, P. Zhou, C. Mei, X. Huang and Y. Xia, Sci. Rep., 2016, 6, 22906 CrossRef CAS PubMed.
- T. Dahlang and T. Sven, J. Phys.: Condens. Matter, 2012, 24, 175002 CrossRef PubMed.
- D. S. Murali, S. Kumar, R. J. Choudhary, A. D. Wadikar, M. K. Jain and A. Subrahmanyam, AIP Adv., 2015, 5, 047143 CrossRef.
- S. Brandt, C. A. Martins, V. C. Zoldan, A. D. C. Viegas, J. H. Dias da Silva and A. A. Pasa, Thin Solid Films, 2014, 562, 144–151 CrossRef.
- M. Tadatsugu, N. Yuki, M. Toshihiro and N. Jun-ichi, Appl. Phys. Express, 2011, 4, 062301 CrossRef.
- L. C. Olsen, R. C. Bohara and M. W. Urie, Appl. Phys. Lett., 1979, 34, 47–49 CrossRef CAS.
- C. Li, F. Wang and J. C. Yu, Energy Environ. Sci., 2011, 4, 100–113 RSC.
- J. Li, S. K. Cushing, F. Meng, T. R. Senty, A. D. Bristow and N. Wu, Nat. Photonics, 2015, 9, 601–608 CrossRef CAS.
- T. Minami, Y. Nishi and T. Miyata, J. Semicond., 2016, 37, 014002–014009 CrossRef.
- L. Papadimitriou and N. A. Economou, Solid-State Electron., 1983, 26, 767–769 CrossRef CAS.
- H. M. Wei, H. B. Gong, L. Chen, M. Zi and B. Q. Cao, J. Phys. Chem. C, 2012, 116, 10510–10515 CrossRef CAS.
- X. Fuku, K. Kaviyarasu, N. Matinise and M. Maaza, Nanoscale Res. Lett., 2016, 11, 386 CrossRef CAS PubMed.
- Z. Zhang and P. Wang, J. Mater. Chem., 2012, 22, 2456–2464 RSC.
- T. N. Krupenkin, US Pat., US7898096B1, 2011.
- T. N. Krupenkin and J. A. Taylor, US Pat., US20120181901A1, 2012.
- M. Bhattacharjee, V. Pasumarthi, J. Chaudhuri, A. K. Singh, H. Nemade and D. Bandyopadhyay, Nanoscale, 2016, 8, 6118–6128 RSC.
- M. Bhattacharjee, S. Timung, D. Bandyopadhyay and T. K. Mandal, India Pat., 201631036408 A, 2016.
- J. K. Moon, J. Jeong, D. Lee and H. K. Pak, Nat. Commun., 2013, 4, 1487 CrossRef PubMed.
- T. Krupenkin and J. A. Taylor, Nat. Commun., 2011, 2, 448 CrossRef PubMed.
- S. P. Beeby, R. N. Torah, M. J. Tudor, P. Glynne-Jones, T. O. Donnell, C. R. Saha and S. Roy, J. Micromech. Microeng., 2007, 17, 1257 CrossRef.
- J. A. Paradiso and T. Starner, IEEE Pervasive Comput., 2005, 4, 18–27 CrossRef.
- S. K. Ghosh and T. Pal, Chem. Rev., 2007, 107, 4797–4862 CrossRef CAS PubMed.
- H. Choi, S.-J. Ko, Y. Choi, P. Joo, T. Kim, B. R. Lee, J.-W. Jung, H. J. Choi, M. Cha, J.-R. Jeong, I.-W. Hwang, M. H. Song, B.-S. Kim and J. Y. Kim, Nat. Photon., 2013, 7, 732–738 CrossRef CAS.
- D. M. Schaadt, B. Feng and E. T. Yu, Appl. Phys. Lett., 2005, 86, 063106 CrossRef.
- J.-H. Im, J. Luo, M. Franckevičius, N. Pellet, P. Gao, T. Moehl, S. M. Zakeeruddin, M. K. Nazeeruddin, M. Grätzel and N.-G. Park, Nano Lett., 2015, 15, 2120–2126 CrossRef CAS PubMed.
- S. Pillai, K. R. Catchpole, T. Trupke and M. A. Green, J. Appl. Phys., 2007, 101, 093105 CrossRef.
- K. Nakayama, K. Tanabe and H. A. Atwater, Appl. Phys. Lett., 2008, 93, 121904 CrossRef.
- A. J. Nozik and R. Memming, J. Phys. Chem., 1996, 100, 13061–13078 CrossRef CAS.
- Y.-H. Su, Y.-F. Ke, S.-L. Cai and Q.-Y. Yao, Light: Sci. Appl., 2012, 1, 1–5 CrossRef.
- M. Moskovits, Rev. Modern Phys., 1985, 57, 783–826 CrossRef CAS.
- V. Amendola, S. Scaramuzza, S. Agnoli, S. Polizzi and M. Meneghetti, Nanoscale, 2014, 6, 1423–1433 RSC.
- M. K. Hossain, Y. Kitahama, G. G. Huang, T. Kaneko and Y. Ozaki, Appl. Phys. B, 2008, 93, 165–170 CrossRef CAS.
- G. Wang and W. Sun, J. Phys. Chem. B, 2006, 110, 20901–20905 CrossRef CAS PubMed.
Footnotes |
| † Electronic supplementary information (ESI) available. See DOI: 10.1039/c8na00362a |
| ‡ M. Bhattacharjee, S. Timung, T. K. Mandal, and D. Bandyopadhyay designed all the experiments and M. Bhattacharjee and S. Timung performed the experiments. The manuscript was written with contributions from all the authors and they have all given their approval to the final version and declare no conflicts of interest |
| This journal is © The Royal Society of Chemistry 2019 |