 Open Access Article
Quercetin spectrofluorometric quantification in aqueous media using different surfactants as fluorescence promoters†
J. C. Alva-Ensasteguia,
M. Palomar-Pardavé b,
M. Romero-Romo
 b and
M. T. Ramírez-Silva
 *a
*a
aUniversidad Autónoma Metropolitana – Iztapalapa, Departamento de Química, Área de Química Analítica, Av. San Rafael Atlixco #186, Col. Vicentina, C.P. 09340, Ciudad de México, México. E-mail: mtrs218@xanum.uam.mx
bUniversidad Autónoma Metropolitana – Azcapotzalco, Departamento de Materiales, Área Ingeniería Materiales, Av. San Pablo #180, Col. Reynosa-Tamaulipas, C.P. 02200, Ciudad de México, México
First published on 20th March 2018
Abstract
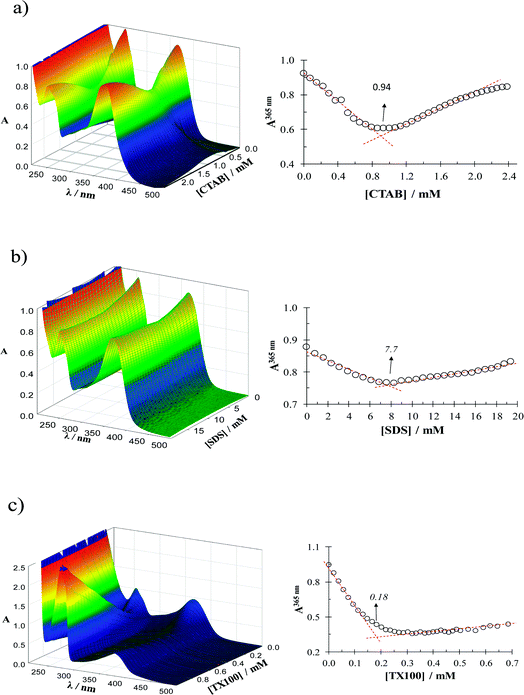
Quercetin spectrofluorometric quantification was carried out in aqueous media (pH 7) using micelles of surfactants, namely: CTAB, SDS and TX100 as promoters of quercetin fluorescence, having a critical micelle concentration, CMC, of: 0.94 ± 0.03, 7.7 ± 0.6 and 0.18 ± 0.3 mM, respectively, measured through UV-Vis spectrophotometry. The thermodynamic binding constant, K, for the quercetin-surfactants' micelles supramolecular complex was estimated to be (log(K/M−1)) = 2.87 ± 0.02, 2.78 ± 0.04 and 2.80 ± 0.04, respectively, from fluorescence spectrophotometry. With the aid of these parameters it was possible to construct species distribution diagrams and choose the experimental conditions where quercetin can be quantified in aqueous media from fluorescence measurements. The best lowest limit of detection (0.244 ± 0.092) μM was achieved with CTAB micelles while the best sensitivity (2.919 ± 0.054) M−1 corresponded to SDS.
1 Introduction
Quercetin, 3,3′,4′,5,7-pentahydroxyflavone, see Fig. S1,† is commonly found in fruits and vegetables, although in particular, in apples and onions it occurs at highest levels.1,2 Due mainly to its anti-oxidant capacity,3 quercetin exhibits also other very important properties, namely: anti-inflammatory,4 anti-atherogenic and anti-carcinogenic.5 Furthermore, as caffeine, quercetin is also neuroactive and has GRAS (Generally Recognized As Safe) status. No side-effects have yet been noted in doses of a few grams a day in either humans or animals. In order to quantify quercetin several methods have been reported, namely: spectrophotometry in ethanolic media,1,6 using the coloured complex formed on reaction of quercetin with aluminium chloride in aqueous media,7 high performance liquid chromatography,1,6 electrochemical,2,8,9 photo-electrochemical.10 Flavonols, like the quercetin, containing an –OH group at position 5 (C-5), comprise a special class of non-fluorescent molecules in aqueous solution; since the intermolecular hydrogen bond between the polar groups of solute and H2O exceeds various intramolecular hydrogen bonds, it displays a large dihedral angle that makes it very difficult for ESICT (excited state intramolecular charge transfer) to occur.Thus, the formation of a distorted excited state will become very active in water and no quercetin fluorescence emission is observed.11 It has been shown that under particular conditions, namely: when quercetin binds to intracellular proteins12 and in methanol media,13 the quercetin exhibits strong fluorescence, which was the property herein used for its simple, affordable, quantification. Notwithstanding, the spectrofluorometric quantification of quercetin in aqueous media has not been reported yet. In this work, it is shown that different surfactants namely: cetyl trimethylammonium bromide, CTAB,14 sodium dodecyl sulphate, SDS,15 and Triton X-100 (TX-100)16 can be used as promoters for quercetin fluorescence in aqueous media, allowing its spectrophotometric quantification, in this regard, Dwivedi et al.,17 have shown than the fluorescence properties of an amphiphilic perylene diimide, a bimolecular analogue of L-DOPA, can be modulated by means of host–guest interactions with CTAB. It is important to mention that the methods reported so far for quercetin quantification require expensive instrumentation i.e. HPTLC18,19 or sensing materials namely: multiwall carbon nanotubes2 or carbon nanoparticles.20
But must important, all of them need sufficiently long periods of time for quercetin determination, however as has been shown,3 the stability of quercetin and other flavonoids namely: morin, kaempferol, and myricetin are pH and time dependent thus, if these flavonoids are not stabilized during the measuring times their concentration may change. As will be shown in this work the use of surfactants overcomes this difficulty since they confer enough stability to quercetin during its spectrofluorometric quantification time.
2 Experimental
2.1 Reagents and instruments
All the substances used were reactive grade. Quercetin, CTAB, SDS and Triton X-100 from Sigma-Aldrich, methanol to dissolve the quercetin was J.T. Baker brand, 18 MΩ cm resistivity deionized water from a Millipore Milli-Q equipment was used as solvent for all experiments. To dissolve the reagents, an Ultrasonic (8891 Cole-Parmer, set sonic min). All the experiments were conducted at 28.0 ± 0.1 °C aided by a Grant W14 recirculator.The solutions were protected from light incidence as much as possible. Concentrated solutions of SDS, CTAB and Triton X-100 were prepared in water and a quercetin concentrated one in methanol. Aliquots were taken from each of these solutions to be added to the different systems to obtain the desired concentrations. The pH of the solutions was measured with a Mettler Toledo pH-meter, with an error of ±0.01 per pH unit.
2.2 UV-Vis spectrophotometry
Spectrophotometric measurements were carried out with a UV-Vis Lambda 20 spectrophotometer using quartz cells, one-centimetre optical path length, and two transparent faces and the WinLab software. For estimation of the surfactants critical micelle concentration, CMC, three systems were prepared with a volume of 5 mL of water and 5 × 10⁻⁵ M quercetin concentration each. To each of the systems, aliquots of the stock solution of one of the surfactants, were added and the respective absorption spectrum was measured after every addition.2.3 Fluorescence spectrophotometry
Fluorescence measurements were performed with a Perkin Elmer LS50 Luminiscence Spectrometer using quartz cells, one-centimetre optical path length, with the four transparent faces and the WinLab software.These measurements were used for both: evaluation of the binding constant of the supramolecular complex formed between quercetin and surfactants micelles and for quercetin quantification. Three systems were prepared with a volume of 5 mL of water and a 6 × 10⁻⁵ M quercetin concentration. To each of the systems, aliquots of the mother solution of one of the surfactants were added and the respective emission fluorescence spectrum was measured after every addition. For quercetin quantification, calibration plots were obtained by adding quercetin (within the 0 to 7.5 mM range) to an aqueous solution having a fixed surfactant concentration (higher than the respective CMC value) and the respective emission fluorescence spectrum was recorded at 350 nm excitation wavelength, for all experiments.
3 Results and discussion
3.1 CMC calculations
Fig. 1 shows a family of UV-Vis spectra recorded in the system quercetin–H2O-surfactant for a fixed quercetin concentration and different surfactant concentrations. From absorbance variation at 365 nm it is possible to estimate the CMC for each case, see Table 1.14–163.2 Quercetin stability
In the absence of surfactant micelles, see Fig. S2,† quercetin is notably unstable, the absorbance at 365 nm decreases linearly with time, referred to its value at t = 0, however when the surfactant concentration is present higher than the respective CMC value quercetin becomes stable in time.3.3 Thermodynamic binding constant for the quercetin-surfactants micelles supramolecular complex
Fig. 2a shows a family of fluorescence emission spectra of quercetin in aqueous media with different CTAB concentrations. | ||
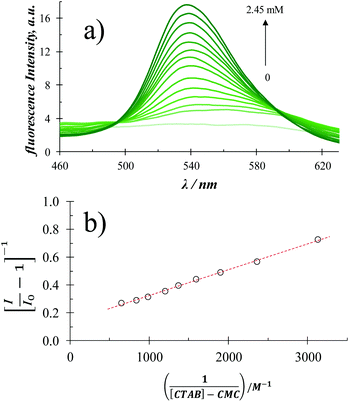
| Fig. 2 (a) Fluorescence emission spectra recorded in a 6 × 10⁻⁵ M quercetin aqueous solution containing different CTAB concentrations, within the 0 to 2.45 M range, using an excitation wavelength of 350 nm at (28.0 ± 0.1) °C and the pH 7 ± 0.2. (b) Plot [I/I0 − 1]−1 vs. l/[CTAB]-CMC obtained from the fluorescence intensity, I, in (a) and CMC in Table 1. | ||
From this figure it becomes plain that in the absence of CTAB molecules, quercetin depicts no fluorescence. Notwithstanding, as the CTAB concentration in the system is increased, a well-defined fluorescence intensity peak is formed at 540 nm, furthermore, quite a similar behaviour was noted when SDS or TX-100 was added, see Fig. S3 in the ESI† of this work.
The supramolecular complex,  , formed between quercetin, Q, molecules and the surfactant, Surf, micelles, see Reacc. (1), restricts quercetin mobility and promotes in this way its fluorescence.
 | (R1) |
According with Guardia et al.,24 from fluorescence emission spectra it is possible to determine the binding constants, K, between micelles and chemical systems using eqn (1).
 | (1) |
When the extinction coefficient does not vary in the micellar media γ = 1. The regression between [I/I0 − 1]−1 and l/[surfactant]-CMC, gives a straight line and the value of the binding constant between the system and the micelles can be obtained from the ratio of the intercept and the slope of this line, whenever the micelles do not modify the extinction coefficient at the excitation wavelength. From Fig. 2b it can be noted, in the case when CTAB was the surfactant added, that the model associated to eqn (1) fits quite well the experimental data (similar behaviour has been noted in the case of SDS and TX100), see Fig. S3.†
Table 2 summarizes the values of binding constant for the quercetin and micelles of the different surfactants considered.
| Surfactants | Intercept | 105 slope/M | R2 | log(K/M−1) |
|---|---|---|---|---|
| a The uncertainty reported was estimated from at least 5 repetitions. | ||||
| CTAB | 0.1376 ± 0.0061 | 18.73 ± 0.35 | 0.9975 | 2.87 ± 0.02 |
| SDS | 0.2823 ± 0.0087 | 47.08 ± 2.86 | 0.9819 | 2.78 ± 0.04 |
| TX-100 | 0.1262 ± 0.0112 | 19.79 ± 0.55 | 0.9947 | 2.80 ± 0.04 |
It is important to note that recently, from similar spectroscopic measurements, Szymczyk and Taraba,25 found that log(K/M−1) = 3.16 for the interaction between Triton X-114 and Quercetin (2 × 10⁻⁵ M at 20 °C) while Liu and Guo26 reported 3.45 for quercetin (5 × 10⁻⁵ M at 25 °C) with Triton X-100 and Singh et al.27, 3.25 for sodium bis(2-ethylhexyl)sulfosuccinate and quercetin (3 × 10⁻⁵ M at 25 °C).
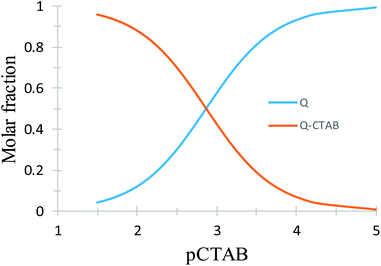
With the respective K values reported in Table 2 it is possible to construct the species distribution diagram for quercetin and the complex formed in aqueous solution as a function of pSurfactant = −log[surfactant].28 Fig. 3 depicts such diagram in the case of CTAB; similar diagrams, for SDS and TX100 can be found in Fig. S5.†
3.4 Quercetin quantification
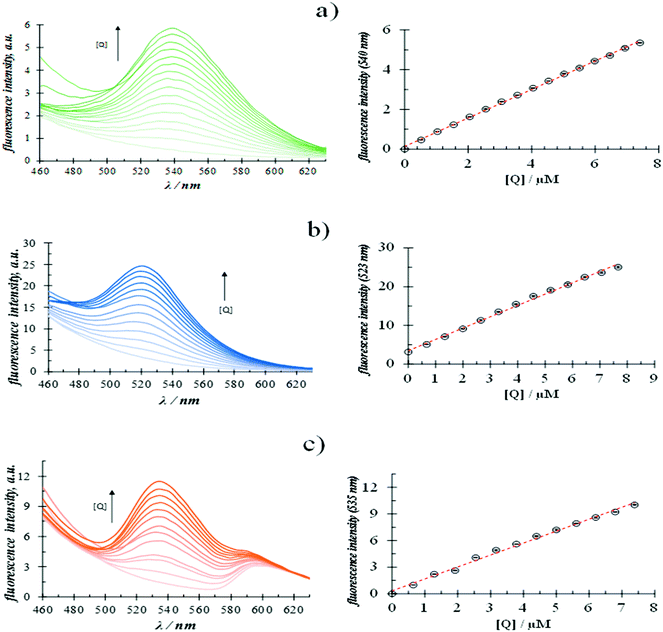
Once it was shown that the interaction between quercetin and surfactant promotes the fluorescence of the former in aqueous media, due to the supramolecular interaction with micelles of the amphiphilic molecules, the spectrofluorometric quantification of quercetin in aqueous media was carried out.In order to do this, an aqueous solution of surfactants with a fixed concentration, 4 times higher than the respective CMC, was used to ensure the presence of micelles in each case and that the complex quercetin-surfactant predominates in the system, see Fig. 3 and S5.† Fig. 4 shows the fluorescence emission spectra recorded in aqueous surfactant solutions, at a fixed concentration, added with different quercetin concentrations.
It is possible to note in all cases the formation of a florescence peak, of which the intensity varies linearly with the quercetin concentration. From these calibration plots, it was possible to calculate the analytical features namely: the limits of detection (LOD) and quantification (LOQ) and the sensitivity in each case, see Table 3.
| Surfactant | [Surfactant]/mM | LOD/μM | LOQ/μM | Sensitivity/μM−1 |
|---|---|---|---|---|
| a The uncertainty reported was estimated from at least 5 repetitions. | ||||
| CTAB | 3.768 ± 0.009 | 0.244 ± 0.092 | 0.81 ± 0.09 | 0.718 ± 0.006 |
| SDS | 36.893 ± 0.015 | 0.48 ± 0.19 | 1.60 ± 0.18 | 2.919 ± 0.054 |
| TX-100 | 2.827 ± 0.012 | 0.56 ± 0.22 | 1.88 ± 0.21 | 1.346 ± 0.030 |
Table 4 depicts a comparison of the analytical method developed in this work with others reported, particularly regarding quercetin quantification, from which it results plaint that the analytical performance of our methodology is plainly comparable or even better than that of others more sophisticated ones.
| Media | Methodology | 108 LOD/M | 108 LOQ/M | 106 sensitivity/M−1 | Ref. |
|---|---|---|---|---|---|
| a N.R. Not reported.b Using carbon nanoparticles as fluorescence probe.c Using GCE/PEI-CNT.d GCE/PAA-CNT.e GCE, where: GCE (glassy carbon electrodes), CNT (multiwall carbon nanotubes), PEI (polyethylenimine) and PAA (poly(acrylic acid)). | |||||
| NH3–NH4Cl buffer solution (0.10 M, pH 9.47) | Fluorescenceb | 9.88 | N.R. | 9.39 | 20 |
| Phosphate buffer (0.1 M pH 7.40) | Adsorptive stripping with square wave voltammetryc | 8.9 | N.R. | 2.5 | 2 |
| Adsorptive stripping with square wave voltammetryd | 0.75 | N.R. | 8.7 | ||
| Amperometrye | 170 | N.R. | 150 | ||
| Amperometryc | 140 | N.R. | 760 | ||
| Amperometryd | 20 | N.R. | 330 | ||
| Methanol | HPTLC | 4700 | 9500 | — | 18 |
| Ethanol | HPTLC | 590 | 1480 | — | 19 |
| Water (pH 7) | Fluorescence, in the presence of CTAB micelles | 24.4 | 81 | 0.72 | This work |
| Fluorescence, in the presence of SDS micelles | 47.9 | 160 | 2.92 | ||
| Fluorescence, in the presence of TX100 micelles | 56.4 | 188 | 1.35 | ||
3.5 Interferences
In order to broaden the usefulness and applicability of the spectrofluorometric quantification of quercetin, experiments were run on other molecules that could cause competition with quercetin in the micelles, namely: morin, rutin, catechin and epicatechin, see Fig. S6,† and thus may provoke interference. It was found that regardless of the nature of the surfactant, when adding morin to an aqueous solution with fixed concentrations of quercetin and surfactant, see Fig. S7,† the fluorescence intensity increases linearly with the morin concentration, contrary, when rutin was added, instead of morin, the fluorescence intensity decreases linearly with the its concentration, see Fig. S8,† however, when catechin, see Fig. S9,† or epicatechin, see Fig. S10,† were added the fluorescence intensity remains practically constant. From these results, it can be concluded that while morin is a major interferent, rutin slightly interferes and catechin and epicatechin do not. Furthermore, it was also found that quercetin can be quantified spectrofluorometrically in the presence of a higher concentration of ascorbic acid (see Fig. S11†).4 Conclusions
It has been shown that micelles of surfactants (anionic, cationic or neutral) in neutral aqueous media interact with quercetin forming stable supramolecular complexes that promote both: time stability and quercetin fluorescence, which allow it quantification by means of spectrofluorometry even in the presence of similar molecules like catechin and epicatechin or higher ascorbic acid concentrations.Conflicts of interest
There are no conflicts of interest to declare.Acknowledgements
JCAE (286109) acknowledges and thanks CONACyT for the studentship given to pursue research Ph. D studies. MEPP, MARR and MTRS gratefully acknowledge the SNI for the distinction granted and stipend received. MTRS acknowledges CONACyT for project 237327 and the cathedra 2159. The authors also like to thank SEP PRODEP for financial support through the RedNIQAE.Notes and references
- K. A. Lombard, E. Geoffriau and E. Peffley, Flavonoid quantification in onion by spectrophotometric and high performance liquid chromatography analysis, HortScience, 2002, 37, 682–685 CAS.
- F. Gutiérrez, G. Ortega, J. L. Cabrera, M. D. Rubianes and G. A. Rivas, Quantification of quercetin using glassy carbon electrodes, modified with multiwalled carbon nanotubes dispersed in polyethylenimine and polyacrylic acid, Electroanalysis, 2010, 22, 2650–2657 CrossRef.
- R. Álvarez-Diduk, M. T. Ramírez-Silva, A. Galano and A. Merkoçi, Deprotonation mechanism and acidity constants in aqueous solution of flavonols: a combined experimental and theoretical study, J. Phys. Chem. B, 2013, 117, 12347–12359 CrossRef PubMed.
- A. E. Rotelli, T. Guardia, A. O. Juarez, N. E. de la Rocha and L. E. Pelzer, Comparative study of flavonoids in experimental models of inflammation, Pharmacol. Res., 2003, 48, 601–606 CrossRef CAS PubMed.
- A. K. Verma, J. A. Johnson, M. N. Gould and M. A. Tanner, Inhibition of 7,12-dimethylbenz(a)anthracene- and N-nitrosomethylurea-induced rat mammary cancer by dietary flavonol quercetin, Cancer Res., 1988, 48, 5754–5758 CAS.
- K. Sun Yoo, E. Jin Lee and B. S. Patil, Quantification of Quercetin Glycosides in 6 Onion Cultivars and Comparisons of Hydrolysis-HPLC and Spectrophotometric Methods in Measuring Total Quercetin Concentrations, J. Food Sci., 2010, 75, C160–C165 CrossRef PubMed.
- L. E. Dowd, Spectrophotometric Determination of Quercetin, Anal. Chem., 1959, 31, 1184–1187 CrossRef CAS.
- R. Álvarez-Diduk, M. T. Ramírez-Silva, G. Alarcón-Ángeles, A. Galano, A. Rojas-Hernández, M. Romero-Romo and M. Palomar-Pardavé, Electrochemical Characterization of Quercetin in Aqueous Solution Analysis, ECS Trans., 2009, 20, 115–122 Search PubMed.
- B. Lu, J. Xia, Z. Wang, F. Zhang, M. Yang, Y. Li and Y. Xia, Molecularly imprinted electrochemical sensor based on an electrode modified with an imprinted pyrrole film immobilized on a β-cyclodextrin/gold nanoparticles/graphene layer, RSC Adv., 2015, 5, 82930–82935 RSC.
- L. Tian, B. Wang, R. Chen, Y. Gao, Y. Chen and T. Li, Determination of quercetin using a photo-electrochemical sensor modified with titanium dioxide and a platinum(II)-porphyrin complex, Microchim. Acta, 2015, 182, 687–693 CrossRef CAS.
- G. S. Pillai, K. Krishnakumar and B. Krishnan, Fluorescence properties of Quercetin – A Review, Asian J. Res. Biol. Pharm. Sci., 2017, 5(2), 44–49 Search PubMed.
- I. Baran, C. Ganea, I. Ursu, V. Baran, O. Calinescu, A. Iftime, R. Ungureanu and I. T. Tofolean, Fluorescence properties of quercetin in human leukemia jurkat t-cells, Rom. J. Phys., 2011, 56, 388–398 CAS.
- R. Jain and S. Rajput, Determination of quercetin in lotus leaves extract and glycyrrhizin in liquorice roots extract by spectrofluorimetric methods, Indo Am. J. Pharm. Res., 2014, 4, 5495–5499 Search PubMed.
- A. E. Sánchez-Rivera, V. Vital-Vaquier, M. Romero-Romo, M. T. Ramírez-Silva and M. Palomar-Pardavé, Electrochemical Deposition of Cetyltrimethylammonium Surface Hemimicelles at the Hg/0.1 M NaCl(aq) Interface, J. Electrochem. Soc., 2004, 151, C666–C673 CrossRef.
- S. Corona-Avendaño, G. Alarcón-Angeles, M. T. Ramírez-Silva, G. Rosquete-Pina, M. Romero-Romo and M. Palomar-Pardavé, On the electrochemistry of dopamine in aqueous solution. Part I: The role of [SDS] on the voltammetric behavior of dopamine on a carbon paste electrode, J. Electroanal. Chem., 2007, 609, 17–26 CrossRef.
- S. Kumar Hait and S. Priya Moulik, Determination of critical micelle concentration (CMC) of nonionic surfactants by Donor–Acceptor interaction with iodine and correlation of CMC with hydrophile–lipophile balance and other parameters of the surfactants, J. Surfactants Deterg., 2001, 4, 303–309 CrossRef.
- A. K. Dwivedi, M. Pandeeswar and T. Govindaraju, Assembly Modulation of PDI Derivative as a Supramolecular Fluorescence Switching Probe for Detection of Cationic Surfactant and Metal Ions in Aqueous Media, ACS Appl. Mater. Interfaces, 2014, 6, 21369–21379 CAS.
- B. Singh, P. Mungara, M. Nivsarkar and S. Anandjiwala, HPTLC Densitometric Quantification of Glycyrrhizin, Glycyrrhetinic Acid, Apigenin, Kaempferol and Quercetin from Glycyrrhiza glabra, Chromatographia, 2009, 70, 1665–1672 CAS.
- S. Shailajan and H. Joshi, Optimized Separation and Quantification of Pharmacologically active markers Quercetin, Kaempferol, β-sitosterol and Lupeol from Cuscuta reflexa Roxb, J. Pharm. Res., 2011, 4, 1851–1853 CAS.
- D. Xiao, D. Yuan, H. He and M. Gao, Microwave assisted one-step green synthesis of fluorescent carbon nanoparticles from ionic liquids and their application as novel fluorescence probe for quercetin determination, J. Lumin., 2013, 140, 120–125 CrossRef CAS.
- J. H. Fendler and E. J. Fendler, Catalysis in Micellar and Macromolecular System, Academic Press, London, 1975 Search PubMed.
- K. Holmberg, B. Jönsson, B. Kronberg and B. Lindman, Surfactants and Polymers in Aqueous Solution, John Wiley & Sons Ltd, Great Britain, 2nd edn, 2003 Search PubMed.
- M. J. Rosen, Surfactants and Interfacial Phenomena, John Wiley & Sons Ltd, New Jersey, 3rd edn, 2004 Search PubMed.
- M. Guardia, E. Perris-Cardells, J. Sancenón and J. L. Carrión, Fluorimetric determination of binding constants between micelles and chemical systems, Microchem. J., 1991, 44, 193–200 CrossRef.
- K. Szymczyk and A. Taraba, Spectroscopic Studies of Triton X-114 and Quercetin/Rutin Solutions, J. Anal. Pharm. Res., 2017, 5(1), 00128, DOI:10.15406/japlr.2017.05.00128.
- W. Liu and R. Guo, Interaction of flavonoid, quercetin with organized molecular assemblies of nonionic surfactant, Colloids Surf., A, 2006, 274, 192–199 CrossRef CAS.
- O. Singh, R. Kaur and R. Kumar Mahajan, Flavonoid-surfactant interactions: A detailed physicochemical study, Spectrochim. Acta, Part A, 2017, 170, 77–88 CrossRef CAS PubMed.
- M. Palomar-Pardavé, G. Alarcón-Angeles, M. T. Ramírez-Silva, M. Romero-Romo, A. Rojas-Hernández and S. Corona-Avendaño, Electrochemical and spectrophotometric determination of the formation constants of the ascorbic acid-β-cyclodextrin and dopamine-β-cyclodextrin inclusion complexes, J. Inclusion Phenom. Macrocyclic Chem., 2011, 69, 91–99 CrossRef.
Footnote |
| † Electronic supplementary information (ESI) available. See DOI: 10.1039/c8ra01213j |
| This journal is © The Royal Society of Chemistry 2018 |


