 Open Access Article
Unbiased, complete solar charging of a neutral flow battery by a single Si photocathode†
Kristina Wedege a,
Dowon Bae
 b,
Emil Dražević
 a,
Adélio Mendes
 c,
Peter C. K. Vesborg
 *b and
Anders Bentien
 *a
*a
aDepartment of Engineering – Aarhus University, Hangøvej 2, DK-8200 Aarhus, Denmark. E-mail: bentien@eng.au.dk
bDepartment of Physics – Technical University of Denmark, Fysikvej Bygning 307, DK-2800 Kgs. Lyngby, Denmark. E-mail: peter.vesborg@fysik.dtu.dk
cLEPABE – Department of Chemical Engineering, University of Porto, Rua Dr Roberto Frias S/N P-4200-465, Porto, Portugal
First published on 8th February 2018
Abstract
Solar redox flow batteries have attracted attention as a possible integrated technology for simultaneous conversion and storage of solar energy. In this work, we review current efforts to design aqueous solar flow batteries in terms of battery electrolyte capacity, solar conversion efficiency and depth of solar charge. From a materials cost and design perspective, a simple, cost-efficient, aqueous solar redox flow battery will most likely incorporate only one semiconductor, and we demonstrate here a system where a single photocathode is accurately matched to the redox couples to allow for a complete solar charge. The single TiO2 protected Si photocathode with a catalytic Pt layer can fully solar charge a neutral TEMPO-sulfate/ferricyanide battery with a cell voltage of 0.35 V. An unbiased solar conversion efficiency of 1.6% is obtained and this system represents a new strategy in solar RFBs where a single silicon photocathode is paired with energetically suitable redox couples to build an integrated solar energy conversion and storage device with full realization of the energy storage capacity.
Introduction
Larger fractions of intermittent solar and wind power introduce challenges with stability and security of supply in the electricity grid, and for this reason, there are strong societal drivers for developing new storage and energy conversion technologies e.g. for delocalised electricity support systems. Direct solar charging of redox flow batteries (RFBs) was initially explored in the 1980s, but in recent years research in this field has re-emerged in parallel with development of aqueous RFBs based on organic redox pairs such as quinones.1–3 As a pure energy storage solution, aqueous RFBs are considered for grid-scale electricity storage because of their potential for significant reductions of the levelized cost of electricity storage, which expresses the cost of storing and discharging one kWh in a battery cycle.4 The most matured RFB technology is the 1.6 M all-vanadium RFB with a cell potential of 1.3 V and theoretical energy density of 27 Wh L−1.5‡ The interest in replacing metal-based redox pairs with organic ones stems from expected material cost reductions, higher solubility and tuneable redox potentials by molecular functionalization.3,6,7A solar redox flow battery is a combination of a photoelectrochemical (PEC) cell and a redox flow cell, where a photoelectrode immersed in one or both electrolytes upon illumination generates charge carriers which reduce or oxidise the dissolved redox species.1,8,9 PEC energy storage systems where redox species are reversibly reduced and oxidised in e.g. cells of the configuration semiconductor|redox-1 (l)||redox-2 (l)|inert electrode has been studied since 1976.10 Nonetheless, significant improvements beyond the proof-of-concept failed due to lack of efficient and low-cost photoelectrodes and efficient ion-selective membranes.1 Major technological and commercial advancements within RFBs, ion-selective membranes in particular and the immense development of photoelectrode materials from the solar water splitting research field makes it reasonable to believe that new discoveries within solar RFBs are within reach. The envisioned solar redox flow battery offers a completely integrated solar energy conversion and storage device that can deliver electrical power independent of the time of day. Notably, the purpose of such a device is two-fold in that (a) the solar energy should be converted directly into chemical energy by changing the oxidation state of the redox couples and (b) said redox couples should be able to be fully charged and discharged (i.e. reduced and oxidized) to constitute a functional redox flow battery with sufficient energy storage capacity. In a recent review of solar RFBs, it was pointed out that focus should be on the development of simple, aqueous based systems if conjoint advantages with emerging RFB technology are to be realised.8 This is in contrast to solar batteries based on e.g. organic solvents and semi-solid hybrid systems. Likewise, the importance of developing systems that work without external voltage bias to assist the redox reactions was highlighted. To this end, Fig. 1 summarizes the performance of recent aqueous, solar RFBs on theoretical energy density (Wh L−1), solar conversion efficiency and demonstrated achievable state-of-charge (SOC) (data extraction method are given in S1†). The energy density is a product of both the RFB cell potential and the solubility of the redox couples, and the RFB cell potential is shown as well for comparison. Additionally, the time scale of photoelectrode stability in some works is indicated. A curiosity of the system reported here is that the stability is limited by the chemical stability of one of the redox couples in light and not the stability of the photoelectrode in aqueous solution, as will be discussed later.
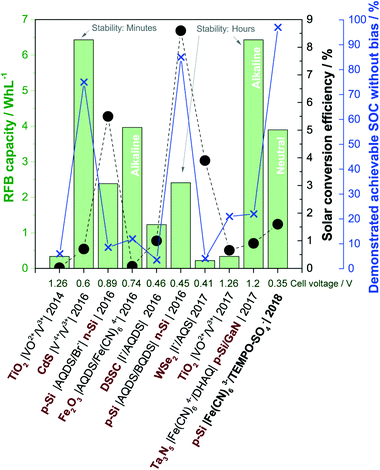 | ||
| Fig. 1 Performance of recently reported aqueous solar RFBs in terms of theoretical energy density (green columns, left green axis), solar conversion efficiency (black circles, black right axis) and demonstrated achievable state-of-charge (blue crosses, right blue axis). The captions indicate the cell configuration (semiconductor in red bold text), publication year and RFB cell voltage (abbreviations are given in S1†). The current work is written in bold. Reports from ref. 11–19. | ||
Up to now the predominant choices of redox species are vanadium, halogens and different (anthra)quinones, while photoelectrodes are (a) TiO2 as a wide-bandgap standalone photoanode11,18 or in a dye-sensitized solar cell configuration,15 (b) medium bandgap (around 2 eV, transition metal) n-type semiconductors12,14,17 or (c) a combination of p and n-type Si (and Ta3N5) for combined solar charging of both the anolyte and catholyte.16,19,20 Most systems operate in strongly acidic solutions, excluding two reports on alkaline systems both using ferro/ferricyanide and anthraquinone based redox species14,19 and one where an optimum pH of 2.9 was found.15 Reasons to keep the pH low include the predominance of vanadium and halogen redox species, which are only operable in an acidic environment, and in the case of WSe2 because of stability requirements. The energy density for all systems is no more than a tenth of the energy density of the all-vanadium RFB, which is a consequence of low concentrations of redox species (0.01–0.4 M) and in most cases a cell potential below 1 V. Reported solar conversion efficiencies are in the range from 0.02–8.6%, while the maximum achievable unassisted solar charging SOC ranges from 3.5–85%, excluding this work in which the RFB electrolytes can be fully charged. In the low SOC cases, it is clear that the devices are only partially functional as a standalone energy storage device, since the full capacity of the redox couples is not realised, and consequently, the (solar) RFB capacity reported in Fig. 1 would be exaggerated. Notably, early works on PEC storage systems had very little focus on achieving high SOCs as well but aimed mainly at building proof-of-concept systems with much focus on the chalcogenide photoelectrodes as described by Sharon et al.1 in a review where more than 50 works are characterized. The 2017 quite well-performing system of McKone et al.17 using WSe2 is essentially a reiteration of a system published in 1983, but in a significantly improved cell allowing for higher experimental control of the SOC.21
In terms of the parameters of Fig. 1 the so far most successful systems appear to be the ones exploiting a dual-semiconductor design, predominantly using Si with different versions of pn-junctions and protection layers.13,16,19 Si is widely studied for photoelectrochemical water splitting in electrolytes across the pH range, typically protected by thin layers of metal oxide or metal to mitigate inherent instability in aqueous solutions.22 However, even in the case of two Si electrodes being used to charge the BQDS/AQDS system with a small cell voltage, full solar charging is not demonstrated, likely as a consequence of a suboptimal photoelectrode and redox couple energy level match.16 Additionally, BQDS is regarded as an unstable RFB redox molecule.16,23,24
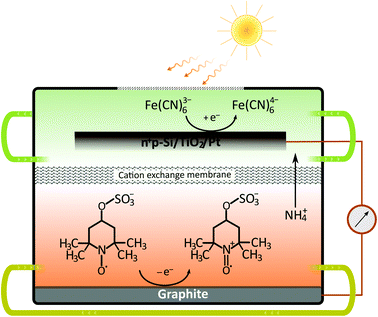
Although the dual-semiconductor solar RFB design can, in theory, provide sufficient photovoltage (>1 V) to match the cell potential in many established RFBs, a dual-semiconductor solar RFB would have to be illuminated on both semiconductor–liquid junction sides, which is challenging in terms of RFB cell design. Alternatively the photoelectrodes can be placed in a dual-bed configuration, however, this results in a large cathode–anode distance and thereby increased cell resistance. Furthermore, the theoretical limiting photocurrent of the dual-bed system is per se only half of that of a single-device system. Nonetheless, the advantages of using high-efficiency Si-based solar absorbers should be clear, and in the current work, we demonstrate a solar RFB (Fig. 2) based on a single-Si photocathode, in which a neutral RFB can be charged unbiased to almost 100% SOC unlike any previously reported single photoelectrode solar, aqueous RFB. Such high SOC can be reached because the redox potentials are accurately matched with the energy levels of the photocathode.
As should be clear from the above discussion of previous work on solar RFBs, a variety of interconnected parameters need to be taken into account to make solar RFBs a useful technology. This work is meant as an elucidation of the importance of considering the as yet downplayed aspect of accurate matching of energy levels to realise the full energy storage capacity of the redox couples in a simple one-photoelectrode device, experimentally and computationally.
Experimental
Electrolyte chemicals
K3Fe(CN)6 (Sigma-Aldrich, ≥99%) and K4Fe(CN)6·3H2O (Sigma-Aldrich ≥99.5%) were used as received. The synthesis of TEMPO-4-sulfate was based on a recent report.25 The sodium form was produced by a slightly modified method. 4-Hydroxy-TEMPO (Henan Tianfu Chemical Co. LTD, >99%) was mortared into powder using a ball mill (350 rpm for 10 min) and added to concentrated H2SO4 (Sigma Aldrich 97%) under stirring at a molar ratio of 0.044. The solution reacted at room temperature for 20 min and was transferred to a funnel and dripped slowly into a suspension of NaHCO3 (Sigma-Aldrich) resulting in a neutral, yellow solution. The solution was shaken with ethyl acetate (Sigma-Aldrich) and the ethyl acetate phase discarded, before concentrating the aqueous solution of the reaction product at 50 °C under reduced pressure (rotary evaporator) to a yellow/orange suspension. Acetone was added to precipitate Na2SO4. The acetone phase was then evaporated off under reduced pressure and the resulting red/orange salt was used without further purification. An FT-IR analysis is available in S2†. The compounds were dissolved in 1 M NH4Cl which had been adjusted to pH 7 by addition of NH4OH. The pH was measured with a MU 6100 L (VWR) electrode.Battery electrolyte evaluation
6 mL of each 0.4 M solution of TEMPO-4-sulfate sodium salt and K3Fe(CN)6 in 1 M NH4Cl at pH 7 were cycled in a single 4 cm2 homemade flow cell consisting of two graphite blocks, 1 mm Viton gaskets, three pieces of heat-treated carbon paper (400 °C, 4 hours) on each side and a cation exchange membrane for separation. The membrane was either Nafion-117 (Fuelcellstore) pretreated in 3% H2O2 at 80 °C or Fumapem14100 pretreated in 5% HNO3 at 80 °C. Fumapem14100 was chosen over the originally reported Fumasep F-930-RFD because the manufacturer states that it is less water permeable.25 Both membranes were soaked in 1 M NH4Cl for one day prior to testing. The battery electrolytes were pumped in Teflon and neoprene tubing using Teflon fittings at a flow rate of 70 mL min−1 with a peristaltic pump. Cycling tests were conducted at room temperature with a constant charging and discharging current using a battery testing system (Neware BTS CT-3008-5V3A-S1 (Shenzhen, China)). A resting time of 1 min was used before and after each charge or discharge cycle. In the test with Nafion, a current density of 6.1 mA cm−2 was applied and in the test with Fumapem14100 current densities of 12.5, 25 and 50 mA cm−2. Cyclic voltammograms (CVs) were recorded with a CHI 660E potentiostat in an electrochemical cell consisting of a freshly polished 3 mm diameter glassy carbon electrode (CHI), a Pt wire counter electrode and a saturated Ag/AgCl reference electrode. The solutions were purged with nitrogen before recording.Silicon photocathode preparation
The photocathodes were prepared as described elsewhere and used without further optimization.26 Briefly, a shallow pn+-junction was produced in p-type (100) Si wafers (Topsil, 1 to 20 Ω cm, boron-doped, acceptor density of 5 × 1019 cm−3) by n+ doping by a boron diffusion furnace process, which is expected to form a depletion width of about 600 nm (S5†). Then a layer of titanium was sputtered on to prevent silicon oxidation in the subsequent TiO2 reactive sputtering step at 400 °C. After TiO2 deposition, Pt was sputtered on at room temperature as a catalyst. The procedure resulted in an electrode of the configuration pn+Si/Ti (5 nm)/TiO2 (100 nm)/Pt (3 nm), hereafter denoted pn+Si/TiO2. In order to investigate the voltage behaviour, while excluding any effect of light, highly doped n+-Si wafers (phosphorus doped, <0.025 Ω cm) were subjected to the same protection layer treatment and these electrodes used to evaluate the open-circuit potential in the dark. The electrodes were contacted on the back side to a copper wire by attachment with a gallium–indium eutectic and silver conductive paste, and non-active areas covered with epoxy resin.Photocathode three-electrode characterization
Characterization in ferricyanide solution was carried out using a Pt counter electrode and an Ag/AgCl (3 M) reference electrode and a pn+Si/TiO2 photocathode as the working electrode. The cell has a 4 cm2 transparent window made from 3 mm thick acrylic plastic and the photocathode was placed behind approximately 2 mm of the solution and illuminated through this at 100 mW cm−2 (1 sun). All photocurrents in this work are given with reference to the illuminated area. The Newport 94011A solar simulator with AM 1.5 air mass filter was calibrated with a c-Si photodiode (Newport).27 The photoresponse was tested in 0.4 M ferri/ferrocyanide solutions in 1 M NH4Cl solution at pH 7. The half-cell SOC is given by and in the following referred to as SOC equivalent. The absorbance of these solutions diluted 300 times were measured in 1 cm polystyrene cuvettes (Sarstedt) using a Genesys 10S UV-VIS (Thermo Scientific).
Photoelectrochemical redox flow cell
Solar battery charging tests were carried out in a photochemical redox flow cell shown in S3†. The cell has a 1 cm2 1 mm thick quartz glass window through which the photocathode is illuminated, an active membrane area of 2.5 cm2 and a graphite anode. In these tests, Nafion was used because this improved cell sealing compared to Fumapem14100. Electrolytes were circulated through the cell by a peristaltic pump at 40 mL min−1, and the photocathode-to-window distance is approximately 1 mm, depending on the exact photocathode geometry since the non-active areas of the pn+Si/TiO2 were sealed with epoxy resin. The light source and potentiostat are as in the three-electrode characterization. The electrolytes (6 mL on each side) were charged in the RFB cell to the desired SOC (determined by a 15 min measurement of the open circuit voltage) and subsequently transferred to the photoelectrochemical flow cell.Results and discussion
Although the Si band-gap is 1.12 V the photocathode typically delivers a maximum of 0.5 V of photovoltage, which together with the absolute energy levels has to be taken into account if full solar charging is to be reached as is the purpose of the present work.26 The pn+Si/TiO2 photocathode has been operated both in alkaline and acidic environments for water splitting under applied bias. In the current study, the redox couples ferricyanide and TEMPO-sulfate give a suitable energetic combination for this electrode at pH 7.26,28,29 The supporting electrolyte is a neutral 1 M NH4Cl solution with the relatively high ionic conductivity of 95 mS cm−1.30 The choice of redox pairs is inspired by recently reported neutral and semi-organic RFBs.31–35 A neutral environment can be desirable since it is less corrosive to RFB cells and pumps and is safer when being handled on a large scale.Battery cycling
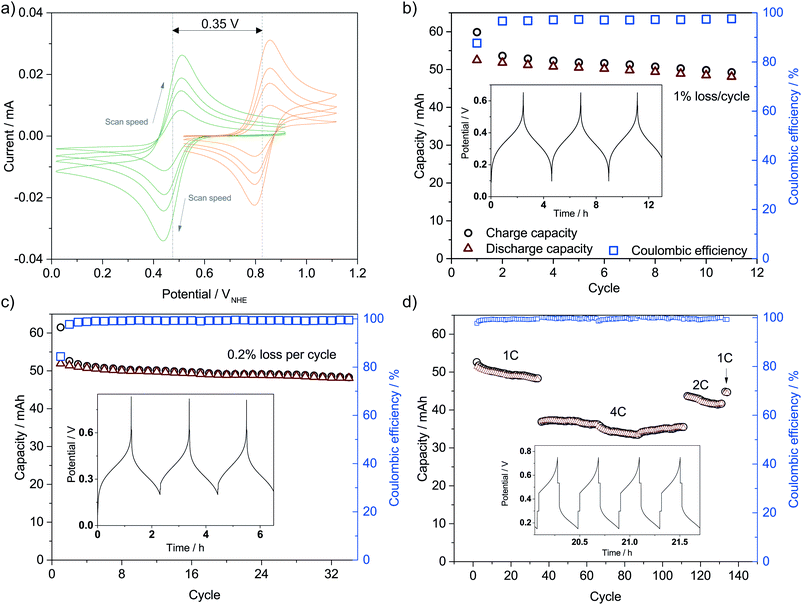
The catholyte consists of 0.4 M K3Fe(CN)6 with a pH-independent (above pH 7) redox potential of 0.475 V vs. the normal hydrogen electrode at pH 7 (VNHE) and 0.4 M TEMPO-4-sulfate with a redox potential of 0.826 VNHE as can be seen from the CVs in Fig. 3a. The redox potentials were evaluated as the mid-point potential between the anodic and cathodic peaks. Recently, TEMPO-sulfate has shown good capacity retention (>90% over + 1000 cycles) in a neutral Zn-hybrid flow battery. Here it is coupled with ferri/ferrocyanide operated in a neutral environment which has not previously been demonstrated.25 Both redox reactions (illustrated in Fig. 2) are one-electron transfers with apparent quasireversible kinetics as seen from the CVs. This results in a battery with a cell potential of 0.35 V. Battery cycling tests were conducted with two different membranes, Nafion (Fig. 3b) and Fumapem14100 (Fig. 3c). While the test with Nafion-117 in Fig. 3b shows that the battery can be cycled, in Fig. 3c parameters were improved, e.g. the lower cut-off voltage was increased to 0.2 V to prevent irreversible reduction of the TEMPO-sulfate, while the higher was increased to 0.8 V, which theoretically allows charging of the battery to 99.985%.25 Thus, the RFB is functional, however, the cell potential is somewhat low and can introduce issues with low energy cycling efficiency.36 Nonetheless the battery performs well and shows Nernstian behaviour (see also S4†), high coulombic efficiency and stability, especially under improved parameters of Fig. 3c, where the capacity loss per cycle is five times less than when using Nafion. Notably, the C-rate is only twice as high and it is a good indication that the perm-selectivity of the Fumapem14100 membrane is higher than that of Nafion, even though it is thinner (dry thickness 120 μm compared to 177 μm). In the first charging, 93 and 96% of the theoretical capacity are reached for the Nafion-117 and Fumapem14100 test, respectively, but decreases as the battery is cycled. Fig. 3d continues the test in c at higher current densities. It is clear that there is a capacity loss with cycling which can be explained by two mechanisms. The first is a crossover of redox couples through the membrane. CVs of the redox solutions after cycling (Fig. S4 in S4†) confirms that crossover is a major capacity loss mechanism, especially when using Nafion-117 compared to Fumapem14100. Futhermore, it is seen that ferricyanide has a much lower crossover in both membranes. Redox species crossover leads to capacity loss and coulombic efficiency that decreases proportionally to the cross-over. Here a slightly lower coulomb efficiency for the experiment with Nafion-117 is in fact observed. The second mechanism is degradation of ferricyanide, as noted by a blue coloration of tubes and membranes (S4†), which we attribute to the formation of Prussian blue from the ferri/ferrocyanide indicating potential long-term stability issues with this compound.37 The Prussian blue formation decreases the membrane permeability for the cations, so the resistance of the cell increases, which can also explain the lowered capacity with cycling. Nevertheless, the battery performance is satisfactory in the present context, which is only evaluating the performance of the photocathode as a function of SOC.Photoelectrode/redox pair energy level match
To ensure that the photoelectrode can charge the battery to high SOCs, the redox pair potentials and photoelectrode energy levels must be accurately matched. This is illustrated by the energy band diagram at 50% SOC in Fig. 4. The calculation details are found in S5,† where band diagrams for 0% and 95% SOC are also found. The main characteristic of the photoelectrode is the pn-junction, which creates an internal, constant band bending (built-in potential, Vbuilt-in) of 0.88 V regardless of electrolyte interactions.38 Setting the working potential of the system to 0.475 VNHE, which is the redox potential of the ferri/ferrocyanide solution at 50% SOC at pH 7, results in a calculated valence band position of the p-Si that coincides well with the measured open circuit potential (blue dotted line in Fig. 4) both under dark and light conditions. Considering the Ti, TiO2 and Pt layers, the junctions in between them generally results in depletion layers that are sufficiently thin for electron tunneling (ca. 2 nm, see S5†). They are necessary to protect Si from corrosion in the aqueous environment.26,28 Upon illumination, photoseparated electron and hole pairs enter the conduction and valence bands, respectively, and move as illustrated in the band diagram. Even at high SOCs (S5†) there is sufficient potential to drive the overall battery redox reaction. 95% SOC was chosen as a calculation example to illustrate the expected upper SOC area since theoretically 0.5 V is required to charge the battery to this extent and this matches the expected photocathode photovoltage. However, from the evaluated photovoltage of Fig. 4a of 0.52 V, a slightly higher reachable SOC of around 96–97% could be possible, as will be discussed later.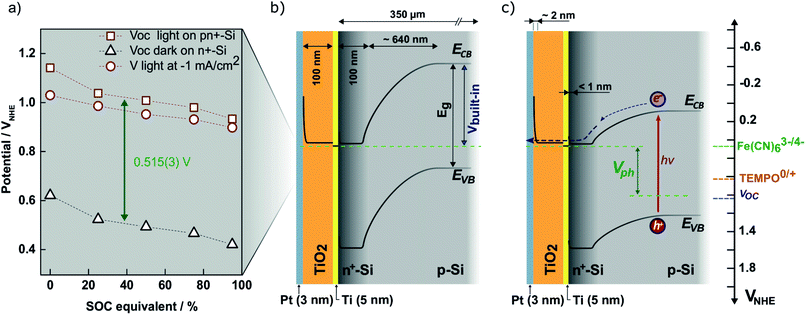 | ||
| Fig. 4 (a) Measured open-circuit potential of the photocathode (in the figure denoted pn+-Si) in SOC equivalent ferri/ferrocyanide solutions in the light (red squares) and in the dark measured on n+-Si with the same protection layers (black triangles). Also shown is the potential at which −1 mA cm−2 reductive photocurrent is reached on the photocathode (red circles). The photovoltage (Vph) is taken as the difference between the measured open-circuit voltages and is equal to 0.515 V across SOC. (b) The calculated band diagram of the photocathode at 50% SOC in the dark (see S5† for calculations and diagrams at 0% and 95% SOC). (c) The same band diagram at 50% SOC under illumination (hν). The ferri/ferrocyanide solution potential is shown in the upper green dotted line, while that of the TEMPO-sulfate solution is shown by the orange dotted line (denoted TEMPO0/+ in the figure). The measured open-circuit voltage of the photocathode in the light is shown by the blue dotted line. | ||
Photoelectrochemical characterization of pn+Si/TiO2
Fig. 5a shows linear sweep voltammograms (LSVs) for the photocathode, shifting between dark and light illumination in 0.4 M ferri/ferrocyanide solutions at different SOC equivalents. LSV in 1 M NH4Cl was recorded to evaluate the significance of parasitic water reduction (i.e. hydrogen evolution), which in all cases happens at a more reductive bias than needed for ferricyanide reduction. Up to 50% SOC equivalent, a photocurrent of around 12 mA cm−2 is reached. This is somewhat less than the photocurrent limit expected for an ideal version of the photocathode (≈40 mA cm−2) under AM1.5G illumination.39 In a water-splitting configuration (S6†) with both acidic (1 M HCl) and neutral solutions (1 M NH4Cl and 1 M KCl) a photocurrent of 20 mA cm−2 was obtained. This is the expected value taking the lowered transmittance (see S7†) of the TiO2 and Pt layer and acrylic PEC cell window into account (92% above 400 nm).40 The lower 12 mA cm−2 maximum photocurrent is explained by the light absorption up to 450 nm of the ferri/ferrocyanide solutions as seen from Fig. 5b and S7†. As the SOC increases from 0 to 50% the ferri/ferrocyanide solution becomes increasingly transparent (Fig. 5b) and counterbalances the expected decrease of the photocurrent with SOC. At 75% and above the photocurrent decreases and the LSVs show mass transfer effects as seen from the transients in the light–dark chopped curve. Around 0.1 VNHE, the cathodic current increase (particularly under continuous light) at 75% and 95% SOC equivalent is probably due to water reduction as a competing reaction. However, due to the high bias voltage, this has no practical significance.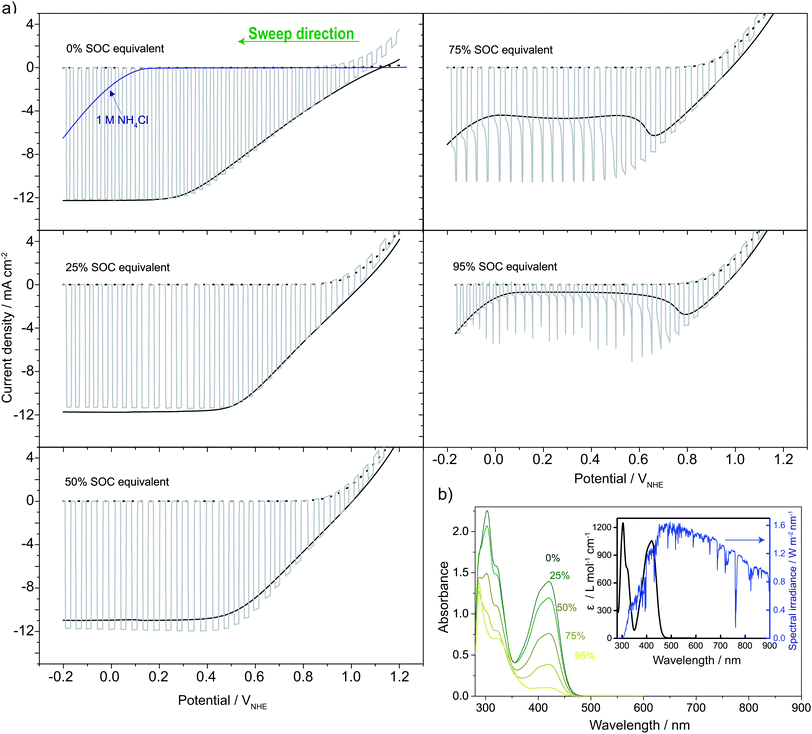 | ||
| Fig. 5 (a) LSVs recorded on pn+Si/TiO2 in 0.4 M ferro/ferricyanide solutions in ratios matching that expected for different SOCs in the solar flow battery (SOC equivalents) and of the pure supporting electrolyte (1 M NH4Cl displayed with the 0% SOC equivalent, blue line) relative to a reference electrode. Recorded in constant light (1 sun, full black line), chopped (full grey line) and dark (dotted black line behind chopped). (b) The measured absorbance of the SOC equivalent solutions (diluted 300 times) and the inset shows the calculated associated extinction coefficient (black) overlayed on the AM1.5G spectrum (blue) (see S7†).27 | ||
As illustrated by the water-splitting experiments in S6,† the voltage range from the photocurrent onset and until the limiting photocurrent is reached is increased significantly by the less ionic conductive neutral solution (450 mV) compared to the highly conductive acidic case (250 mV). This is relatable to the LSVs in Fig. 5, where similar long voltage ranges are observed. From this, it appears that the choice of a neutral electrolyte is limiting to the Si photoelectrode performance and that increasing the ionic strength could boost the performance rather easily.
Solar flow cell test
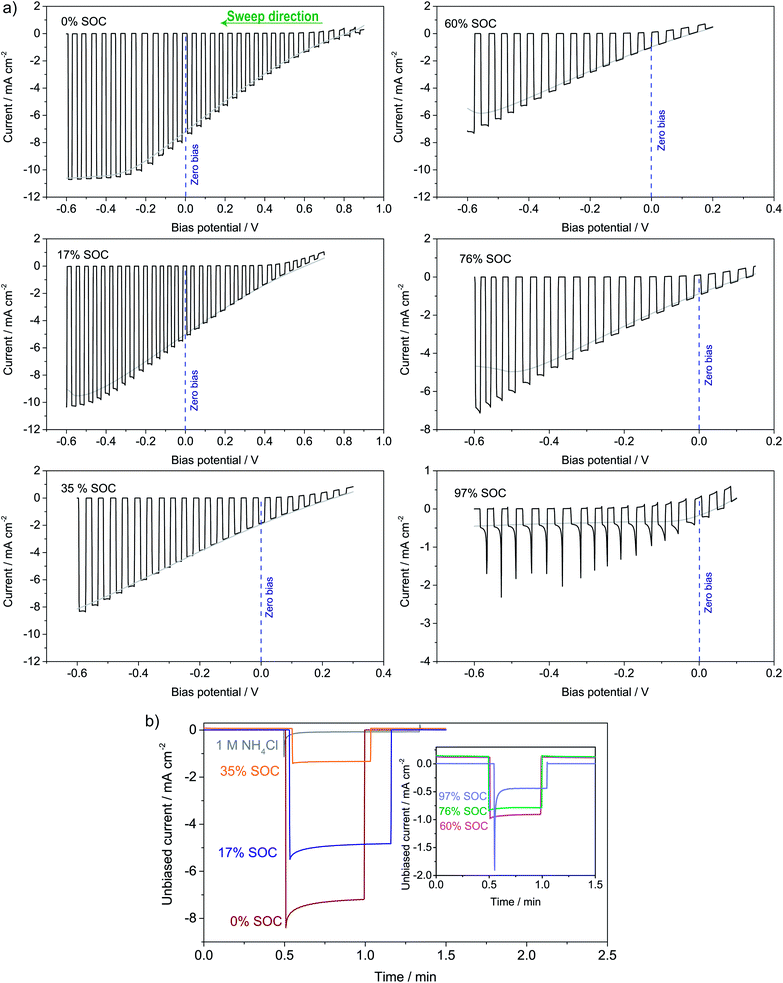
The photoelectrochemical performance of the full solar flow battery was characterized at different SOCs from 0 to 97% by (a) LSV curves and (b) unbiased photoresponse shown in Fig. 6a and b, respectively. The photocurrent at the zero-bias potential in the LSV curves (indicated with a dotted blue line) agrees well with the magnitudes of the photocurrents in the unbiased measurements. A similar test was conducted in a non-flow batch solar RFB cell (S8†), where smaller photocurrents generally were observed due to larger light absorption by the solution, but which shows that mass transfer effects appear at roughly 50% SOC in the absence of electrolyte flow. It is seen that at all SOCs tested, there is an unbiased photoelectrochemical reductive response, even at 97% SOC. From the photovoltage in Fig. 4a, 96% SOC represents an estimated upper limit, so the photocurrent observed at 97% SOC (−0.5 mA cm−2) might be due to an unidentified parasitic reaction or a small experimental error in SOC determination from the open-circuit potential. Nevertheless, from S8† it is clear that at 95% SOC the solar charging process works without bias. Generally, the data in Fig. 6 and S8† confirms the calculations of the band diagram in Fig. 4 and S5,† since the photocurrent onset potential moves negatively with increasing SOC.Longer solar charging tests were also carried out, and a 140 min illumination test is shown in S9,† where the potential i.e. the SOC increases under illumination and with zero bias. Longer tests were challenged by light-induced precipitation of a red compound, likely iron oxide, which blocked the membrane (picture in S9†). This has been observed previously, and it limits the use of iron cyanide compounds in solar RFBs.19 A photocathode stability test can be seen in S10,† where the photocurrent drops over time, but is restored (even improved a little) when adding fresh electrolyte and this shows that the stability issue is related to ferricyanide and not photoelectrode degradation. This is in contrast to solar RFBs operated with Si in strongly alkaline or acidic electrolytes, where the photoelectrode stability limits performance.
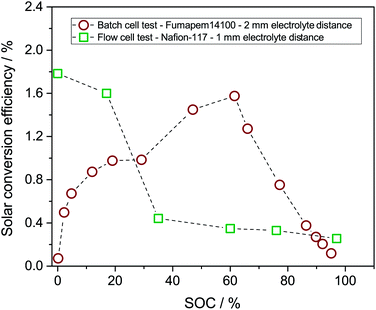
The solar conversion efficiency reported in Fig. 1 is 1.6% from the unbiased test at 17% SOC for a fair comparison with other works. Notably, a previously unaddressed complication when reporting solar conversion efficiencies for solar RFBs is the change in solar conversion efficiency as a function of SOC. As the battery charges, the potential required to continue charging it increases as is evident from the Nernst equation (see Fig. S3 in S4†). The energy levels of the redox couples move (see Fig. S7 in S5† for a graphical illustration), and the solution is in essence depleted of reactive reagent (the uncharged redox couple), so the photocurrent will usually decrease as the SOC increases.12,14 Increased transparency of the electrolyte with increasing SOC might counterbalance this effect, as is the case here. In Fig. 7, we show the solar conversion efficiency as a function of SOC for two experimental series, namely the flow cell test of Fig. 6 and the batch cell test found in S8.† The difference between testing conditions in these two test series is that in the flow cell the window–photoelectrode distance is approximately 1 mm, the membrane is Nafion-117 (due to superior cell sealing properties of this membrane) and the electrolyte volume is 6 mL on each side. In the batch cell, the window–photoelectrode distance is approximately 2 mm, the membrane is Fumapem14100 and the electrolyte volume 25 mL on each side. We use the simple efficiency calculation suggested by McKone et al.:17  where ΔEcell is the full cell potential (open circuit potential of the battery at the indicated SOC), Jphoto is the measured photocurrent in mA cm−2 and Pin is the solar incident power density equal to 100 mW cm−2 for 1 sun. Clearly, there is a difference in behaviour, wherein the batch cell test the efficiency is low at lower SOCs due to the light absorbance of the redox solution rich in ferricyanide, but increases to roughly 1.6% at 60% SOC. In contrast, for the flow cell test, the efficiency is highest at low SOC and decreases quite steeply after the 17% SOC test which we attribute to (a) clogging of the Nafion membrane as seen in Fig. S13 in S9† and (b) diminished photoelectrode performance due to both visible precipitation on the photoelectrode (which in this cell is kept in a horizontal position) and a decrease in concentration of ferricyanide from the same precipitation. This clogging was not observed in the batch cell due to its vertical design and significantly larger electrolyte volume. In terms of device evaluation, it is important to consider the change in efficiency with SOC, since only reporting the maximum efficiency obtained at low SOC can be misleading in terms of the overall performance.
From the band diagram calculations (Fig. 4 and S5†), the 0.52 V photovoltage and three-electrode LSVs (Fig. 5) at different SOC equivalents, it can be expected that the photocathode can in principle charge the flow battery with zero bias. This is confirmed experimentally in Fig. 6, but it is also observed that the unbiased photocurrent is lower than that expected from tests in an acidic and transparent solution. We would expect that higher photocurrents are possible with optimization of the protection layers and in a cell where the window–photoelectrode distance is as small as possible. As discussed earlier, the long voltage range from the photocurrent onset to the photocurrent limit is limiting to the efficiency, but could potentially be addressed by increasing the ionic strength of the supporting electrolyte. This would increase the overall solar charging efficiency significantly, without even considering optimization of the photocathode itself. However, at this point, the obtained results are sufficient for demonstrating the usability of a Si photocathode in the neutral RFB.
In future systems, it should be possible to overcome the redox pair instability by exchanging the ferri/ferrocyanide solution with other solutions of redox species with higher light stability. An important limitation to circumvent is the strong light absorption of the redox pairs, which diminishes the performance of all solar RFBs described in the literature. Obvious solutions on the cell design level are either minimizing window–photoelectrode distance or use back-illuminated cell designs and photoelectrodes.41
From the advances in the field during the past few years, it is clear that the envisioned, cost-effective solar RFBs still are challenged by issues related to stability, modest efficiency, low electrolyte energy density and low depth of solar charge. As shown in the present work it is important to choose semiconductor–electrolyte combinations that are energetically well-matched to allow for charging to high SOC, if the end device is indeed intended for energy storage and not only solar energy conversion.
Conclusions
We demonstrate the use of a single TiO2 protected Si-photocathode in an aqueous, neutral, semi-organic solar RFB with an efficiency around 1.6% and electrolyte energy density of 3.9 Wh L−1 from 0–95% SOC. The energy levels of the RFB redox couples and semiconductor band edges are accurately matched, as evidenced by both theoretical band diagram calculations and experimental results. However, the use of ferricyanide under illumination imposes stability problems limiting this solar flow battery. Parasitic optical losses by the electrolyte, photocathode protection layers and catalyst overlayers together with relatively low electrolyte conductivity are identified as the main mechanism for lowering the conversion efficiency and significantly higher efficiencies can be reached by optimisation of these points.Conflicts of interest
There are no conflicts to declare.Acknowledgements
This work was supported by the Danish Council for Independent Research, Technology & Production (Grant agreement no. DFF-4005-00517). E. Drazevic is grateful to the Marie Sklodowska-Curie Individual Fellowship (H2020-MSCA-IF-2014). D. Bae and P. C. K. Vesborg acknowledge the support by a research grant from the Villum Foundation (9455).References
- M. Sharon, P. Veluchamy, C. Natarajan and D. Kumar, Electrochim. Acta, 1991, 36, 1107–1126 CrossRef CAS.
- B. Yang, L. Hoober-Burkhardt, F. Wang, G. K. S. Prakash and S. R. Narayanan, J. Electrochem. Soc., 2014, 161, A1371–A1380 CrossRef CAS.
- B. Huskinson, M. P. Marshak, C. Suh, S. Er, M. R. Gerhardt, C. J. Galvin, X. Chen, A. Aspuru-Guzik, R. G. Gordon and M. J. Aziz, Nature, 2014, 505, 195–198 CrossRef CAS PubMed.
- M. Obi, S. M. Jensen, J. B. Ferris and R. B. Bass, Renewable Sustainable Energy Rev., 2017, 67, 908–920 CrossRef.
- J. Winsberg, T. Hagemann, T. Janoschka, M. D. Hager and U. S. Schubert, Angew. Chem., Int. Ed., 2017, 56, 686–711 CrossRef CAS PubMed.
- S. Er, C. Suh, M. P. Marshak and A. Aspuru-Guzik, Chem. Sci., 2015, 6, 885–893 RSC.
- K. Wedege, E. Dražević, D. Konya and A. Bentien, Sci. Rep., 2016, 6, 39101 CrossRef CAS PubMed.
- M. Yu, W. D. McCulloch, Z. Huang, B. B. Trang, J. Lu, K. Amine and Y. Wu, J. Mater. Chem. A, 2016, 4, 2766–2782 CAS.
- B. Luo, D. Ye and L. Wang, Adv. Sci., 2017, 1700104 CrossRef PubMed.
- G. Hodes, J. Manassen and D. Cahen, Nature, 1976, 261, 403–404 CrossRef CAS.
- Z. Wei, D. Liu, C. Hsu and F. Liu, Electrochem. Commun., 2014, 45, 79–82 CrossRef CAS.
- J. Azevedo, T. Seipp, J. Burfeind, C. Sousa, A. Bentien, J. P. Araújo and A. Mendes, Nano Energy, 2016, 22, 396–405 CrossRef CAS.
- S. Liao, X. Zong, B. Seger, T. Pedersen, T. Yao, C. Ding, J. Shi, J. Chen and C. Li, Nat. Commun., 2016, 7, 11474 CrossRef CAS PubMed.
- K. Wedege, J. Azevedo, A. Khataee, A. Bentien and A. Mendes, Angew. Chem., Int. Ed., 2016, 55, 7142–7147 CrossRef CAS PubMed.
- W. D. McCulloch, M. Yu and Y. Wu, ACS Energy Lett., 2016, 1, 578–582 CrossRef CAS.
- W. Li, H.-C. Fu, L. Li, M. Cabán-Acevedo, J.-H. He and S. Jin, Angew. Chem., Int. Ed., 2016, 55, 13104–13108 CrossRef CAS PubMed.
- J. R. McKone, F. J. DiSalvo and H. D. Abruña, J. Mater. Chem. A, 2017, 5, 5362–5372 CAS.
- Z. Wei, Y. Shen, D. Liu and F. Liu, Sci. Rep., 2017, 7, 629 CrossRef PubMed.
- Q. Cheng, W. Fan, Y. He, P. Ma, S. Vanka, S. Fan, Z. Mi and D. Wang, Adv. Mater., 2017, 29, 1700312 CrossRef PubMed.
- M. Yu, X. Ren, L. Ma and Y. Wu, Nat. Commun., 2014, 5, 5111 CrossRef CAS PubMed.
- B. Keita and L. Nadjo, J. Electroanal. Chem. Interfacial Electrochem., 1983, 151, 283–288 CrossRef CAS.
- D. Bae, B. Seger, P. C. K. Vesborg, O. Hansen and I. Chorkendorff, Chem. Soc. Rev., 2017, 46, 1933–1954 RSC.
- B. Yang, L. Hoober-Burkhardt, S. Krishnamoorthy, A. Murali, G. K. S. Prakash and S. R. Narayanan, J. Electrochem. Soc., 2016, 163, A1442–A1449 CrossRef CAS.
- L. Hoober-Burkhardt, S. Krishnamoorthy, B. Yang, A. Murali, A. Nirmalchandar, G. K. S. Prakash and S. R. Narayanan, J. Electrochem. Soc., 2017, 164, A600–A607 CrossRef CAS.
- J. Winsberg, C. Stolze, A. Schwenke, S. Muench, M. D. Hager and U. S. Schubert, ACS Energy Lett., 2017, 2, 411–416 CrossRef CAS.
- B. Seger, T. Pedersen, A. B. Laursen, P. C. K. Vesborg, O. Hansen and I. Chorkendorff, J. Am. Chem. Soc., 2013, 135, 1057–1064 CrossRef CAS PubMed.
- A. S. F. Testing and Materials, ASTM G173-03 Terrestrial (AM1.5) Reference Spectra, 2003 Search PubMed.
- D. Bae, B. Mei, R. Frydendal, T. Pedersen, B. Seger, O. Hansen, P. C. K. Vesborg and I. Chorkendorff, ChemElectroChem, 2016, 3, 1546–1552 CrossRef CAS.
- D. Bae, S. Shayestehaminzadeh, E. B. Thorsteinsson, T. Pedersen, O. Hansen, B. Seger, P. C. K. Vesborg, S. Ólafsson and I. Chorkendorff, Sol. Energy Mater. Sol. Cells, 2016, 144, 758–765 CrossRef CAS.
- W. M. Haynes, CRC Handbook of Chemistry and Physics, CRC Press, 93rd edn, 2016 Search PubMed.
- T. Liu, X. Wei, Z. Nie, V. Sprenkle and W. Wang, Adv. Energy Mater., 2016, 6, 1501449 CrossRef.
- T. Janoschka, N. Martin, U. Martin, C. Friebe, S. Morgenstern, H. Hiller, M. D. Hager and U. S. Schubert, Nature, 2015, 527, 78–81 CrossRef CAS PubMed.
- T. Janoschka, N. Martin, M. D. Hager and U. S. Schubert, Angew. Chem., Int. Ed., 2016, 55, 14427–14430 CrossRef CAS PubMed.
- B. Hu, C. DeBruler, Z. Rhodes and T. L. Liu, J. Am. Chem. Soc., 2017, 139, 1207–1214 CrossRef CAS PubMed.
- E. S. Beh, D. De Porcellinis, R. L. Gracia, K. T. Xia, R. G. Gordon and M. J. Aziz, ACS Energy Lett., 2017, 2, 639–644 CrossRef CAS.
- A. Khataee, K. Wedege, E. Dražević and A. Bentien, J. Mater. Chem. A, 2017, 5, 21875–21882 CAS.
- H. G. Völz, J. Kischkewitz, P. Woditsch, A. Westerhaus, W.-D. Griebler, M. De Liedekerke, G. Buxbaum, H. Printzen, M. Mansmann, D. Räde, G. Trenczek, V. Wilhelm, S. Schwarz, H. Wienand, J. Adel, G. Adrian, K. Brandt, W. B. Cork, H. Winkeler, W. Mayer, K. Schneider, L. Leitner, H. Kathrein, E. Schwab, H. Jakusch, M. Ohlinger, R. Veitch, G. Etzrodt, G. Pfaff, K.-D. Franz, R. Emmert, K. Nitta, R. Besold and H. Gaedcke, in Ullmann's Encyclopedia of Industrial Chemistry, Wiley-VCH Verlag GmbH & Co. KGaA, 2000, ch. 3, p. 92 Search PubMed.
- E. L. Warren, S. W. Boettcher, M. G. Walter, H. A. Atwater and N. S. Lewis, J. Phys. Chem. C, 2011, 115, 594–598 CAS.
- D. Bae, T. Pedersen, B. Seger, M. Malizia, A. Kuznetsov, O. Hansen, I. Chorkendorff and P. C. K. Vesborg, Energy Environ. Sci., 2015, 8, 650–660 CAS.
- C. Joram, Transmission curves of plexiglass (PMMA) and optical grease, CERN Technical Report PH-EP-Tech-Note-2009-003, 2009 Search PubMed.
- R. Antony, P. Saurabh, F. Abdi, S. Chiam, Y. Ren, J. Barber, J. Loo and L. Helena Wong, Electrochim. Acta, 2016, 211, 173–182 CrossRef CAS.
Footnotes |
| † Electronic supplementary information (ESI) available: Additional data and experimental descriptions. See DOI: 10.1039/c8ra00319j |
| ‡ See S1, ESI† regarding theoretical energy density. |
| This journal is © The Royal Society of Chemistry 2018 |

