 Open Access Article
Graphene-based anticorrosive coatings for copper
M. Ajay
Krishnan
 a,
Karanveer S.
Aneja
a,
Aasiya
Shaikh
a,
Sivasambu
Bohm
a,
Karanveer S.
Aneja
a,
Aasiya
Shaikh
a,
Sivasambu
Bohm
 *abc,
Kuntal
Sarkar
 a,
H. L. Mallika
Bohm
b and
V. S.
Raja
*a
aDepartment of Metallurgical Engineering and Materials Science, IIT Bombay, Powai, Mumbai, India. E-mail: vsraja@iitb.ac.in
bTalga Technologies Limited, Unit 15 Cambridge Science Park, Milton Road, CB4 0FQ, UK
cCambridge Graphene Centre, University of Cambridge, 9 JJ Thomson Avenue, Cambridge CB3 0FA, UK. E-mail: sb2209@cam.ac.uk
First published on 2nd January 2018
Abstract
The present study was focused on the development of environmentally friendly graphene-based anti-corrosive coatings and understanding the effect of these coatings on the electrochemical corrosion behavior of copper. Through effective functionalization of graphene (<=5 layers) with 3-aminopropyltriethoxysilane (APTES), the corrosion current density was reduced by ∼20 times in magnitude as compared to that of the uncoated copper. This enhanced corrosion protection is attributed to the high surface area of graphene, electrochemically produced highly conductive few layer graphene, its barrier properties, reduced water uptake/oxygen/salt permeation, and homogeneous dispersion of graphene throughout the coating.
Introduction
Copper is known to the mankind as one of the most versatile engineering materials developed to date. It is the primary choice for a wide range of applications owing to its thermal and electrical conductivity, corrosion resistance, and reasonable mechanical properties. It is widely used for water-cooling systems, desalination plants, and heat exchangers. However, copper is not immune to corrosion and forms oxide films of various kinds depending on the nature of the environment it is exposed to, thereby requiring further protection by coatings. Conventional organic, inorganic, and metallic anticorrosive coatings have been developed to protect copper from corrosion.1–7 However, the use of volatile organic compounds or high pigment volume concentration in organic coatings has created environmental hazards. In addition, these coatings are believed to alter the attractive electrical and thermal properties of copper.8 Therefore, there exists a necessity to develop coating systems that are not harmful to the environment and at the same time do not interfere with the characteristic properties of the material.Recently, graphene has attracted significant interest since it possess exceptionally high electrical and thermal conductivity, strength, and ductility.9,10 In addition, graphene has been proven to be chemically inert to aggressive acids, such as HF, and impermeable to gases.11,12 These inherent advantages have ascertained that graphene can be used as an anti-corrosive coating material. Bohm13 suggested that the high surface area and the hydrophobic nature of graphene played vital roles in corrosion mitigation.13 Further, Krikland et al.14 reported that CVD-grown graphene coatings on copper substrates decreased the corrosion rate by stifling the cathodic kinetics. On the contrary, Raman et al.15 have mentioned that CVD-grown graphene on copper decreases both anodic and cathodic current densities; this causes a reduction in the corrosion rate. Singh et al. reported that a reduced graphene oxide (rGO)-polymer composite coating on copper decreases the corrosion rate by an order of magnitude.16 However, production of rGO using modified Hummers method will lead to highly defective graphene. Furthermore, coatings obtained via chemical vapor deposition (CVD) lack industrial scalability and face cost constraints. Furthermore, since there is no evidence of chemical (covalent) bonding formation in these coating systems, they are expected to have poor adhesion and sustainability.17 Hence, for an effective graphene-based coating system, it is imperative to have a scalable, cost effective, and chemically bonded coating system.
The key issue low cost commercial unavailability of large quantities of low-cost and defect-free graphene is a major bottleneck in using graphene for coating applications. Paton et al.18 demonstrated scalable and cost-effective production of graphene using a high sheer liquid exfoliation route. Although the method was successful on many fronts, the use of an organic solvent as a liquid medium and the low yield were undesirable. For this method to be an industrially viable process, it was important to use an environmentally friendly solvent and improve the yield of the process.
This study was aimed at producing graphene using a modified version of the high shear exfoliation route using electrochemically produced expanded micrographite (EMG) and graphene nano platelets (GNP). The use of deionized water as a solvent with suitable surfactants and dispersing agents facilitates the increase in yield and minimizes the volatile content of this process. The produced high quality graphene was functionalized (in different weight ratios) with 3-aminopropyltriethoxysilane (APTES). Functionalization of graphene ensures covalent bonding of graphene flakes with the copper surface upon application. The electrochemical corrosion behavior of coated Cu panels was studied in 3.5 wt% NaCl.
Experimental methods & procedure
Electrochemically exfoliated expanded nano graphite/graphene nano platelets (Talga Resources Limited – Vittangi Graphite Deposit) were used as a raw material in this study. An amino-functional silane, i.e. 3-aminopropyltriethoxysilane (APTES) (Sigma Aldrich), was used to functionalize graphene and acted as a chemical linker between the metal and the graphene platelets. The functionalized graphene coating was applied on a cleaned copper panel using a bar applicator. Graphene was produced using the high shear liquid exfoliation route. Herein, 250 g of graphite was added to 1.5 L of distilled water containing cationic surfactants such as SDDS (sodium dodecyl sulfate) or sodium lauryl sulfate or any other high-molecular weight block copolymer graphene-affinic groups. The aqueous dispersion of graphite was exfoliated into graphene using a high shear mixer (Ross-L5MA) operating at 8000 rpm for 8 h.19 After exfoliation, the exfoliated few-layer graphene platelets were separated from the residual graphite by high speed centrifugation (REMI R-24) at 10![[thin space (1/6-em)]](https://www.rsc.org/images/entities/char_2009.gif) 000 rpm for 30 minutes. A supernatant containing few-layer graphene platelets was used for coating composition.
000 rpm for 30 minutes. A supernatant containing few-layer graphene platelets was used for coating composition.
APTES was hydrolyzed with acidified water (pH = 4) in the molar ratio of 1![[thin space (1/6-em)]](https://www.rsc.org/images/entities/char_2009.gif) :
:![[thin space (1/6-em)]](https://www.rsc.org/images/entities/char_2009.gif) 2.5. The solution was continuously stirred for 24 hours to complete the hydrolysis reaction. Hydrolysis causes protonation of the amino group and substitution of the –OC2H5 group in the APTES by the –OH group. The protonated amino group chemically links with the graphene edge atoms, whereas the hydroxyl group helps in interlinking silica groups and hence formation of a three-dimensional network of coating. Graphene edges have sp2 carbon atoms in which the electrons in the z-orbital remain free to react. The protonated amino group (–NH3+) of hydrolyzed APTES undergoes an electrophilic addition reaction to form a covalent bond between nitrogen of the amine group and the edge carbon atoms of graphene, as reported by Aneja et al.20
2.5. The solution was continuously stirred for 24 hours to complete the hydrolysis reaction. Hydrolysis causes protonation of the amino group and substitution of the –OC2H5 group in the APTES by the –OH group. The protonated amino group chemically links with the graphene edge atoms, whereas the hydroxyl group helps in interlinking silica groups and hence formation of a three-dimensional network of coating. Graphene edges have sp2 carbon atoms in which the electrons in the z-orbital remain free to react. The protonated amino group (–NH3+) of hydrolyzed APTES undergoes an electrophilic addition reaction to form a covalent bond between nitrogen of the amine group and the edge carbon atoms of graphene, as reported by Aneja et al.20
Copper panels & foils of 50 mm × 50 mm were cleaned using the standard metallographic procedure and further treated with concentrated nitric acid solution at room temperature for 5 min to remove any residual contamination. Coating formulations with different weight ratios of graphene were prepared by constant stirring for about 2 hours. The prepared formulation was then applied onto the copper panels by the bar coating method with a wet film thickness of 5–10 μm, Dry Film Thickness (DFT) 1–2 μm. The applied coating was cured at 120 °C for 2 minutes and further dried at room temperature for complete cross linking for 1 h.
Graphene produced was analyzed using a confocal Raman spectroscope (Horiba HR 8000) to identify the number of layers of graphene and the presence of defects. The images of the dispersed graphene solution were examined using a field emission transmission electron microscope operating at 200 kV. A scanning electron microscope was used to measure the flake size and observe the topographic features of graphene. Cross-sections of the functionalized graphene-coated samples were prepared for measuring the coating thickness and to understand the extent of dispersion of carbon (graphene) in the coating through elemental mapping. Fourier transform infrared spectroscopy (FTIR) analysis was carried out using the 3000 Hyperion Microscope with a Vertex 80 FTIR System Bruker, Germany, in the range from 400 to 4000 cm−1 to estimate the presence of different functional groups in the compound. X-ray photoelectron spectroscopy (XPS) data were obtained using an AXIS Supra instrument from Kratos Analytical in the range of 1–1200 eV to investigate the surface chemical composition of the pure graphene and APTES functionalized graphene. The electrochemical corrosion behaviors of the coated and uncoated (bare) samples were studied using potentiodynamic polarization and electrochemical impedance spectroscopy (EIS) according to ASTM-G59. These studies were carried out using a Biologic VSP potentiostat with a three-electrode system in 3.5 wt% NaC such that the coated metal/uncoated metal formed the working electrode, a platinum sheet was used as the counter electrode, and a saturated calomel electrode was used as the reference electrode. Potentiodynamic polarization tests were carried out at a scan rate 0.5 mV s−1, and the tests were triplicated for accuracy. EIS studies were conducted at OCP by applying a sinusoidal voltage of ±10 mV amplitude in the frequency range from 100 kHz to 10 mHz. Biologic software (EC-Lab V10.17) was used for fitting the impedance data.
Results and discussion
Graphene characterization
The characteristic Raman peaks of micro graphite and graphene produced through the liquid exfoliation route are shown in Fig. 1.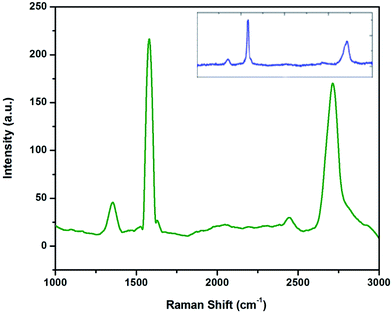 | ||
| Fig. 1 Raman spectra of graphene and Talga expanded micro graphite (inset) showing D, G, and 2D peaks. | ||
The difference between the 2D peaks of micro graphite (inset) and graphene can be clearly observed. The 2D-band of graphene is symmetric in shape, whereas multiple peaks are visible in the 2D-band of micro graphite. The low intensity of the D band (at 1350 cm−1) along with the low D/G intensity ratio is an indication of low defect concentrations in graphene. This graphene production has been reported earlier.21 The G/2D ratio of 0.6 along with the symmetric shape and the position of the 2D peak reveals that less than five layers of graphene are produced.22 The TEM images and spot patterns of the selected area diffraction and HR TEM images shown in Fig. 2 further prove that the graphene produced has only a few layers.
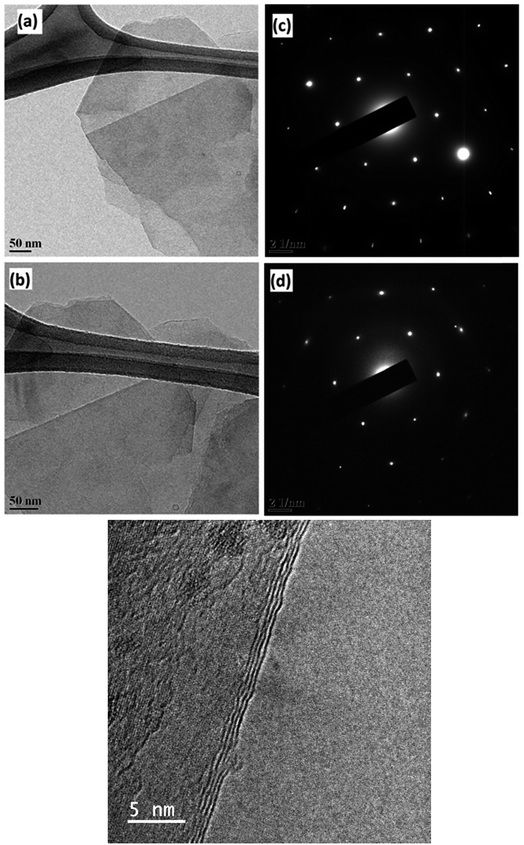 | ||
| Fig. 2 TEM images [(a) and (b)] showing few layers of graphene and their corresponding diffraction patterns [c & d] showing six-membered rings. (e) HRTEM images showing few layers of graphene. | ||
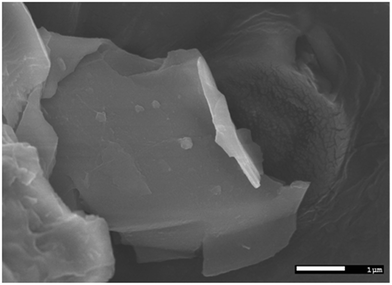
It is quite evident that the selected area diffraction patterns show six-fold symmetry and high crystallinity as expected. In addition, the scanning electron microscopy image (Fig. 3) confirmed that the lateral width of the graphene flakes was ∼3 μm on an average.
Structural analysis of coating
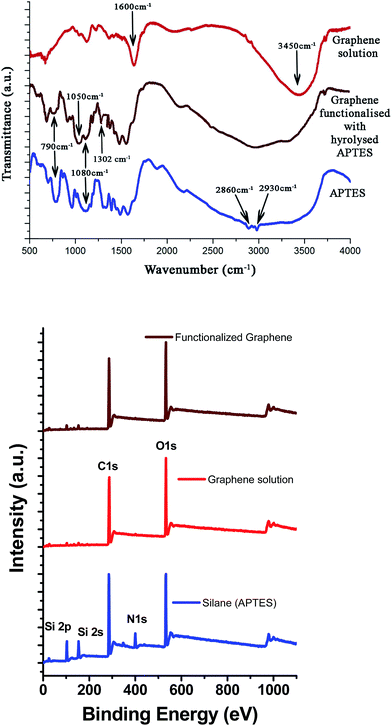
FTIR spectra of hydrolyzed APTES, graphene, and functionalized graphene obtained using APTES are shown in Fig. 4.The structural changes accompanying hydrolysis of APTES and subsequent functionalization of graphene were examined using FTIR. The 790 cm−1 and 1080 cm−1 peaks in the APTES spectra are attributed to the silicone (Si–O–C) vibration band and correspond to symmetric and asymmetry stretching, respectively. These peaks diminish upon hydrolysis and condensation, whereas the Si–O–Si stretching vibration peak at 1050 cm−1 is observed prominently.20 Moreover, two close peaks at 2860 cm−1 and 2930 cm−1 represent the symmetric and asymmetric vibrations of CH2 groups occurring in the alkyl chains of APTES and narrow down in the case of hydrolysed APTES, respectively.23 The graphene FTIR spectrum shows a C–C stretching peak at around 1600 cm−1. The peak at 3450 cm−1 in the graphene FTIR spectra is due to the –OH vibration as a result of residual water. In the case of the APTES-functionalized grapheme, a broad peak centered at 2900 cm−1 arises due to the hydroxyl groups of both graphene and hydrolyzed APTES attached to graphene. Fig. 4(b) presents the XPS survey spectra of APTES, graphene solution, and APTES-functionalized graphene.
The APTES survey spectrum shows characteristic peaks of Si 2p (102 eV), Si 2s (153 eV), C 1s (285 eV) N 1s (400 eV), and O 1s (532 eV), whereas in the case of APTES-functionalized graphene, the O 1s peak is shifted to a higher binding energy (533 eV) due to the interaction of the –OH groups of APTES with the carbon atoms of the graphene sheet. The signal of the N 1s peak is not significant in APTES-functionalized graphene due to the small amount of silane used during the synthesis procedure. There could be two possible mechanisms involved in the functionalization of graphene using hydrolyzed APTES. The authors believe that the protonated amino groups of hydrolyzed APTES attack the edge carbon atoms of graphene to form a C–N bond, as mentioned earlier.20 However, as the concentration of APTES is very low, it is difficult to detect the presence of this band via FTIR or XPS analysis. Alternatively, the –OH group of hydrolyzed APTES could attack the basal plane carbon atoms of graphene to form a C–O–Si covalent bond. Either way, functionalization of graphene takes place, which ensures effective dispersion and distribution of graphene flakes.
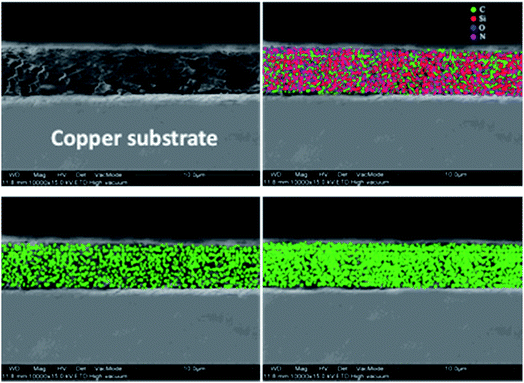
The cross-section image of the graphene-coated samples was used to measure the film thickness, as revealed in Fig. 5(a). The measured coating thickness was around 2–5 μm. To evaluate the extent of dispersion of graphene, carbon mapping was conducted across the coating area. Fig. 5(b–d) show the carbon elemental mapping in graphene-based coating.
It may be noted that the carbon depicted in the images arises from graphene as well as the carbon atoms in the alkyl groups of APTES. Although the coated samples (2 wt% and 4 wt% graphene) contain the same amount of APTES, carbon density in the case of 4 wt% graphene-loaded sample indicates the density and uniform dispersion of graphene throughout the coating matrix and is attributed to the effective functionalization of graphene.
Electrochemical corrosion (ASTM G59)
The potentiodynamic polarization curves for the uncoated and coated Cu in 3.5 wt% NaCl are shown in Fig. 6.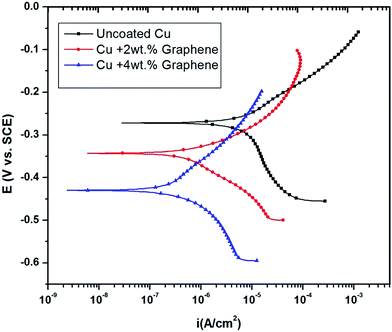 | ||
| Fig. 6 Potentiodynamic polarization curves of Cu in 3.5 wt% NaCl after graphene coating showing lower corrosion current densities. | ||
The curves shift to more negative potentials (Ecorr) as the amount of the graphene loading is increased. The electrochemical kinetic parameters obtained from the polarization curves are summarized in Table 1.
| Sample | E corr (mV vs. SCE) | i corr (μA cm−2) | â a (mV per decade) | â c (mV per decade) | Corrosion rate (mpy) |
|---|---|---|---|---|---|
| Uncoated Cu (bare) | −270 | 6.5 | 80 | 130 | 0.076 |
| Cu + 2 wt% graphene | −340 | 1.4 | 90 | 100 | 0.016 |
| Cu + 4 wt% graphene | −430 | 0.34 | 95 | 110 | 0.003 |
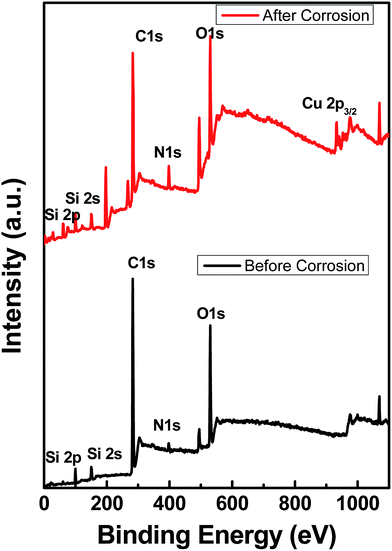
Fig. 7 shows the XPS data obtained before and after the corrosion tests, indicating that the functional group is stable. The spectra show some traces of copper on the surface, indicating corrosion, as shown by EIS and polarization data. As noted from the polarization plots, the coated samples show decreased cathodic kinetics. The anodic kinetics in all these cases, however, seem to remain the same; this indicates that the present coating is not truly a barrier coating for anodic dissolution of the metal, which is in disagreement with the earlier study of Singh et al.15 However, it must be mentioned that the present coating system is much different from that used by other authors; thus, a direct comparison in terms of the role of graphene may not be possible. The corrosion current has decreased in the following order: uncoated Cu > Cu + 2 wt% GR > Cu + 4 wt% GR, indicating that the graphene coating has significantly brought down the corrosion current densities from 6.5 μA cm−2 to 0.34 μA cm−2, which is ∼20 times in magnitude. In the current study, as a consequence of the pH of the solution being 6.5 (3.5 wt% NaCl), the expected cathodic reaction is the oxygen reduction reaction (ORR) as mentioned below.14
| O2 (g) + 2H2O + 4e− → 4OH− | (1) |
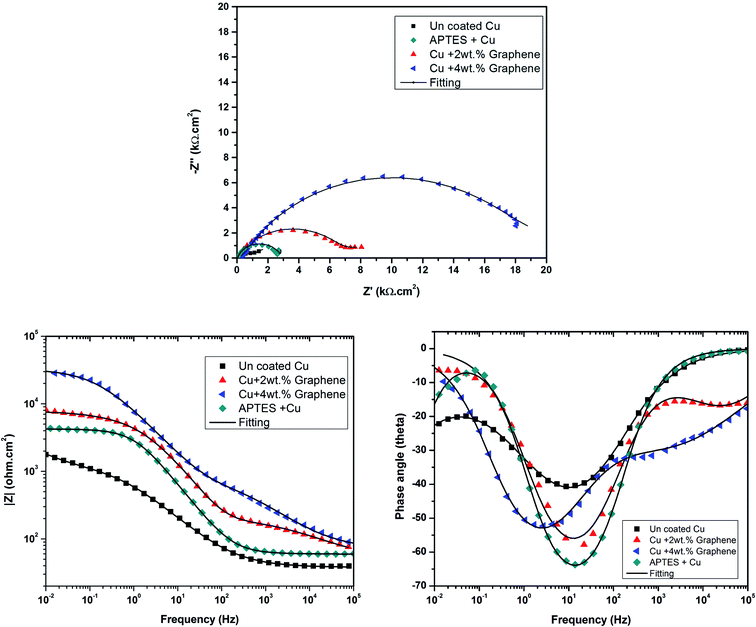
The cathodic kinetics is stifled because of a barrier created by graphene against the diffusion of oxygen towards the surface of the metal. This behavior is attributed to the inherent nature of graphene of being impermeable to gases and other species,12 and the trend of enhanced barrier protection is followed even for a higher weight percent of graphene loaded in the coating. To analyze the electrochemical properties of the coating systems in detail, EIS studies were carried out at OCP in a freely aerated 3.5 wt% NaCl. Fig. 8 shows the Nyquist, Bode magnitude, and phase angle plots and the equivalent circuits for the coated and uncoated specimens.
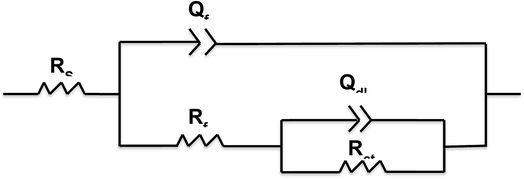
All Nyquist plots were characterized by two capacitive loops. The high frequency loop corresponds to the contributions of the surface film to the system impedance, whereas the low frequency loop corresponds to the contributions of the metal.24 The Nyquist plot for the Cu sample with a 4 wt% graphene coating shows a larger high frequency loop than the other two conditions. On the other hand, the low frequency loop for the uncoated Cu and the 2 wt% graphene + Cu is distinctly visible, and Cu with 4 wt% graphene does not possess a well-developed loop. This can happen if the time constants for the low and high frequency processes become closer to each other. Therefore, a two time constant equivalent circuit was used to simulate the EIS data for all the coated systems, as mentioned in Fig. 9.
The equivalent circuit consists of solution resistance (Rs), film resistance (Rf), charge transfer resistance (Rct), and constant phase elements (Qf) and (Qdl) corresponding to the film and double layer capacitance, respectively. The fitting was achieved with the least chi-squared value, and the data obtained is summarized in Table 2. Considering the presence of heterogeneities in the coatings, the constant phase elements Qf and Qdl were used for the electrochemical interface. The true capacitance values were calculated from the CPE values and are reported in the Table 2.
| Specimen | R sol (Ω cm2) | R f (Ω cm2) | Q f (μF cm−2) | n 1 | R ct (Ω cm2) | Q dl (μF cm−2) | n 2 | R t = Rf + Rct (Ω cm2) |
|---|---|---|---|---|---|---|---|---|
| Uncoated Cu | 60 | 1778 | 237 | 0.7 | 4954 | 2644 | 0.6 | 6732 |
| APTES + Cu | 62 | 2931 | 95 | 0.8 | 6824 | 570 | 0.9 | 9755 |
| Cu + 2 wt% GR | 75 | 794 | 24 | 0.6 | 12![[thin space (1/6-em)]](https://www.rsc.org/images/entities/char_2009.gif) 075 075 |
15 | 0.8 | 12![[thin space (1/6-em)]](https://www.rsc.org/images/entities/char_2009.gif) 869 869 |
| Cu + 4 wt% GR | 72 | 258 | 18 | 0.6 | 32![[thin space (1/6-em)]](https://www.rsc.org/images/entities/char_2009.gif) 387 387 |
7 | 0.8 | 32![[thin space (1/6-em)]](https://www.rsc.org/images/entities/char_2009.gif) 645 645 |
The corrosion resistance of these coatings depends on the sum (Rtotal) of the film (Rf) and the charge transfer resistance (Rct),24 as given in Table 2. It is quite evident from the table that the graphene-coated samples exhibit a higher corrosion resistance. However, between the two graphene-coated samples, the Cu + 4 wt% GR sample has distinctly higher corrosion resistance than the Cu + 2 wt% GR sample. However, the film resistance (Rf) and the pseudo film capacitance (Qf) show a decreasing trend. The deceasing trend in film resistance (Rf) is believed to be related to the improved electrical conductivity of the coating as graphene possess excellent conductivity.9,25,27 The decreased pseudo-film capacitance (Qf) after graphene coating indicates that the graphene-coated samples may be hydrophobic in nature or higher graphene concentration may reduce the porosity of the film.13 This impermeability and hydrophobic nature not only avoid the water uptake26 but also retard the oxygen diffusion and improve the corrosion resistance substantially. Therefore, the Rct value of the graphene-coated samples shows a significant increase, adding to the corrosion resistance of the copper substrate. These results are in agreement with the polarization data, such that the graphene-coated samples show a significantly lowered cathodic kinetics and not the anodic kinetics. In addition, the decreased trend in the pseudo-film capacitance (Qf) is directly proportional to the amount of graphene loaded in the coating; this indicates that a dense network is required for better resistance to water uptake and subsequent corrosion resistance. The EIS and polarization data shown in this study have proved the fact that it is possible to develop graphene-based anti-corrosive coatings for copper through a cost effective, industrially scalable method by incorporating different weight ratios of graphene. Further, systematic electrochemical tests are required for better understanding the mechanism of corrosion protection for anti-corrosive coatings based on graphene.
Conclusions
The study has led to the following conclusions:1. Methods to produce low-cost industrially scalable graphene-based anti-corrosive coatings for copper in 3.5 wt% NaCl have been proposed.
2. Potentiodynamic polarization and EIS data indicate lower corrosion current densities for graphene-coated samples. Among the two graphene-coated samples, the Cu + 4 wt% graphene sample reduces the corrosion currents by 20 times of the magnitude of the bare uncoated copper.
3. The graphene coating significantly reduces the cathodic kinetics, and the enhanced performance of the graphene-coated sample is attributed to its inherent impermeable nature and its subsequent resistance to water uptake.
4. The extent of corrosion protection depends on the amount of functionalised graphene loaded and its dispersion in the coating with high crosslinking ability.
Conflicts of interest
There are no conflicts to declare.Acknowledgements
The authors would like to thank Talga Resources Ltd & Mr Mark Thompson (CEO) for providing High purity Electrochemical process expanded Micro graphite, GNP & Few Layer Graphene for IIT Bombay research. Ajay Krishnan is thankful to Ms Shyama Ranade (Deakin University) for the timely help and useful discussions.References
- G. Grundmeier, W. Schmidt and M. Stratmann, Corrosion Protection by Organic Coatings: Electrochemical Mechanism and Novel Methods of Investigation, Electrochim. Acta, 2000, 45, 2515–2533 CrossRef CAS.
- V. Shinde, S. R. Sainkar and P. P. Patil, Corrosion Protective Poly (O-Toluidine) Coatings on Copper, Corros. Sci., 2005, 47, 1352–1369 CrossRef CAS.
- A. C. Cascalheira, S. Aeiyach, P. C. Lacaze and L. M. Abrantes, Electrochemical Synthesis and Redox Behaviour of Polypyrrole Coatings on Copper in Salicylate Aqueous Solution, Electrochim. Acta, 2003, 48, 2523–2529 CrossRef CAS.
- A. Lai, K. Tan and A. M. Soutar, Hybrid Sol–Gel Coatings for Corrosion Protection of Copper, Thin Solid Films, 2008, 516, 5706–5709 CrossRef.
- W. Boysen, A. Frattini, N. Pellegri and O. Sanctis, De. Protective Coatings on Copper Prepared by Sol–Gel for Industrial Applications, Surf. Coat. Technol., 2000, 122(1999), 14–17 Search PubMed.
- M. Schriver, W. Regan, W. J. Gannett, A. M. Zaniewski, M. F. Crommie and A. Zettl, Graphene as a Long-Term Metal Oxidation Barrier: Worse than Nothing, ACS Nano, 2013, 7(7), 5763–5768 CrossRef CAS.
- L. Lapeire, Influence of Grain Size on the Electrochemical Behavior of Pure Copper, J. Mater. Sci., 2016, 52(3), 1501–1510 CrossRef.
- J.-H. Huh, S. H. Kim, J. H. Chu, S. Y. Kim, J. H. Kim and S.-Y. Kwon, Enhancement of Seawater Corrosion Resistance in Copper Using Acetone-Derived Graphene Coating, Nanoscale, 2014, 6, 4379–4386 RSC.
- K. S. Novoselov, et al., Electric field effect in atomically thin carbon films, Science, 2004, 306, 666–669 CrossRef CAS.
- F. Bonaccorso, L. Colombo, G. Yu, M. Stoller, V. Tozzini, A. C. Ferrari, R. S. Ruoff and V. Pellegrini, Energy Conversion and Storage, Science, 2015, 347, 6217 CrossRef.
- E. Stolyarova, D. Stolyarov, K. Bolotin, S. Ryu, L. Liu, K. T. Rim, M. Klima, M. Hybertsen, I. Pogorelsky, I. Pavlishin, K. Kusche, J. Hone, P. Kim, H. L. Stormer, O. V. Yakimenko and G. Flynn, Observation of Graphene Bubbles and Effective Mass Transport under Graphene Films 2009, Nano Lett., 2009, 9, 332–337 CrossRef CAS.
- J. S. Bunch, S. S. Verbridge, J. S. Alden, A. M. Zande Van Der, J. M. Parpia, H. G. Craighead and P. L. Mceuen, Impermeable Atomic Membranes from 2008, Nano Lett., 2008, 8, 3–7 CrossRef PubMed.
- S. Bohm, Graphene against Corrosion, Nat. Publ. Gr., 2014, 9(10), 741–742 CAS.
- N. T. Kirkland, T. Schiller, N. Medhekar and N. Birbilis, Exploring Graphene as a Corrosion Protection Barrier, Corros. Sci., 2012, 56, 1–4 CrossRef CAS.
- R. K. Singh Raman, P. Chakraborty Banerjee, D. E. Lobo, H. Gullapalli, M. Sumandasa, A. Kumar, L. Choudhary, R. Tkacz, P. M. Ajayan and M. Majumder, Protecting Copper from Electrochemical Degradation by Graphene Coating, Carbon, 2012, 50(11), 4040–4045 CrossRef CAS.
- D. Prasai, J. C. Tuberquia, R. R. Harl, G. K. Jennings and K. I. Bolotin, Graphene: Corrosion-Inhibiting Coating, ACS Nano, 2012, 6(2), 1102–1108 CrossRef CAS.
- M. Topsakal, H. Aahin and S. Ciraci, Graphene Coatings: An Efficient Protection from Oxidation, Phys. Rev. B: Condens. Matter Mater. Phys., 2012, 85, 1–7 Search PubMed.
- K. R. Paton, Exfoliation in Liquids, Nat. Mater., 2014, 13, 624–630 CrossRef CAS.
- Y. Hernandez, V. Nicolosi, M. Lotya, F. M. Blighe, Z. Sun, S. De, I. T. Mcgovern, B. Holland, M. Byrne, Y. K. G. U. N. Ko, J. J. Boland, P. Niraj, G. Duesberg, S. Krishnamurthy, R. Goodhue, J. Hutchison, V. Scardaci, A. C. Ferrari and J. N. Coleman, High-Yield Production of Graphene by Liquid-Phase Exfoliation of Graphite, Nat. Publ. Gr., 2008, 3, 563–568 CAS.
- K. S. Aneja, S. Bohm, A. S. Khanna and H. L. M. Bohm, Graphene Based Anticorrosive Coatings for Cr(VI), Nanoscale, 2015, 7, 17879–17888 RSC.
- A. C. Ferrari, J. C. Meyer, V. Scardaci, C. Casiraghi, M. Lazzeri, F. Mauri, S. Piscanec, D. Jiang, K. S. Novoselov, S. Roth and A. K. Geim, Raman Spectrum of Graphene and Graphene Layers, Phys. Rev. B: Condens. Matter Mater. Phys., 2006, 187401, 1–4 Search PubMed.
- A. C. Ferrari, M. Katsnelson, L. Vandersypen, A. Loiseau, V. Morandi, A. Tredicucci, G. M. Williams and H. Hong, Science and Technology Roadmap for Graphene, Related Two-Dimensional Crystals, and Hybrid Systems, Nanoscale, 2015, 7(11), 4598–4810 RSC.
- X. Wang, W. Xing, P. Zhang, L. Song, H. Yang and Y. Hu, Covalent Functionalization of Graphene with Organosilane and its use as a Reinforcement in Epoxy Composites, Compos. Sci. Technol., 2012, 72(6), 737–743 CrossRef CAS.
- R. Jindal, V. S. Raja, M. A. Gibson, M. J. Styles, T. J. Bastow and C. R. Hutchinson, Effect of Annealing below the Crystallization Temperature on the Corrosion Behavior of Al–Ni–Y Metallic Glasses, Corros. Sci., 2014, 84, 54–65 CrossRef CAS.
- D. Sarkar; M. Krall; K. Banerjee, Electron–Hole Duality during Band-to-Band Tunneling Process in Graphene-Nanoribbon Tunnel-Field-Effect-Transistors. 2016, 263109 (2010), 1–4 CAS.
- K. S. Aneja, H. L. M. Böhm, A. S. Khanna and S. Böhm, FlatChem Functionalised Graphene as a Barrier against Corrosion, FlatChem, 2016, 1, 11–19 CrossRef.
- S. Nemala, P. Kartikay, S. Prathapani, H. L. M. Bohm, P. Bhargava and S. Bohm, Liquid phase high shear exfoliated graphene nanoplatelets as counter electrode material for dye-sensitized solar cells, J. Colloid Interface Sci., 2017, 499, 9–16 CrossRef CAS.
| This journal is © The Royal Society of Chemistry 2018 |

