 Open Access Article
Biochar production and applications in soil fertility and carbon sequestration – a sustainable solution to crop-residue burning in India†
Dinesh Mohan *a,
Kumar Abhisheka,
Ankur Sarswata,
Manvendra Patel
 a,
Prachi Singha and
Charles U. Pittman Jrb
aSchool of Environmental Sciences, Jawaharlal Nehru University, New Delhi 110067, India. E-mail: dm_1967@hotmail.com; Fax: +91-11-26704616; Tel: +91-11-26704616
bDepartment of Chemistry, Mississippi State University, Mississippi State MS 39762, USA
First published on 3rd January 2018
Abstract
A sustainable solution to biomass burning by converting agricultural residues into biochar was provided. Biochar application was investigated to improve soil fertility, sequester carbon, and increase crop production. Rice husk (RHBC) and corn stover (CSBC) biochars were obtained by slow pyrolysis at 650° and 550 °C, respectively. RHBC and CSBC were characterized (SEM, SEM-EDX, TEM, FTIR, XRD, elemental analyses, and SBET). Unpyrolyzed husks and stover were also used for soil amendments and compared to biochars in different proportions under a controlled incubation environment over 107 days. Fertilizers were not applied. An increase in water holding capacity, total organic carbon, cation exchange capacity, and a decrease in soil CO2 emission were observed after biochar application to soil versus the application of the parent husks or stover. These biochars improved soil fertility and enhanced eggplant crop growth (height, leaf number, fresh and dry weight). In addition, carbon mitigation was achieved because the biochar remained stable in the soil achieving longer term carbon sequestration. Both chars can be used for carbon sequestration and soil amendments.
1 Introduction
Rising concentration of the greenhouse gas (GHG), carbon dioxide, in the atmosphere is a major anthropogenic cause of climate change.1,2 The preindustrial atmospheric CO2 concentration of 255 to 280 ppm![[thin space (1/6-em)]](https://www.rsc.org/images/entities/char_2009.gif) 1 has increased to ∼400 ppm.3,4 The CO2 concentration could reach 700 ppm or more in the twenty-first century.1
1 has increased to ∼400 ppm.3,4 The CO2 concentration could reach 700 ppm or more in the twenty-first century.1
Every year worldwide anthropogenic CO2 emissions from energy generation increase. By 2020, 33.8 billion metric tons per year could be emitted, up from 29.7 billion metric tons per year in 2007.5 Added to anthropogenic CO2 emissions are those from fires, the natural carbon cycle, and deforestation. World agriculture accounted for an estimated emission of 5.1–6.1 × 10⁹ metric tons (5.1–6.1 Pg) CO2 equivalents year −1, contributing 10–12% to the total global anthropogenic GHG emissions in 2005.6,7 The changing climate impacts society and ecosystems in many harmful ways.8
Research to mitigate CO2 emissions, reduce the CO2 atmospheric concentration, and enhance soil fertility, crop production and bio-derived energy production would be welcome.9 Efforts to reduce CO2 emissions through carbon sequestration include both reforestation10 and CO2 injection into underground saline and other geological formations or into the deep ocean.11,12 Sequestering C in soils as biochar can improve soil fertility, supplementing adding biosolids, organic waste fertilizers and improving crop rotation.13,14 However, organic wastes and biosolids will decompose in the soil emitting CO2. Conversely, the carbon in biochars, originally removed from the atmosphere as CO2 during plant growth, persist in soils from decades to millennia.15,16 Thus, if biochar application proves widely applicable at low cost in improving soil fertility in agriculture, its widespread use could lead to enhanced carbon sequestration. Biochar can be made either as a byproduct of fast pyrolysis to generate biooil17(a liquid fuel precursor) or slow pyrolysis.17–25 Biochar production technologies26 and CO2 capture, storage, and utilization have been reviewed.27–29 A strategy that combines biomass for energy production with application of byproduct biochar to soils more effectively mitigates CO2 then solely producing bioenergy.30
Application of biochar to soil is not new. For example, the Amazon basin (terra preta) contains huge amounts sequestered carbon as charred material.31 Biochar effects on soil depend on feedstock type, heating temperature, and residence time.32–34 Biochar can enhance plant growth, retain nutrients, provide habitat for microorganisms,15,16,33,35 improve soil water holding capacity,36–38 soil water availability,39 and hydraulic conductivity.40 Biochars can reduce net GHG emissions from agricultural soil,41,42 through mechanisms that are still not clear.32,34,43 A 50% reduction in nitrous oxide (N2O) and 100% reduction in methane (CH4) emissions from soybean plots were achieved by adding biochar (20g kg−1) to acidic soil in the Eastern Colombian Plains.41 An 85% N2O emission reduction from rewetted soil with 10% biochar was reported.42
Amending rice paddy soil with biochar reduced CO2 and increased CH4 emissions,44 but CO2 emissions are not always lowered by biochar. Both increases and decreases in CO2 emissions were reported in soils amended with 16 different types of biochars.45 CO2 emission from Swiss loam soil was unchanged after adding pine wood biochar but increased with grass-derived biochar amendment.46 Agronomic benefits arising from biochar additions to the degraded soils have been emphasized, but negligible and negative agronomic effects have also been reported.47 Biochar use for organic composting wastes and remediation of soil contaminated with heavy metals and organics has been reviewed48 together with the advantages of combining biochar and compost for soil remediation and plant growth.
Crop residues represent a large amount of biomass. They are frequently left on fields after harvests as cover and then decompose, releasing CO2 back to atmosphere or used other ways or are simply burned. According to the Indian Ministry of New and Renewable Energy, biomass current availability is estimated at ∼500 million metric tons per year in India alone.49 Residues are used as animal feed, home thatching, and for domestic and industrial fuel. Tragically, a large portion of unused crop residues are burned in the fields to clear the left-over straw and stubble after harvest, causing serious air pollution and producing CO2 contributing to global warming. It also causes a huge loss of carbon feedstock which can be used to improve soil fertility. One ton of biomass/stubble burning releases 2 kg of SO2, 3 kg of PM, 60 kg of CO, 1460 kg of CO2, and 199 kg of ash.50 Burning of crop stubble adversely impacts those people suffering from respiratory and cardiovascular diseases. An example of the terrible consequences of crop residue burning was the unprecedented air pollution experienced in New Delhi from Nov. 06 to Nov. 10, 2017. Furthermore, long term burning also reduces total nitrogen and carbon in the 0–15 cm soil layer along with a loss in soil organic matter.50 A sustainable alternative to this biomass burning is the conversion of agricultural residues into biochar. This biochar can then be used simultaneously to enhance soil fertility, carbon sequestration and crop growth.
A laboratory incubation study of biochar effects on CO2 soil emission is reported here. Its objectives were (a) to characterize rice husks, corn stover, and their biochars (RHBC and CSBC, respectively) as soil amendments, (b) to determine the biochar physical and chemical properties, and (c) to compare the CO2 emissions after addition of these amendments to soil. Additionally, the effects of biochar and biomass on eggplant (Solanum melongena) growth and soil quality were reported without the application of fertilizers.
2 Experimental section
2.1 Biochar production
Corn stover and rice husk agricultural wastes were collected from in and around Delhi [rice husk: Duhai village, Ghaziabad, Uttar Pradesh, 28°43.995′(N) and 77°28.603′(E); corn stover: Chandni Chowk, Delhi, 28°39.44′(N) and 77°13.19′(E)]. These were pyrolyzed under N2 in a programmable temperature muffle furnace (Thermo Scientific, Model: F6000) equipped with programmable dwell time control. Rice husks and corn stover were air-dried and cut into 5–25 mm sizes. Rice husks were pyrolyzed to form RHBC at 550 °C while corn stover was pyrolyzed into CSBC at 650 °C at 10 °C min−1 for both, followed by 30 min residence times at the pyrolysis temperature. Yields were 33.2% for RHBC and 29.7% for CSBC. The yields and properties depend on the biomass feed, pyrolysis temperature, residence time and heating rate. Yields decreased with a rise in temperature. Biochars were ground to pass through a 2 mm sieve before use.2.2 Equipment and reagents
All chemicals were either analytical (AR) or general (GR) grade reagents. Ammonium acetate and sodium hydroxide were purchased from Merck, India. The pH and electrical conductivity (EC) were determined using a multi-parameter ion meter (Thermo Orion 5 star). Na+ and K+ analyses employed a flame photometer (CL-378, Elico, India). Ca2+ and Mg2+ were determined using AAS (Thermo Fisher Scientific M6 Mk2 Dual). Soil–biochar samples were blended using a rotospinner. C, N, and H analyses were determined with a EUROM EA3000 elemental analyzer. Moisture content, volatile matter and ash content were determined according to D1762-84.51 Feedstock, biochar and soil moisture contents were estimated by oven drying (2 h at 1 atm) at 105 °C. Volatiles were determined by weight loss upon heating to 950 °C for 11 min. Ash content was estimated by weight loss on heating at 750 °C for 2 h.52FTIR spectra (KBr pellets) from 4000 to 400 cm−1 employed 8 scans at 4 cm−1 resolution (Perkin-Elmer model Varian 7000). Biochar powder X-ray diffraction patterns were recorded on a (PANalytical model X'Pert PRO) XRD system using Cu Kα (k = 1.54 Å) radiation at 45 kV. The samples were scanned from 5° to 90° at 2° min−1. Biochar morphology was examined by scanning electron microscopy (SEM) (Zeiss, Evo 40) at a 20![[thin space (1/6-em)]](https://www.rsc.org/images/entities/char_2009.gif) 000 V accelerating voltage and working distance: 10
000 V accelerating voltage and working distance: 10![[thin space (1/6-em)]](https://www.rsc.org/images/entities/char_2009.gif) 000–10
000–10![[thin space (1/6-em)]](https://www.rsc.org/images/entities/char_2009.gif) 500 μm. Samples were coated with a thin gold layer, and mounted on a copper stab using a double stick carbon tape. Elemental compositions were determined by SEM/EDX analyses.
500 μm. Samples were coated with a thin gold layer, and mounted on a copper stab using a double stick carbon tape. Elemental compositions were determined by SEM/EDX analyses.
X-ray EDX analyses were carried out on sintered pellets using the Zeiss, EVO 40 SEM employing a Bruker EDX system and an energy dispersive X-ray fluorescence spectrometer (PANalytical Epilson 5) to determine surface region elemental compositions. RHBC and CSBC pellets with boric acid were compressed using an Insmart System (INSMART XRF 40) at 5 tons/8 mm2.
CSBC and RHBC were examined by TEM at a 200 keV using a model JEOL 2100F (Japan). Biochars were dispersed in warm Millipore water by ultrasonic mixing (20 min). Samples were deposited onto a carbon-coated grid.
CSBC and RHBC surface areas (BET) were determined using a Micromeritics ASAP 2020 surface area analyzer on 0.15 g samples out-gassed at 250 °C for 12 h at <10−3 Torr.
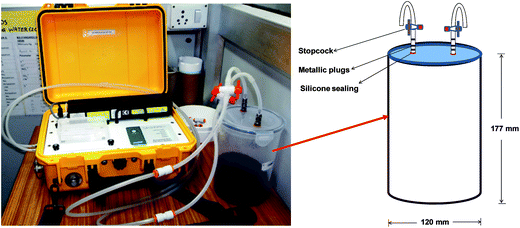
Carbon dioxide fluxes were measured by an automated soil CO2 infrared gas analyzer (non-dispersive) (LI-COR Biosciences LI-8100A). An airtight container (Fig. 1), was designed to conduct the incubation experiments. The CO2 fluxes were followed on a per second basis continuously for 2 min using wireless communication.
2.3 Experimental design for CO2 flux measurements
The CO2 chamber was used for CO2 flux measurements. An air tight circular polypropylene box [diameter: 120 mm; length: 177 mm] was purchased. Two metallic plugs were inserted in small holes made in the cap and sealed using silicone sealant. The inlet and outlet metallic plugs were connected to the soil–CO2 flux analyzer by silicone tubing (diameter: 4 mm) and LI-COR connectors (Fig. 1). Air flow was controlled using stop cocks placed between metallic plug and LI-COR connectors.2.4 Soil treatments and incubation study
Preliminary experiments used garden top soil (0–30 cm) collected from School of Environmental Sciences (28°32.347′ N, 77°10.049′ E), Jawaharlal Nehru University. Texture, water holding capacity, bulk density, soil organic matter fractions and total and available nutrients were all determined following standard methods elaborated in GOI, 2011.53,54In 1000 ml air tight containers, 500 g (dry weight) of soil (oven dried at 105 °C for 2 h) was amended with biochars, rice husks or corn stover at different doses (0.5, 1.5 and 3.0% wt/wt). Soil without added amendment was designated as the control (Experimental design shown in Table SM1†). Prior to incubation, the soil was sieved through a 2 mm mesh size. Distilled water was added to achieve about 50% moisture content. The soil was then incubated at 25 ± 1 °C and 65 ± 5% relative humidity in the dark for 7 d to establish the microbial activity55 and placed in plastic boxes (12.0 cm wide and 17.7 cm deep) to a soil depth of 8 cm. After 7 d of pre-incubation, the soils were amended with rice husks, corn stover or the biochars at 0.5%, 1.5% and 3.0% [weight/weight (wt/wt)] respectively. Subsequently, moisture content in all the samples was kept to 50%. The incubation lasted for 107 d. The following soil amendments were applied:
1. Soil was mixed with either 0.5%, 1.5% or 3.0% (wt/wt) biochar (RHBC or CSBC).
2. Soil was mixed with either 0.5%, 1.5% or 3.0% (wt/wt) of rice husks or corn stover.
The control (un-amended) soil, biochar-amended soils, and biomass-amended soils were placed into an indigenously designed CO2 chamber (Fig. 1). Incubation was carried out for 107 days at 25 ± 1 °C and 65 ± 5% relative humidity to compare the biochar's effect on physical and chemical properties of soil conditioned with biochar or biomass. Soil, biochar-amended soil, and biomass-amended soil samples were incubated in the dark in an environmental chamber (Macro Scientific Works Pvt. Ltd.) at a temperature of 25 ± 1 °C and 65 ± 5% relative humidity for 107 days. The period was selected based on an earlier study.56 The CO2 emissions from control soil, biomass-amended soils and biochar-amended soils were measured. The physical chemical properties of all samples, before and after incubation, were also determined. The CO2 flux was then measured for 300 s using 2 mm diameter PVC collars [Fig. 1]. CO2 flux was measured on days 1, 2, 3, 4, 5, 6, 7, 8, 10, 12, 15, 19, 24, 31, 41, 51, 58, 65, 71, 86, 93, 100, and 107.
2.5 Physico-chemical properties
Bulk densities and water holding capacities of all soil samples were determined by the Keen's box method.57 The pH values of water solutions containing biochar were measured at 1![[thin space (1/6-em)]](https://www.rsc.org/images/entities/char_2009.gif) :
:![[thin space (1/6-em)]](https://www.rsc.org/images/entities/char_2009.gif) 20 (w/v) after stirring for over 1 h. The electrical conductivity (EC) of biochar/water suspensions (1
20 (w/v) after stirring for over 1 h. The electrical conductivity (EC) of biochar/water suspensions (1![[thin space (1/6-em)]](https://www.rsc.org/images/entities/char_2009.gif) :
:![[thin space (1/6-em)]](https://www.rsc.org/images/entities/char_2009.gif) 10 wt/wt) was measured at 25 °C. The cation exchange capacities and exchangeable cations (Na+ and K+, Ca2+ and Mg2+) of the control and biochar-amended soil samples were determined by the ammonium acetate (pH 7) method.58,59 Soil organic carbon and organic matter were determined by the weight loss on ignition.58
10 wt/wt) was measured at 25 °C. The cation exchange capacities and exchangeable cations (Na+ and K+, Ca2+ and Mg2+) of the control and biochar-amended soil samples were determined by the ammonium acetate (pH 7) method.58,59 Soil organic carbon and organic matter were determined by the weight loss on ignition.58
2.6 Pot trials
Soil samples (500 g) were placed in plastic pots (∼10.2 cm wide and 13.6 cm deep) and then mixed thoroughly with 0, 0.5, 1.5 and 3.0% wt/wt of RHBC and CSBC, respectively. Eggplant (Solanum melongena) seeds were planted to determine the effects of CSBC and RHBC growth, number of leaves, total fresh weight and total dry weight. Triplicates of each sample were prepared (24 total samples). All pots were irrigated with water (60–70% of water holding capacity) every day to maintain the soil moisture (70–80%). The experiment was conducted for 7 weeks, during which the plant heights and number of leaves were measured weekly. Immediately after 7 weeks, whole plants were harvested. Their total fresh weights were measured immediately and total dry weights were measured after oven drying at 50 °C for 2 days.60 Plant heights were measured from the collar line to the longest leaf tip.612.7 Statistical analysis
Statistical analysis of the data was performed on the MS Excel (Windows 2007). The mean values of the replications were reported.3 Results and discussion
3.1 Biochar characterization
A 29.7 wt% yield of corn stover biochar (CSBC) and 33.2 wt% of rice husk biochar (RHBC) were obtained upon slow pyrolysis based on the weight of the original biomass. Elemental and proximate analysis of biomass feedstocks, biochars and un-amended soil are given in Table 1. The water holding capacity was 1.5, 22.1 and 14.4 (wt%) for soil, CSBC and, RHBC respectively. The sand, silt and clay contents in the soil were 24, 70 and 6%, respectively. The CSBC had a higher carbon and hydrogen content then RHBC [C (77.50 vs. 74.37%) and H (2.21 versus 1.78%)]. Biochar properties depend on the pyrolysis conditions (temperature, residence time, and reactor type) and feedstock. CSBC and RHBC were prepared at 650 °C, and 550 °C, respectively, contributing to the higher carbon content in CSBC.62–65 The degree of a char's carbonization is described by the molar H/C ratio.66 The molar H/C ratio was 1.54 and 1.44 for the CSBM and RHBM feeds, whereas this ratio for the corresponding biochars was 0.34 and 0.29, respectively (Table 1). The decrease in H/C ratio in the biochars clearly illustrates the high carbonization of the original lignocellulosic (organic) residue structure.62 The molar O/C ratio is an indicator of biochar's surface hydrophilicity because it reflects polar-group content mostly derived from carbohydrates.62 The O/C ratios of 0.70 and 0.94 for corn stover and rice husks dropped to 0.18 and 0.23 for CSBC and RHBC, respectively (Table 1). The O/C mole ratios suggest RHBC is more hydrophilic then CSBC. High hydrophilicity of RHBC is due to the presence of high silica (∼49%) versus CSBC (3%) [Table SM2†]. The tiny SiO2 particle surfaces have hydrophilic Si–OH groups which contribute to overall RH and RHBC hydrophilic properties.| Sample | Elemental compositiona (wt%) | Proximate analysisa | Biochar yield (%) | Atomic ratio (%) | |||||||
|---|---|---|---|---|---|---|---|---|---|---|---|
| C | H | N | Moisture content (%) | Ash (%) | Volatile matter (%) | Fixed carbon (%) | C/N | H/C | O/C | ||
| a On dry basis.b To maintain uniformity, a number (n = 5) of biochar samples were randomly picked from thoroughly mixed (using Quadrate method) bulk biochar. These samples were then mixed well again using quadrate method at least 10 times. Then a small sample size is picked for analysis. | |||||||||||
| Corn stover feedstock (CSBM) | 44.24 | 5.66 | 8.58 | 5.64 | 1.70 | 81.38 | 11.28 | — | 6.01 | 1.53 | 0.70 |
| Rice husk feedstock (RHBM) | 40.43 | 4.86 | 3.93 | 6.16 | 18.81 | 64.21 | 10.83 | — | 12.0 | 1.44 | 0.94 |
| Corn stover biochar (CSBC) | 77.51 | 2.21 | 1.50 | 1.21 | 4.06 | 18.10 | 76.63 | 29.7 | 64.12 | 0.34 | 0.18 |
| Rice husk biochar (RHBC) | 74.37 | 1.78 | 1.02 | 0.14 | 2.43 | 14.85 | 82.58 | 33.2 | 85.06 | 0.29 | 0.23 |
| Soil | 1.49 | 0.83 | — | 0.53 | — | — | — | — | — | 6.67 | 49.51 |
CSBC and RHBC surface areas (SBET) were 242.7 and 95.2 m2 g−1 (Fig. SM1†), respectively, while the total pore volumes were 0.12 (CSBC) and 0.06 (RHBC) cm3 g−1. The lower RHBC surface area results partially from its lower pyrolysis temperature (550 °C) employed and high ash content. Biochar surface areas typically increase with higher pyrolysis temperature.24,62,67–70
Soil water holding capacities, structures, existing microbial communities, and earth worm populations may be altered by biochar application.71 Water holding capacity increased from 11.2 wt% for the control soil to 21.8 wt% upon addition to soil of 3.0 wt% of RHBC or 29.7 wt% with 3.0 wt% of CSBC. The increase in water holding capacity is greater for CSBC-amended soils than using RSBC at 0.5, 1.5, and 3.0 wt% levels (Table 2).
| Parameters | Biochar amendmentsc | ||||||
|---|---|---|---|---|---|---|---|
| Control soil (0 wt%) | CSBCa (0.5 wt%) | CSBCa (1.5 wt%) | CSBCa (3.0 wt%) | RHBCb (0.5 wt%) | RHBCb (1.5 wt%) | RHBCb (3.0 wt%) | |
| a Corn stover biochar.b Rice husk biochar.c Mean value from three replicate measurements ± standard deviations. | |||||||
| pH | 7.37 ± 0.66 | 7.61 ± 0.49 | 7.72 ± 0.80 | 8.01 ± 0.57 | 7.89 ± 0.21 | 8.14 ± 0.29 | 8.20 ± 0.28 |
| EC (μS cm−1) | 248 ± 2 | 340 ± 3 | 464 ± 2 | 497 ± 3 | 220 ± 2 | 291 ± 2 | 466 ± 2 |
| Organic matter (wt%) | 0.82 ± 0.10 | 1.64 ± 0.33 | 3.63 ± 0.43 | 8.21 ± 0.56 | 1.59 ± 0.46 | 1.95 ± 0.51 | 4.80 ± 0.61 |
| Organic carbon (wt%) | 0.48 ± 0.05 | 0.95 ± 0.11 | 2.10 ± 0.14 | 5.26 ± 0.17 | 0.92 ± 0.21 | 1.13 ± 0.22 | 2.82 ± 0.29 |
| Water holding capacity | 11.2 ± 0.64 | 12.1 ± 0.78 | 19.4 ± 0.81 | 29.7 ± 0.78 | 11.9 ± 0.61 | 16.5 ± 0.67 | 21.8 ± 0.45 |
| Cation exchange capacity (meq./100 g) | 4.2 ± 0.7 | 5.1 ± 0.7 | 5.3 ± 0.9 | 36.0 ± 0.7 | 19.6 ± 0.7 | 23.2 ± 0.7 | 29.9 ± 0.7 |
SEM micrographs of CSBC and RHBC (Fig. 2) illustrate their highly porous structures. Visual inspection illustrates microstructure differences between these chars. Distinct macro pores are observable in both. Ca2+, Mg2+, Na+ and K+ distributions on char surfaces were evident in SEM-EDX spectra (Fig. SM2†). The TEM images and TEM elemental mapping of RHBC and CSBC appear in Fig. 3 and 4, respectively. [Fig. 4(A) and (B)] clearly shows Si4+, K+ and Mg2+ predominate on surface regions RHBC versus K+ and Na+ on CSBC. This might be related to the high (49 wt%) silica ash content in RHBC (Table SM2†). Tiny somewhat spherical primary particles are seen in RHBC at high magnification [Fig. 3].
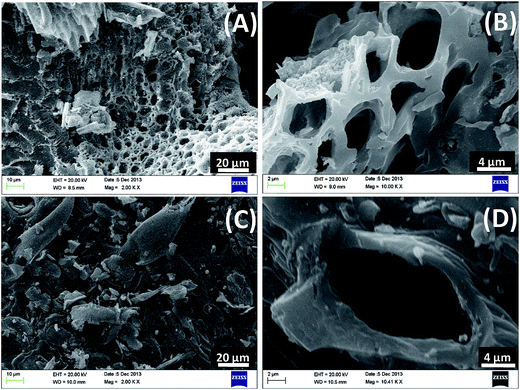 | ||
| Fig. 2 SEM micrographs of rice husk biochar (RHBC) at (A) 2KX (B) 10KX and corn stover biochar (CSBC) at (C) 2KX (D) 10.41KX magnifications. | ||
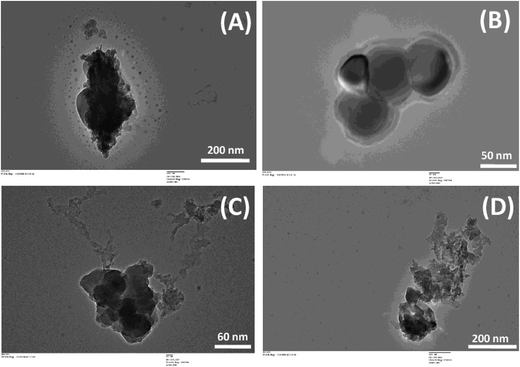 | ||
| Fig. 3 TEM micrographs of corn stover biochar (CSBC) at (A) 20KX (B) 60KX and rice husk biochar (RHBC) at (C) 40KX (D) 250KX magnifications. | ||
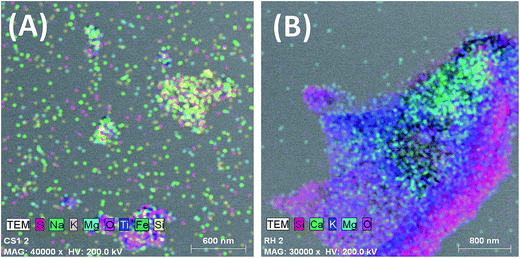 | ||
| Fig. 4 TEM mapping of (A) corn stover biochar (CSBC) and (B) rice husk biochar (RHBC) showing constituent elements. | ||
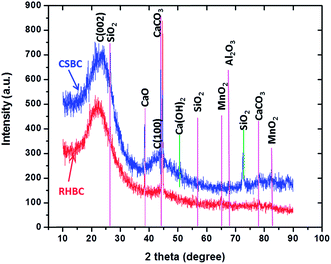
The XRD patterns for RHBC and CSBC are shown in Fig. 5. The broad hump in the region between 18.84°–28.15° in both the biochars is due to the crystal plane index C(002).72,73 This C(002) plane is due to parallel and azimuthal orientation of the aromatic, partially carbonized lamellae. Sharper peaks are indicative of higher degree of orientation. Similarly, another broad hump in the region 42.18°–46.78° in both the biochars is due to crystal plane index of C(100). This C(100) peak is due to condensed aromatic carbonized planes. Thus, peaks depict appearance of a degree of crystalline orientation of C in biochar samples.72,73
Sharp and small peaks respectively at 26.59° and 67.84° in both CSBC and RHBC and 72.60° in CSBC are due to SiO2 (quartz) (JCPDS card no. 46-1045).74 A strong peak at 38.42° in CSBC and RHBC is due to CaO (lime) (JCPDS Card no. 011-1160) while the peak at 50.54° in CSBC is due to Ca(OH)2 (JCPDS card no. 01-073-5492).75 Peaks at 44.67° and 78.69° indicate the presence of CaCO3 (calcite) in both CSBC and RHBC (JCPDS card no. 05-0586).76 Small peaks at 65.14° and 82.64° in CSBC and RHBC show MnO2 (JCPDS Card no. 44-0141),77 and Al2O3 (alumina) (JCPDS Card no. 11-0517),78 are present, respectively.
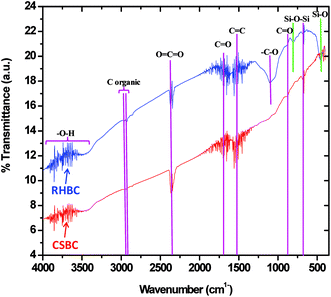
The FTIR spectra of CSBC and RHBC were similar with broad –OH stretching bands from organic or inorganic components found from 4000–3000 cm−1 (Fig. 6). Broad peak in the region from 3923–3367 cm−1 is attributed to –OH group stretching bands from organic and inorganic components rich in hydroxide groups or residual water,79 and possibly some mineral based Si–OH.80 Small peaks at 2853 cm−1 and 2921 cm−1 in both RHBC and CSBC are assigned to C–H symmetric stretching vibration in organic carbon.80,81 Sharp peaks in RHBC and CSBC at 2357 cm−1 are due to CO2. The typical region between 2000–2400 cm−1 corresponds to O![[double bond, length as m-dash]](https://www.rsc.org/images/entities/char_e001.gif) C
C![[double bond, length as m-dash]](https://www.rsc.org/images/entities/char_e001.gif) O, –C
O, –C![[triple bond, length as m-dash]](https://www.rsc.org/images/entities/char_e002.gif) C– and –C
C– and –C![[triple bond, length as m-dash]](https://www.rsc.org/images/entities/char_e002.gif) N triple bond stretching. Hence peaks at 2345 cm−1 in both RHBC and CSBC are tentatively assigned to –C
N triple bond stretching. Hence peaks at 2345 cm−1 in both RHBC and CSBC are tentatively assigned to –C![[triple bond, length as m-dash]](https://www.rsc.org/images/entities/char_e002.gif) C– and the peak at 2369 cm−1 in CSBC to –C
C– and the peak at 2369 cm−1 in CSBC to –C![[triple bond, length as m-dash]](https://www.rsc.org/images/entities/char_e002.gif) N stretching present in the pyrolyzed carbonaceous material.82 Several unsymmetrical peaks in the broad region from 1926–1314 cm−1 with the peak maxima at 1685 cm−1 in RHBC and CSBC include contributions from C
N stretching present in the pyrolyzed carbonaceous material.82 Several unsymmetrical peaks in the broad region from 1926–1314 cm−1 with the peak maxima at 1685 cm−1 in RHBC and CSBC include contributions from C![[double bond, length as m-dash]](https://www.rsc.org/images/entities/char_e001.gif) O stretching of the various functional groups in ketones, carboxylic acids, esters, and anhydrides and complex conjugated C
O stretching of the various functional groups in ketones, carboxylic acids, esters, and anhydrides and complex conjugated C![[double bond, length as m-dash]](https://www.rsc.org/images/entities/char_e001.gif) C systems in the samples.83 The peak at 1550 cm−1 in both RHBC and CSBC is attributed to C
C systems in the samples.83 The peak at 1550 cm−1 in both RHBC and CSBC is attributed to C![[double bond, length as m-dash]](https://www.rsc.org/images/entities/char_e001.gif) C bond stretch in aromatic rings.84 The RHBC peak at 1109 cm−1 is assigned to –C–O.85 The band at 876 cm−1 in both the biochars is due to carbonate –C
C bond stretch in aromatic rings.84 The RHBC peak at 1109 cm−1 is assigned to –C–O.85 The band at 876 cm−1 in both the biochars is due to carbonate –C![[double bond, length as m-dash]](https://www.rsc.org/images/entities/char_e001.gif) O stretching present in calcite.81,86,87 Peaks in the region 792 cm−1 and 464 cm−1 are due to asymmetric bending vibrations of Si–O–Si and symmetric stretching vibrations of Si–O, respectively in RHBC.79 These peaks are however very weak or absent in CSBC in accord with 49% vs. 3% wt of SiO2 in RHBC vs. CSBC. Small peak at 690 cm−1 in both RHBC and CSBC is due to Si–O–Si stretching.79
O stretching present in calcite.81,86,87 Peaks in the region 792 cm−1 and 464 cm−1 are due to asymmetric bending vibrations of Si–O–Si and symmetric stretching vibrations of Si–O, respectively in RHBC.79 These peaks are however very weak or absent in CSBC in accord with 49% vs. 3% wt of SiO2 in RHBC vs. CSBC. Small peak at 690 cm−1 in both RHBC and CSBC is due to Si–O–Si stretching.79
3.2 Change in the soil properties with biochar treatment
3.3 Soil respiration: effect of biochar and biomass addition on soil CO2 release
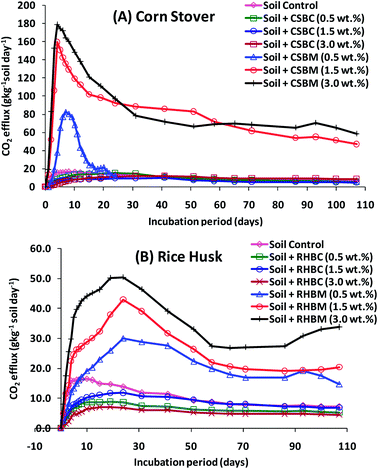
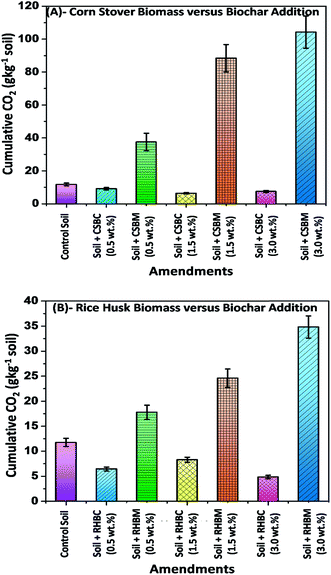
The effect of adding biochar (CSBC and RHBC) versus its precursor biomass (corn stover and rice husks) on soil CO2 emissions during a 107 day incubation period is depicted in Fig. 7. Cumulative CO2 emissions are summarized in Fig. 8. These CO2 emissions are expressed as the g kg−1 of soil per day.Adding corn stover to soil at levels 0.5, 1.5 and 3.0 wt% resulted in higher CO2 emissions (g CO2 kg−1 soil day−1) than those emitted from either of the biochar-amended soils (CSBC and RHBC) or the control soil. The CO2 emissions order was corn stover-amended soil > control soil > corn stover biochar-amended soil. The CO2 efflux (g CO2 kg−1 soil day−1) from both biomass-amended soils increased during the first two weeks of incubation. It reached a maximum rate on the 15th day for corn stover-amended soil versus 24th day with rice husk-amended soil. This efflux occurs as the added biomass decomposes. Higher biomass additions, as expected, led to greater CO2 emissions [Fig. 7(A) and (B)]. For example, the CO2 emissions order was: corn stover 3.0 (wt%) > 1.5 (wt%) > 0.5 (wt%), respectively [Fig. 7(A)]. After incubating for two weeks, the CO2 efflux in all cases decreased with longer incubation times. After 107 days, the cumulative CO2 emission was higher for corn stover-amended soil than for rice husk-amended soil [Fig. 8(A) and (B)]. Both biomass-amended soils gave higher total CO2 emissions than the control. The cumulative total emissions were 37.48, 88.44 and 104.25 (g CO2 kg−1 soil) in soils amended with 0.5, 1.5, and 3.0 wt% by weight of corn stover, respectively, versus only 11.74 g CO2 kg−1 soil for the control [Fig. 8(A)]. Overall, CO2 emissions for corn stover-modified soil were greater than those of soil modified by equivalent weights of rice husks. This was expected given the greater ash content and smaller carbon content of rice husks.
In contrast to biomass addition, biochar addition lowered CO2 emissions (Fig. 7 and 8). CSBC and RHBC addition to soil lowered cumulative CO2 emissions for all of the biochar addition levels versus the control soil. The CO2 efflux increased during the first 24–41 days of incubation for CSBC-amended soil. Similar CO2 emission trends were reported for other biochars.98,99 The cumulative CO2 emissions were highest in the soil amended with 0.5 (wt%) followed by 1.0 (wt%) and 3.0 (wt%) CSBC, respectively [Fig. 8(A)]. After 24–41 days, the CO2 efflux drops with longer incubation times regardless of biochar dose. The cumulative total emissions were 9.12, 6.37, 7.45 (g CO2 kg−1 soil) in soils amended with 0.5, 1.5, and 3.0 wt% of CSBC, respectively, and 11.74 g CO2 kg−1 soil for the control soil. Soil amended with 3.0% of CSBC emitted ∼157% less CO2 over 107 days than to the control soil [Fig. 8(A)].
Similar CO2 efflux trends were obtained with rice husk- or RHBC-amended soils [Fig. 7(B) and 8(B)]. Rice husk addition to soil led to much higher CO2 emissions at all levels versus the control soil. CO2 efflux increased during incubation during the first 10 days for the control soil and 19–24 days for the soils amended with RHBC. This is seen immediately looking at the figures [Fig. 7(B) and 8(B)].
The CO2 efflux from the control soil reached a maximum rate on the 10th day versus 19–24 days for RHBC-amended soils. The CO2 emissions rose as more rice husks were added (3.0 > 1.5 > 0.5 wt%) [Fig. 7(B)]. After CO2 emissions reached their maximum values they all decreased at longer incubation times. After 107 days, the cumulative CO2 emission was higher for rice husk-amended soils versus either the control or RHBC-amended soil. The cumulative total emissions were 17.80, 24.62, and 34.83 g CO2 kg−1 soil for soils amended with 0.5, 1.5 and 3.0 wt% of RHBM [Fig. 8(B)]. CO2 emissions by three RHBC-amended soils remained lower than the control soil for about 30 days. Soil amended with 3.0% RHBC emitted ∼716% and ∼241% less CO2 over 107 days versus the RHBM-amended and control soils, respectively [Fig. 8(B)]. Cumulative CO2 releases of 6.46, 8.32, and 4.86 (g CO2 kg−1 soil) were measured for 0.5, 1.5, and 3.0 wt% of RHBC additions, respectively [Fig. 8(B)].
Biochar doesn't “rot” or oxidatively decay rapidly, remaining in the soil for very long periods. The more highly carbonized it is, the slower it will oxidized (e.g. at the extreme, graphite and diamond are rather inert in the soil). Slow pyrolysis biochar is recalcitrant in soils.100 High biochar doses gave initial negative CO2 fluxes. This is likely caused by CO2 carbonation of soluble Ca2+ and Mg2+ in the biochar to CaCO3 and MgCO3.101,102 During incubation, a CO2 equilibrium is established between the air and water phases. Under more alkaline conditions, more CO2 dissolves in the water phase.103 Biochars from corn stover (pH 10.01) and rice husk (pH 9.69) are highly alkaline, so both reduced CO2 emissions from the soil at all rates of biochar application.103 Similarly, wood chip biochar-amended soil [at a rate of >20% (w/w)] suppressed CO2 emissions versus control soil.104
3.4 Plant responses: heights, number of leaves, total fresh and dry weights
Biochar addition to soil increased eggplant growth and the number of leaves produced compared to the control soil. The data shown (Tables SM3 and SM4† and Fig. 9 and 10) are the mean values of the three experiments. The plant heights and numbers of leaves were measured every week on eggplants grown in CSBC- and RHBC-amended soils. Using 0.5 and 1.5 wt% CSBC had similar effects on plant growth. RHBC, used at 1.5 and 3.0 wt%, also shows similar changes. Soils amended with 3% biochars (CSBC and RHBC) induced the largest increases in both plant height and number of leaves (see Tables SM3 and SM4†). During the 1st to 7th week, the increase in plant height grown in RHBC- or CSBC-amended soils was similar and significantly greater than in the control. The 3.0 wt% addition of CSBC stimulated more growth in plant height versus 1.5 and 0.5 wt% additions.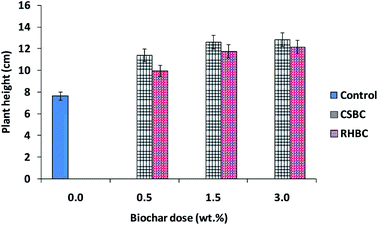 | ||
| Fig. 9 Influence of CSBC and RHBC doses on plant height after an incubation period of 7 weeks. Error bars represent standard error of the mean (n = 3) and p > 0.05. | ||
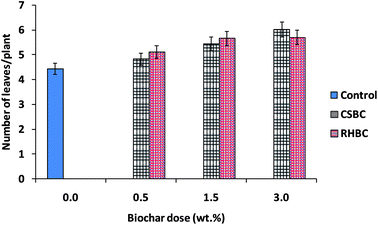 | ||
| Fig. 10 Number of leaves per eggplant plant as influenced by CSBC and RHBC doses (%) during an incubation period of 7 weeks. Error bars represent standard error of the mean (n = 3) and p > 0.05. | ||
Biochar effect on plant height was measured starting from the 1st to 7th week. CSBC exerted significant effects on the plant height (Table SM3† and Fig. 9), stimulating more growth than RHBC. Average plant height increased from 8.3 cm (1st week) to 20 cm (7th week) in CSBC (3.0 wt%)-amended soil and 7.5 cm (1st week) to 16.2 cm (7th week) in case of RHBC (3.0 wt%)-amended soil samples versus 6.0 cm (1st week) to 9.5 cm (7th week) in case of control (Table SM3†). Thus, both CSBC and RHBC addition to soil enhanced eggplant growth versus control soil.
The number of eggplant leaves was counted from the 1st week to 7th week. An increase in the number of leaves occurred using both CSBC- and RHBC-amended soils (Table SM4† and Fig. 10). Both biochar-amended soils gave similar leaf growth trends.
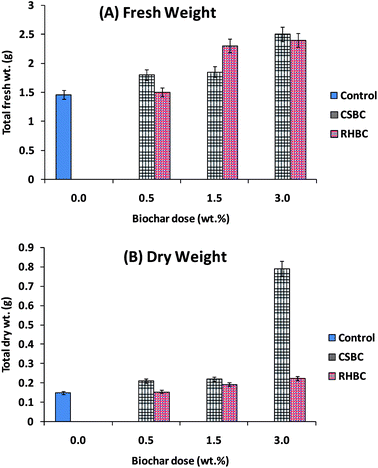
Both biochar amendments produce incremental eggplant fresh weights as the amount of biochar added was increased [Fig. 11(A)]. Fresh weight enhancements of 42 and 39% over that produced by control soil were achieved with CSBC (3.0 wt%) and RHBC (3.0 wt%) amendments.
Dry eggplant weight increased more with CSBC than RHBC amendments, exhibiting a large increment going from 1.5 to 3.0 wt% of CSBC [Fig. 11(B)]. Maximum dry weight increments of 82% versus 35% occurred in soils amended with 3.0% CSBC and 3.0% RHBC, respectively. Increased crop growth with biochar application has frequently been reported.15,16,89,93,105 In the present study, exchangeable cation and CEC values were larger for the post-harvest soils amended with biochars (Table 2).
3.5 Carbon mass balance
About 3.4 kg of corn stover is required to make 1.0 kg of the slow pyrolysis (CSBC) char. Some of that carbon is lost as CO2 during pyrolysis. All the C in stover initially comes from the atmosphere. So, the CO2 lost during biochar formation is not considered in the overall C-budget. Table 3 summarizes the carbon mass balances. Carbon balances for adding CSBC and RHBC do clearly show a large increase in soil carbon after incubation despite experimental error and the assumptions made. The CO2 budget sample calculations for (3.0% CSBM and 3.0% CSBC) are shown below:| Total C in soil (g) A | Dose B | Percent C in biomass/biochar C | Total C (g) in added biomass/biochar D | Cumulative CO2 weight loss (g kg−1 soil) E | Loss of C from 500 g of soil F | Total carbon IN (g) G = A + D | Total carbon OUT (g) H = F | Total carbon left in soil = carbon IN − carbon OUT (g) I = G − H |
|---|---|---|---|---|---|---|---|---|
| Soil | ||||||||
| 7.4 | Nil | Nil | Nil | 11.74 | 3.20 | 7.4 | 3.20 | 4.20 |
![[thin space (1/6-em)]](https://www.rsc.org/images/entities/char_2009.gif) |
||||||||
| Biomass | ||||||||
| 7.4 | 0.5% CSBM | 44.24 | 1.10 | 37.48 | 10.22 | 8.51 | 10.22 | −1.71 |
| 7.4 | 1.5% CSBM | 44.24 | 3.32 | 88.44 | 24.12 | 10.72 | 24.12 | −13.40 |
| 7.4 | 3.0% CSBM | 44.24 | 6.64 | 104.25 | 28.43 | 14.04 | 28.43 | −14.40 |
| 7.4 | 0.5% RHBM | 40.43 | 1.01 | 17.80 | 4.85 | 8.41 | 4.85 | 3.56 |
| 7.4 | 1.5% RHBM | 40.43 | 3.03 | 24.62 | 6.71 | 10.43 | 6.71 | 3.71 |
| 7.4 | 3.0% RHBM | 40.43 | 6.06 | 34.83 | 9.50 | 13.47 | 9.50 | 3.96 |
![[thin space (1/6-em)]](https://www.rsc.org/images/entities/char_2009.gif) |
||||||||
| Biochar | ||||||||
| 7.4 | 0.5% CSBC | 77.5 | 1.94 | 9.12 | 2.50 | 9.33 | 2.50 | 6.84 |
| 7.4 | 1.5% CSBC | 77.5 | 5.81 | 6.37 | 1.74 | 13.21 | 1.74 | 11.47 |
| 7.4 | 3.0% CSBC | 77.5 | 11.63 | 7.45 | 2.03 | 19.03 | 2.03 | 16.99 |
| 7.4 | 0.5% RHBC | 74.37 | 1.86 | 6.45 | 1.76 | 9.26 | 1.76 | 7.49 |
| 7.4 | 1.5% RHBC | 74.37 | 5.58 | 8.32 | 2.27 | 12.98 | 2.27 | 10.70 |
| 7.4 | 3.0% RHBC | 74.37 | 11.16 | 4.86 | 1.32 | 18.56 | 1.32 | 17.22 |
500 gram soil contains 1.48% carbon = 7.4 g C in starting (as-received) soil
3.0% CSBM (15 g) was added containing 44.24% carbon
Thus, total C in CSBM = 15 g × 0.4424 = 6.64 g
Cumulative CO2 loss after 107 days incubation = 104.25 g kg−1 soil
Soil weight = 500 g
Thus total carbon lost = [104.25 g C kg−1 soil] × (12/44) = 28.43 g
The carbon balance can be obtained using the following expression
Carbon IN − carbon OUT = carbon left in soil
Carbon IN = 7.4 g in as received soil + 6.64 g C added as CSBM = 14.04 g
Carbon OUT = 28.43 g (lost as CO2)
Thus, carbon left in soil = 14.04–28.43 = −14.40 g
This reflects experimental error. It says (to the degree it is accurate) that significant carbon loss has occurred over the period.
3.0% CSBC (15 g) was added containing 77.5% carbon
Thus, total C in CSBC = 15 g × 0.775 = 11.63 g
Cumulative CO2 loss after 107 days incubation = 7.45 g kg−1 soil
Soil weight = 500 g
Thus total carbon lost = [7.45 g C kg−1 soil] × (12/44) = 2.03 g
Carbon IN − carbon OUT = carbon left in soil
Carbon IN = 7.4 g in as received soil + 11.63 g C added as CSBM = 19.03
Carbon OUT = 2.03 g (lost as CO2)
Carbon remaining in soil = 19.03–2.03 = 17.00 g
Thus, there is a gain of 17.00 g after addition of 3.0% CSBC
CO2 sequestered includes the amount of carbon in the biochar amendment which remains in the soil. One could enhance C-sequestration by charring the added biomass growth, induced by biochar amendment, and adding it to the soil.
Applying biochar removes CO2 from the air via carbon sequestered in the biochar plus any extra carbon in the incremental amount of biomass grown.
(a) Biochar C oxidation short term (during the year) was neglected for slow pyrolysis char made at ∼600 °C. This should remain in the soil for decades, or centuries.
(b) It is assumed that most root mass with and without biochar present decays to CO2 rapidly (a few years).
Stover or husk biomass used as amendments, originally removed CO2 from the air. However, they decay, releasing most carbon back to the atmosphere, although some may end up in incremental plant growth biomass carbon. This mineralizes in the soil, and again converts to atmospheric carbon dioxide within a few years (Lehmann et al., 2006). Biochar, in contrast, is far more stable, remaining in soil for hundreds or thousands of years (Lehmann et al., 2006). Hence, repeated biochar applications in large scale agriculture, if applied worldwide has substantial C-sequestration potential.
4 Conclusions
Corn stover and rice husks were successfully converted to their slow pyrolysis biochars (CSBC and RHBC), characterized, and used in soil incubation studies. Soil amended with these biochars and both parent biomasses were incubated for 107 days. The CO2 emission from (3.0% wt/wt) CSBC-amended soil decreased by 15% versus control soil and by 84% compared to 3.0% wt/wt corn stover-amended soil. Thus, substantial CO2 emission could be avoided by first converting stover to biochar instead of directly returning the stover to agricultural fields. Additionally, biochar increases soil organic carbon, organic matter, pH, EC, cation exchanges capacity, water holding capacity. These fertility enhancements depended on the amount and type of biochar added. Biochar application increased eggplant height and leaf numbers versus control soil during incubation. Eggplants grown without adding biochar exhibited ∼36% of its original growth in seven weeks versus 59% in the soil amended with CSBC (3.0% wt). Similarly, RHBC-amended soil (0.5 and 1.5 wt%) RHBC led to a 40% increase in leaf growth compared to the control soil, while 3.0% (wt/wt) RHBC gave a 53% increase.If agricultural biomass wastes, which are currently burned in India and elsewhere, were instead pyrolyzed to reasonable biochar yields and used to amend the soil, major benefits could be realized. First, less CO2 would be emitted making biochar then by open burning of stubble and wastes. Thus, a higher fraction of the carbon in these wastes would be returned to the soil as biochar then as the ash from burning. Also, the biochar would contain the micronutrients found in ash. Since a significant portion of biochar carbon does not decay, it remains sequestered for long periods in the soil counteracting global warming. Finally, less CO2 emission from soil fertility by many known mechanisms (water retention, enhanced CEC, providing surfaces for microbes and beneficial fungi, conversion of some biochar to organic carbon, etc.) should provide a local incentive to make biochar rather than openly burn residues. These benefits need to be established in large field trails over multiyear period for specific crops. If this is demonstrated to farmers, this might reduce open burning, lower its accompanying air pollution, and emplace a carbon sequestration method in agricultural practice on a large scale, while enhancing crop yields.
Conflicts of interest
There are no conflicts of interests to declare.Acknowledgements
Financial support [DST/IS-STAC/CO2-SR-129/12(G)] from Department of Science and Technology, New Delhi, India is thankfully acknowledged. Authors are thankful to Advance Instrumentation Research Facility (AIRF) Jawaharlal Nehru University, New Delhi for allowing us to use XRD, FTIR, SEM, TEM, and EDXRF facilities for biochar and soil characterization. We thank Dr Jeff Novak, Research Soil Scientist, USDA-ARS-CPRC, 2611 West Lucas Street, Florence, SC 29501 USA for reviewing the manuscript. His suggestions improved the manuscript. We also thank Prof. Yong Sik Ok, Korea University, Seoul for his continuous help in conducting this study. Authors also thank the University Grant Commission (UGC), New Delhi for providing the financial assistance under 21st Century Indo-US Research Initiative 2014 to Jawaharlal Nehru University, New Delhi and Mississippi State University, USA in the project “Clean Energy and Water Initiatives” [UGC No. F.194-1/2014(IC)]. One of the authors (DM) thanks Jawaharlal Nehru University for providing financial assistance under Second phase of University with Potential of Excellence (UPOE II) grant (ID 189). Authors also acknowledge the funding support from DST PURSE, Government of India.References
- S. Solomon, D. Qin, M. Manning, Z. Chen, M. Marquis, K. B. Averyt, M. Tignor and H. L. Miller, The Physical Science Basis. Contribution of Working Group I to the Fourth Assessment Report of the Intergovernmental Panel on Climate Change, Cambridge University Press, Cambridge, United Kingdom and New York, NY, USA, 2007 Search PubMed.
- D. M. D'Alessandro, B. Smit and J. R. Long, Angew. Chem., Int. Ed., 2010, 49, 6058–6082 CrossRef PubMed.
- M. Gadalla, Ž. Olujić, M. Jobson and R. Smith, Energy Fuels, 2006, 31, 2398–2408 CAS.
- NOAA, 2015, http://https://www.esrl.noaa.gov/gmd/ccgg/trends/weekly.html.
- USDOE, U.S. Energy Information Administration, International Energy Outlook, U.S. Department of Energy, Washington, DC, 2010 Search PubMed.
- P. Smith, D. Martino, Z. Cai, D. Gwary, H. Janzen, P. Kumar, B. McCarl, S. Ogle, F. O'Mara, C. Rice, B. Scholes and O. Sirotenko, in Climate Change: Mitigation. Contribution of Working Group III to the Fourth Assessment Report of the Intergovernmental Panel on Climate Change, ed. B. Metz, O. R. Davidson, P. R. Bosch, R. Dave and L. A. Meyer, Cambridge University Press, Cambridge, UK, 2007 Search PubMed.
- J. M. Welles, T. H. Demetriades-Shah and D. K. McDermit, Chem. Geol., 2001, 177, 3–13 CrossRef CAS.
- EPA, Climate Change, Environmental Protection Agency, January 25 2015, EPA Website, http://www.epa.gov/climatechange/index.html Search PubMed.
- D. Woolf, J. E. Amonette, F. A. Street-Perrott, J. Lehmann and S. Joseph, Nat. Commun., 2010, 1, 56, DOI:10.1038/ncomms1053.
- IPCC, in Intergovernmental Panel on Climatic Change Special Report, ed. R. T. Watson, R. Noble, B. Bolin, N. H. Ravindranath, D. J. Verardo and D. J. Dokken, Cambridge University Press, Cambridge, 2000 Search PubMed.
- C. Marchetti, Clim. Change, 1977, 1, 59–68 CrossRef CAS.
- D. Reichle, J. Houghton, S. Benson, J. Clarke, R. Dahlman, G. Hendrey, H. Herzog, J. Hunter-Cevera, G. Jacobs, R. Judkins, B. Kane, J. Ekmann, J. Ogden, A. Palmisano, R. Socolow, J. Stringer, T. Surles, A. Wolsky, N. Woodward and M. York, Working paper on carbon sequestration science and technology, Carbon Sequestration Research and Development, U.S. Department of Energy, Office of Science, Washington DC, DOE, 1999, http://https://www.netl.doe.gov/publications/press/1999/seqrpt.pdf Search PubMed.
- R. Lal, Geoderma, 2004, 123, 1–22 CrossRef CAS.
- A. Sissoko and K. Kpomblekou-A, Soil Biol. Biochem., 2010, 42, 543–550 CrossRef CAS.
- J. Lehmann, J. P. D. Silva, C. Steiner, T. Nehls, W. Zech and B. Glaser, Plant Soil, 2003, 249, 343–357 CrossRef CAS.
- B. Glaser, J. Lehmann and W. Zech, Biol. Fertil. Soils, 2002, 35, 219–230 CrossRef CAS.
- D. Mohan, C. U. Pittman Jr and P. H. Steele, Energy Fuels, 2006, 20, 848–889 CrossRef CAS.
- J. Lehmann, J. Gaunt and M. Rondon, Mitig. Adapt. Strategies Glob. Chang., 2006, 11, 403–427 CrossRef.
- J. Lehmann, Front. Ecol. Environ., 2007, 5, 381–387 CrossRef.
- J. Lehmann, Nat. Commun., 2007, 447, 143–144 CrossRef CAS PubMed.
- J. Lehmann, Front. Ecol. Environ., 2007, 5, 381–387 CrossRef.
- M. Fowle, Biomass Bioenergy, 2007, 31, 426 CrossRef.
- D. Mohan, A. Sarswat, Y. S. Ok and C. U. Pittman Jr, Bioresour. Technol., 2014, 160, 191–202 CrossRef CAS PubMed.
- M. Ahmad, A. U. Rajapaksha, J. E. Lim, M. Zhang, N. Bolan, D. Mohan, M. Vithanage, S. S. Lee and Y. S. Ok, Chemosphere, 2014, 99, 19–33 CrossRef CAS PubMed.
- D. S. Scott and J. Piskorz, Can. J. Chem. Eng., 1984, 62, 404–412 CrossRef CAS.
- S. Meyer, B. Glaser and P. Quicker, Environ. Sci. Technol., 2011, 45, 9473–9483 CrossRef CAS PubMed.
- L. Li, N. Zhao, W. Wei and Y. Sun, Fuel, 2013, 108, 112–130 CrossRef CAS.
- H. W. Pennline, D. R. Luebke, K. L. Jones, C. R. Myers, B. I. Morsi, Y. J. Heintz and J. B. Ilconich, Fuel Process. Technol., 2008, 89, 897–907 CrossRef CAS.
- FONA, German Federal Ministry of Education and Research Funding Program Information Brochure, 2014 Search PubMed.
- J. L. Gaunt and J. Lehmann, Environ. Sci. Technol., 2008, 42, 4152–4158 CrossRef CAS PubMed.
- W. Sombroek, M. D. L. Ruivo, P. M. Fearnside, B. Glaser and J. Lehmann, Amazonian Dark Earths, 2003, pp. 125–139 Search PubMed.
- J. Lehmann, M. C. Rillig, J. Thies, C. A. Masiello, W. C. Hockaday and D. Crowley, Soil Biol. Biochem., 2011, 43, 1812–1836 CrossRef CAS.
- S. Jeffery, F. G. A. Verheijen, M. V. D. Velde and A. C. Bastos, Agric., Ecosyst. Environ., 2011, 144, 175–187 CrossRef.
- K. A. Spokas, GCB Bioenergy, 2013, 5, 165–176 CrossRef CAS.
- J. Lehmann and M. Rondon, in Biological Approaches to Sustainable Soil Systems, ed. N. Uphoff, CRC Press, Boca Raton, 2005 Search PubMed.
- D. Busch, C. Kammann, L. Grünhage and C. Müller, J. Environ. Qual., 2012, 41, 1023–1032 CrossRef CAS PubMed.
- C. Kammann, S. Ratering, C. Eckhard and C. Müller, J. Environ. Qual., 2012, 41, 1052–1066 CrossRef CAS PubMed.
- K. Karhu, T. Mattila, I. Bergström and K. Regina, Agric., Ecosyst. Environ., 2011, 140, 309–313 CrossRef CAS.
- S. Baronti, F. P. Vaccari, F. Miglietta, C. Calzolari, E. Lugato, S. Orlandini, R. Pini, C. Zulian and L. Genesio, Eur. J. Agron., 2014, 53, 38–44 CrossRef CAS.
- W. Buss, C. Kammann and H. W. Koyro, J. Environ. Qual., 2012, 41, 1157–1165 CrossRef CAS PubMed.
- M. Rondon, J. A. Ramirez and J. Lehmann, Presented in part at the Proceedings of the 3rd USDA Symposium on Greenhouse Gases and Carbon Sequestration, Baltimore, USA, 2005 Search PubMed.
- Y. Yanai, K. Toyota and M. Okazaki, Soil Sci. Plant Nutr., 2007, 53, 181–188 CrossRef CAS.
- D. A. Wardle, M.-C. Nilsson and O. Zackrisson, Science, 2008, 320, 629 CrossRef CAS PubMed.
- A. Zhang, L. Cui, G. Pan, L. Li, Q. Hussain, X. Zhang, J. Zheng and D. Crowley, Effect of biochar amendment on yield and methane and nitrous oxide emissions from a rice paddy from Tai Lake plain, China, Agric., Ecosyst. Environ., 2010, 139, 469–475 CrossRef CAS.
- K. A. Spokas and D. C. Reicosky, Ann. Environ. Sci., 2009, 3, 179–193 CAS.
- A. Hilscher, K. Heister, C. Siewert and H. Knicker, Org. Geochem., 2009, 40, 332–342 CrossRef CAS.
- K. A. Spokas, K. B. Cantrell, J. M. Novak, D. W. Archer, J. A. Ippolito, H. P. Collins, A. A. Boateng, I. M. Lima, M. C. Lamb, A. J. McAloon, R. D. Lentz and K. A. Nichols, J. Environ. Qual., 2012, 41, 973–989 CrossRef CAS PubMed.
- S. Wu, H. He, X. Inthapanya, C. Yang, L. Lu, G. Zeng and Z. Han, Environ. Sci. Pollut. Res., 2017, 24, 16560–16577 CrossRef CAS PubMed.
- MNRE, Ministry of New and Renewable Energy, 2009, http://mnre.gov.in/schemes/grid-connected/biomass-powercogen.
- P. K. Gupta, S. Sahai, N. Singh, C. K. Dixit, D. P. Singh and C. Sharma, Curr. Sci., 2004, 87, 1713–1715 CAS.
- ASTM, Standard Method for Chemical Analysis of Wood Charcoal, American Society for Testing and Materials international, West Conshohocken, PA, USA, D1762–84, 2007 Search PubMed.
- S. Maiti, S. Dey, S. Purakayastha and B. Ghosh, Bioresour. Technol., 2006, 97, 2065–2070 CrossRef CAS PubMed.
- R. Viji and P. P. Rajesh, J. Environ. Res. Dev., 2012, 7, 293–398 Search PubMed.
- GOI, Soil Testing in India, Department of Agriculture and Cooperation, Ministry of Agriculture, Government of India, New Delhi, 2011 Search PubMed.
- J. Y. Wang, M. Zhang, Z. Q. Xiong, P. L. Liu and G. X. Pan, Biol. Fertil. Soils, 2011, 47, 887–896 CrossRef CAS.
- N. Jäger, C. F. Stange, B. Ludwig and H. Flessa, Biol. Fertil. Soils, 2011, 47, 483 CrossRef.
- R. Vijai and P. R. Prassana, J. Environ. Res. Dev., 2011, 6, 393–398 Search PubMed.
- MTI, Methods Manual: Soil Testing in India, Department of Agriculture & Cooperation, Ministry of Agriculture, Government of India, New Delhi, 2011 Search PubMed.
- G. W. Thomas, in Methods of soil analysis, Part 2 Chemical and microbiological properties, Agronomy Monograph, ed. A. L. Page, R. H. Miller and D. R. Keeney, American Society of Agronomy, Madison, Wis, USA, 2nd edn, 1982, vol. 9, pp. 159–165 Search PubMed.
- P. J. Wilson, K. Thompson and J. G. Hodgson, New Phytol., 1999, 143, 155–162 Search PubMed.
- K. P. Upadhyay, D. George, R. S. Swift and V. Galea, J. Integr. Agric., 2014, 13, 541–546 CrossRef.
- Y. Chun, G. Sheng, C. T. Chiou and B. Xing, Environ. Sci. Technol., 2004, 38, 4649–4655 CrossRef CAS PubMed.
- K. Y. Chan and Z. Xu, in Biochar for Environmental Management, ed. J. Lehmann and S. Joseph, Sterling (VA): Earthscan, 2009, pp. 67–81 Search PubMed.
- W. A. W. A. K. Ghani, A. Mohd, G. D. Silva, R. T. Bachmann, Y. H. Taufiq-Yap, U. Rashid and A. A. H. Al-Muhtaseb, Ind. Crops Prod., 2013, 44, 18–24 CrossRef.
- B. L. Chen, D. D. Zhou and L. Z. Zhu, Environ. Sci. Technol., 2008, 42, 5137–5143 CrossRef CAS PubMed.
- T. A. J. Kuhlbusch, Environ. Sci. Technol., 1995, 29, 2695–2702 CrossRef CAS PubMed.
- M. Uchimiya, L. H. Wartelle, K. T. Klasson, C. A. Fortier and I. M. Lima, J. Agric. Food Chem., 2011, 59, 2501–2510 CrossRef CAS PubMed.
- Z. Liu, F. S. Zhang and J. Wu, Fuel, 2010, 89, 510–514 CrossRef CAS.
- B. Chen and Z. Chen, Chemosphere, 2009, 76, 127–133 CrossRef CAS PubMed.
- X. D. Cao and W. Harris, Bioresour. Technol., 2010, 101, 5222–5228 CrossRef CAS PubMed.
- A. L. Biederman and W. S. Harpole, GCB Bioenergy, 2013, 5, 202–214 CrossRef.
- Y. Huang, X. Yin, C. Wu, C. Wang, J. Xie, Z. Zhou, L. Ma and H. Li, Biotechnol. Adv., 2009, 27, 568–572 CrossRef CAS PubMed.
- T. Chen, R. Liu and N. R. Scott, Fuel Process. Technol., 2016, 142, 124–134 CrossRef CAS.
- X. Xu, X. Hu, Z. Ding and Y. Chen, Chemosphere, 2017, 189, 76–85 CrossRef CAS PubMed.
- J. A. Madrid and M. Lanzón, Appl. Surf. Sci., 2017, 424, 2–8 CrossRef CAS.
- X. Ma, S. Yuan, L. Yang, L. Li, X. Zhang, C. Su and K. Wang, CrystEngComm, 2013, 15, 8288–8299 RSC.
- C. Jin, L.-N. Jin, M.-X. Guo, P. Liu and S.-W. Bian, J. Colloid Interface Sci., 2017, 508, 426–434 CrossRef CAS PubMed.
- F. R. Shamskar, F. Meshkani and M. Rezaei, J. CO2 Util., 2017, 22, 124–134 CrossRef.
- X. Li, Q. Zhang, B. Hou, J. Ye and X. Li, Powder Technol., 2017, 318, 224–229 CrossRef CAS.
- C. H. Chia, B. Gong, S. D. Joseph, C. E. Marjo and A. M. Rich, Vib. Spectrosc., 2012, 62, 248–257 CrossRef CAS.
- R. S. Kumar and P. Rajkumar, Infrared Phys. Technol., 2014, 67, 30–41 Search PubMed.
- E. Smidt and M. Schwanninger, Spectrosc. Lett., 2005, 38, 247–270 CrossRef CAS.
- D. Mohan, H. Kumar, A. Sarswat, M. Alexandre-Franco and C. U. Pittman Jr, Chem. Eng. J., 2014, 236, 513–528 CrossRef CAS.
- D. Mohan, P. Singh, A. Sarswat, P. H. Steele and C. U. Pittman, J. Colloid Interface Sci., 2015, 448, 238–250 CrossRef CAS PubMed.
- D. Naumann, P. C. Schultz and D. Helm, in Infrared Spectroscopy of Biomolecules, ed. H. H. Mantsch and H. H. Chapmanx, Wiley, New York, USA, 1996, p. 279 Search PubMed.
- F. B. Reig, J. V. G. Adelantado and M. C. M. M. Moreno, Talanta, 2002, 58, 811–821 CrossRef CAS PubMed.
- B. Smith, Infrared Spectral Interpretation, CRC Press, Boca Raton, FL, 1999 Search PubMed.
- L. V. Zwieten, S. Kimber, S. Morris, A. Downie, E. Berger, J. Rust and C. Scheer, Soil Res., 2010, 48, 555–568 CrossRef.
- K. Y. Chan, L. V. Zwieten, I. Meszaros, A. Downie and S. Joseph, Aust. J. Soil Res., 2007, 45, 629–634 CrossRef CAS.
- A. Nigussie, E. Kissi, M. Misganaw and G. Ambaw, Am.-Eurasian J. Agric. Environ. Sci., 2012, 12, 369–376 CAS.
- K. Y. Chan, L. V. Zwieten, I. Meszaros, A. Downie and S. Joseph, Soil Res., 2008, 46, 437–444 CrossRef.
- F. Verheijen, S. Jeffery, A. C. Bastos, M. V. D. Velde and I. Diafas, Biochar Application to Soils : A Critical Scientific Review of Effects on Soil Properties, Processes and Functions, European Commission, Joint Research Centre, Institute for Environment and Sustainability, 2010 Search PubMed.
- M. A. Rondon, J. Lehmann, J. Ramírez and M. Hurtado, Biol. Fertil. Soils, 2007, 43, 699–708 CrossRef.
- J. W. Lee, M. Kidder, B. R. Evans, S. Paik, A. C. Buchanan, C. T. Garten and R. C. Brown, Environ. Sci. Technol., 2010, 44, 7970–7974 CrossRef CAS PubMed.
- T. M. Abdel-Fattah, M. E. Mahmoud, S. B. Ahmed, M. D. Huff, J. W. Lee and S. Kumar, J. Ind. Eng. Chem., 2015, 22, 103–109 CrossRef CAS.
- S. Prabha, R. Renuka, N. P. Sreekanth, P. Babu and A. P. Thomas, Ann. Environ. Sci., 2013, 7, 17–30 Search PubMed.
- S. Schimmelpfenning and B. Glaser, J. Environ. Qual., 2007, 41, 1001–1013 CrossRef PubMed.
- S. L. Martin, M. L. Clarke, M. Othman, S. J. Ramsden and H. M. West, Biomass Bioenergy, 2015, 79, 39–49 CrossRef CAS.
- D. L. Jones, D. V. Murphy, M. Khalid, W. Ahmad, G. Edwards-Jones and T. H. DeLuca, Soil Biol. Biochem., 2011, 43, 1723–1731 CrossRef CAS.
- K. Wiedner, C. Rumpel, C. Steiner, A. Pozzi, R. Maas and B. Glaser, Biomass Bioenergy, 2013, 59, 264–278 CrossRef CAS.
- S.-S. Lim, W.-J. Choi, K.-S. Lee and H.-M. Ro, J. Soils Sediments, 2012, 12, 1299–1308 CrossRef CAS.
- K. E. A. Ohlsson, Soil Sci. Soc. Am. J., 2000, 64, 2155–2161 CrossRef CAS.
- Y. Liu, M. Yang, Y. Wu, H. Wang, Y. Chen and W. Wu, J. Soils Sediments, 2011, 11, 930–939 CrossRef CAS.
- K. A. Spokas, J. M. Baker and D. C. Reicosky, Plant Soil, 2010, 333, 443–452 CrossRef CAS.
- H. Asai, B. K. Samson, H. M. Stephan, K. Songyikhangsuthor, K. Homma, Y. Kiyono, Y. Inoue, T. Shiraiwa and T. Horie, Field Crops Res., 2009, 111, 81–84 CrossRef.
Footnote |
| † Electronic supplementary information (ESI) available. See DOI: 10.1039/c7ra10353k |
| This journal is © The Royal Society of Chemistry 2018 |

