Different binding sites of serum albumins in the protein corona of gold nanoparticles†
Gergo Peter
Szekeres
 ab and
Janina
Kneipp
 *ab
*ab
aHumboldt-Universität zu Berlin, Department of Chemistry, Brook-Taylor-Str. 2, 12489 Berlin, Germany
bSchool of Analytical Sciences Adlershof, Albert-Einstein-Str. 5-9, 12489 Berlin, Germany. E-mail: janina.kneipp@chemie.hu-berlin.de
First published on 6th November 2018
Abstract
The interaction of bovine serum albumin (BSA) and human serum albumin (HSA), sharing a sequence similarity of 77.5%, with gold nanoparticles of a size of ∼30 nm was investigated by surface-enhanced Raman scattering (SERS). The spectra provide information on those residues of the proteins in proximity of the nanoparticles. The SERS signals indicate an electrostatic interaction of both proteins with the citrate ligands at the nanoparticle surface via lysine residues. HSA, different from BSA also binds directly to the gold surface by particularly flexible protein segments that were identified by comparison of the vibrational bands with the known amino acid sequence of the molecule. The data suggest that both the direct binding as well as interaction with the citrate ligands determine the interaction, yet to varying extent in the two very similar serum proteins. This has implications for their use in bio-functionalization, and for the application of gold nanostructures in bioanalytics and medicine.
Introduction
With the development of nanotechnology, many kinds of nanoparticles become available for use in both therapeutic and diagnostic applications.1–5 When a nanoparticle is exposed to a biofluid such as blood,2,6 biomolecules, mostly proteins, adsorb on its surface and form a dynamically changing layer termed protein corona.2,6–8 The protein corona modifies the physicochemical properties of the pristine material and determines the new, biological identity.9 The biological identity can trigger responses of the biological system different than to the surface of the pristine nanostructures, and determines the fate of the nanoparticle, e.g., accumulation and residence time inside a cell or organism. Therefore, knowledge on the adsorption of blood plasma proteins on different nanostructures is very important, including a thorough understanding of their adsorption kinetics.10,11 A general explanation of adsorption processes on nanoparticles is specifically challenging due to their diverse composition, size, and surface properties.2,6,12 Here, we discuss the interaction of bovine serum albumin (BSA) and of human serum albumin (HSA), as most abundant serum proteins with citrate-stabilized gold nanoparticles in the size range of 30 nm using data from surface-enhanced Raman scattering (SERS). Thereby, we elucidate the binding sites of these proteins when they form a protein corona around the gold nanoparticles. SERS arises, when Raman scattering takes place in high local optical fields of gold nanoparticles,13,14 allowing the investigation of surface interactions.15,16 The confinement of SERS to the immediate proximity to the nanoparticle enables the probing of those parts of the protein that interact with the surface.16–20The citrate-stabilized gold nanoparticles used for the work presented here are of high biocompatibility21,22 and have been used in many SERS studies of cells and organic molecules.23–27 The spectral signatures of the citrate ligands of the gold nanoparticles do not show strong interference with the SERS signals from the molecules of interest.28,29 The SERS spectra provide information on the presence of molecular groups in the immediate vicinity of the nanoparticle surface, regardless of the type of interaction, either from protein molecules that interact with the citrate ions on the nanoparticles, or from the proteins that are adsorbed directly on the gold surface, replacing the citrate ions previously present. As will be discussed, our SERS data indicate that different adsorption mechanisms of proteins are in place for different proteins: (i) the electrostatic binding to the citrate ions on the nanoparticles’ surface,12,30,31 and (ii) the exchange of the citrate ligands with the proteins, leading to the direct interaction with the nanoparticle surface.31,32
Materials and methods
Sample preparation
For all preparation of nanoparticles and samples, ultrapure water (Milli-Q) was used. BSA and HSA were purchased from Sigma-Aldrich (Steinheim, Germany). Gold(III) chloride trihydrate and trisodium citrate dihydrate for gold nanoparticle synthesis were purchased from Sigma-Aldrich (Steinheim, Germany) and Chemsolute (Renningen, Germany), respectively. Gold nanoparticles of a size of ∼30 nm, with pH of ∼4.5, were synthesized based on the method described by Lee and Meisel.33 The quality of the nanoparticles was confirmed by UV-Vis spectrometry (Jasco V-670). Fig. S1† shows a narrow band of the LSPR at λmax = 529 nm indicating the presence of 30 nm gold nanoparticles, which is in accord with the size found in transmission electron micrographs (Fig. S2†). The concentration of the nanoparticles was estimated to be 4 × 10⁻¹⁰ M.BSA and HSA protein solutions were prepared by dissolving 10 mg of each protein, respectively, in 1 mL water. 5 μL of the respective protein solution were added to 50 μL of the gold nanoparticles. The final sample pH was ∼4.5 for both proteins. At this pH, both BSA and HSA possess a net positive surface charge, given their respective pI's of 5.60 and 5.67 calculated using the ‘Compute pI/Mw tool’ of ExPASy Bioinformatics Resource Portal.34
SERS experiments
The sample was transferred onto a calcium fluoride plate for SERS measurements. Raman scattering was excited with a laser operating at a wavelength of 785 nm and an intensity of 5.7 × 10⁵ W cm−2. A 60× water immersion objective (NA = 1.2) was used for excitation and for focusing of the Raman scattered light onto a spectrograph equipped with a liquid nitrogen-cooled CCD detector. Per sample, approximately 100 SERS spectra were collected.Data pre-processing and analysis
All spectra were frequency-calibrated using a spectrum of a 1![[thin space (1/6-em)]](https://www.rsc.org/images/entities/char_2009.gif) :
:![[thin space (1/6-em)]](https://www.rsc.org/images/entities/char_2009.gif) 1 mixture of acetonitrile and toluene and de-spiked. Further data treatment before averaging and principal component analysis (PCA) was applied as follows: the spectra were background corrected based on an asymmetric least squares algorithm (ASLS),35 and vector-normalized. After pre-treatment, PCA using the spectral range of 400 cm−1 to 1800 cm−1 was performed with the first derivatives of the spectra. All analyses were carried out using MatLab and Wolfram Mathematica softwares.
1 mixture of acetonitrile and toluene and de-spiked. Further data treatment before averaging and principal component analysis (PCA) was applied as follows: the spectra were background corrected based on an asymmetric least squares algorithm (ASLS),35 and vector-normalized. After pre-treatment, PCA using the spectral range of 400 cm−1 to 1800 cm−1 was performed with the first derivatives of the spectra. All analyses were carried out using MatLab and Wolfram Mathematica softwares.
BSA and HSA sequence and structural data were obtained from PDB – Protein Data Bank, the PDB IDs are 4OR036 and 5ID737 for BSA and HSA, respectively.
Results and discussion
Fig. 1 shows the averages of ∼100 background corrected and vector-normalized BSA and HSA SERS spectra obtained with gold nanoparticles in solution. Table 1 provides the assignments of important bands in the spectra. In accordance with previous work,16,17,38 the spectra are dominated by amide II and amide III vibrations39,40 at 1559 cm−1 and ∼1250 cm−1, respectively, and by the bands assigned to vibrations of aromatic amino acid side chains that have high Raman cross-sections, such as their ring vibrations at ∼680 cm−1, ∼840 cm−1, ∼860 cm−1, or ∼890 cm−1.29,41 The presence of the stretching vibrations of S–S bonds, at 523 cm−1 and 533 cm−1 (ref. 41) in HSA and BSA, respectively, suggests that the protein molecules maintain their disulfide bridges as important elements of their secondary structure upon interaction with the nanoparticle surface. This is different from the interaction of other proteins with the surface of silver nanoparticles, where cleavage of disulfide bonds is possible.15,42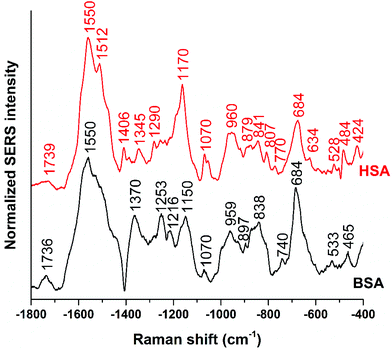 | ||
| Fig. 1 Averages of ∼100 BSA and ∼100 HSA SERS spectra obtained with citrate-stabilized gold nanoparticles and excited at a wavelength of 785 nm and an excitation intensity of 5.7 × 10⁵ W cm−2. | ||
| Raman bands (cm−1) | Assignments | |
|---|---|---|
| BSA | HSA | |
| a Based on ref. 29, 39–41, 43 and 55–58. Abbreviations: ν, stretching; δ, deformation; br, breathing; symm, symmetric; wag, wagging; sciss, scissoring; bend, bending; rock, rocking; tor, torsion; R, C6 ring; r, C5 ring. | ||
| 1736 | 1739 |
ν(C![[double bond, length as m-dash]](https://www.rsc.org/images/entities/char_e001.gif) O) O) |
| 1645 | Amide I | |
| 1589 | ν(R) | |
| 1550 | 1550 | Amide II, Trp: ν(R, r) |
| 1523 | Lys: δ(NH3+) | |
| 1512 | NH2 bend, ν(R) | |
| 1500 | ν(R, r) | |
| 1490 | C–H bend, δ(N–H) | |
| 1460 | 1466 | Cβ bend, δ(CH2, CH3) |
| 1425 | ν(C–N–H(r)) | |
| 1406 | ν(COO−)symm | |
| 1370 | 1366 | δ(CH3) |
| 1345 | 1345 | CH2 sciss, δ(CH3), ν(C–C), CH2 rock |
| 1319 | 1319 | CH2 wag |
| 1290 | 1290 | Amide III, δ(CH2, CH3), CH bend |
| 1271 | Amide III, δ(CH2, CH3) | |
| 1253 | Amide III, δ(CH2, CH3) | |
| 1221 | 1231 | Trp + Phe: δ(R) |
| 1216 | 1217 | Tyr + Phe: ν(R) |
| 1189 | Tyr + Phe | |
| 1170 | ν(C–N) | |
| 1150 | ν(C–N) | |
| 1127 | 1116 | ν(C–N, C–C) |
| 1093 | ν(C–C) | |
| 1070 | 1070 | ν(Cα–N, C–CH2), NH2 bend, ν(C–O) |
| 1058 | ν(Cα–N, C–CH2), NH2 bend | |
| 1023 | ν(C–N), NH2 bend | |
| 993 | 1010 | Phe + Tyr: br(R) |
| 959 | 963 | Trp, Val, H(R) twist, ν(C–C) |
| 942 | ν(C–C) | |
| 915 | Glu, Ile, Thr, Lys: ν(C–C) | |
| 897 | R | |
| 879 | H(R, r) sciss, N–H bend | |
| 865 | Tyr, δ(C–CH) R | |
| 838 | 841 | ν(Cα–N, C–C), Tyr |
| 816 | Ser: δ(COO−) | |
| 807 | δ(R) | |
| 787 | δ(C–H) | |
| 765 | 770 | Trp: br(indole)symm, δ(CH) |
| 740 | 743 | δ(CH), ν(C–S), Trp |
| 732 | δ(COO−), ν(C–S) | |
| 709 | 719 | ν(C–S) |
| 684 | 684 | δ(C–H), δ(R), δ(COO−) |
| 665 | ν(C–S) | |
| 651 | ν(C–S) | |
| 634 | 636 | Tyr: δ(R, CH), ν(C–S) |
| 612 | δ(R, C–H) | |
| 599 | δ(R) | |
| 586 | δ(R, C–C) | |
| 574 | δ(R, r), N–H(r) bend | |
| 548 | 549 | Trp: C–COO− asymm bend |
| 533 | 528 | δ(N–H), ν(S–S) |
| 517 | ν(S–S) | |
| 484 | R tor/bend, NH2 wag | |
| 465 | 458 | Trp: δ(R, r) |
| 452 | ν(C–S) | |
| 420 | 424 | Trp |
Even though vector-normalization prevents the average spectra from being dominated by a few high-intensity individual spectra, and those bands that occur frequently in the individual spectra are present in the average spectra, some band shifts and bands that occur rarely or have low intensity may disappear upon averaging. Therefore, it is useful to analyze individual spectra, and also their variation (see also Fig. 3 and 4 below). In Fig. 2, representative BSA and HSA single spectra from the data sets are shown, the respective band assignments are also given in Table 1.
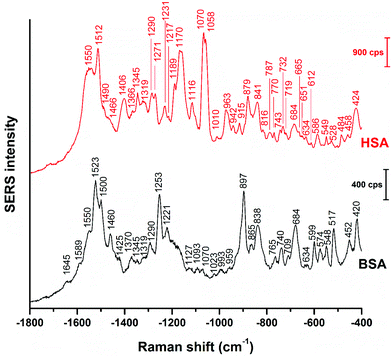 | ||
| Fig. 2 Representative SERS spectra of BSA and HSA obtained with citrate-stabilized gold nanoparticles. Excitation wavelength: 785 nm, excitation intensity: 5.7 × 10⁵ W cm−2, acquisition time: 1 s. | ||
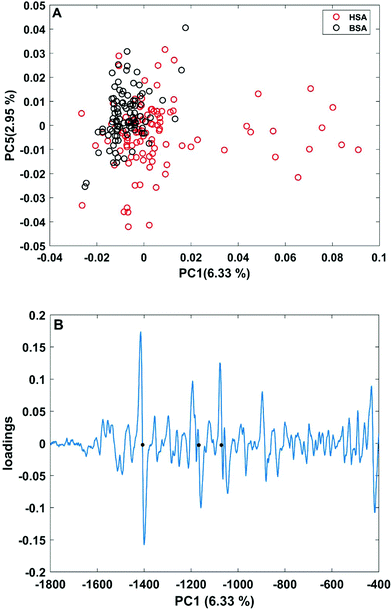 | ||
| Fig. 3 (A) Scores plot of the first and second principal components obtained in a PCA using the full spectral range of vector-normalized first derivatives of BSA and HSA SERS spectra. (B) Loading of the first PC. The dots mark the bands at 1406 cm−1 and 1170 cm−1 of the symmetric COO− stretching and C–N stretching vibrations,29,43 and at 1070 cm−1 of the C–O and/or C–C, NH2, and C–N stretching vibrations.29,49 | ||
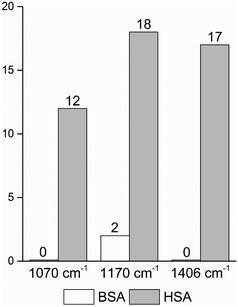 | ||
| Fig. 4 Frequencies of occurrence of the vibrational bands at 1070 cm−1 of the C–O and/or C–C, NH2, and C–N stretching modes,29,49 and at 1170 cm−1 and 1406 cm−1 of the C–N and the symmetric COO− stretching vibrations29,43 in the BSA and HSA dataset, respectively. | ||
The BSA spectrum shows pronounced signals of the –NH3+ deformation vibration of lysine residues at 1523 cm−1 (ref. 43), of the amide III band at 1253 cm−1 (ref. 40), of a ring vibration of tryptophan at 897 cm−1 (ref. 41), and of the C–C and/or Cα–N stretching vibration at 838 cm−1 (ref. 29). Interestingly, the band of lysine43 is not pronounced in the normal Raman spectrum of BSA reported, e.g., in ref. 38 and 40 (Fig. S3 and Table S1†). Nevertheless, its strong contribution to the SERS spectrum in spite of its small Raman cross section suggests that the lysine residues must be in very close proximity to the gold surface. A direct lysine-citrate interaction has been discussed in previous work using other approaches,12,18,30,31,44 and the SERS spectra of BSA support the hypothesis that binding takes place by such an electrostatic interaction.12,18,30,31,44 The strong amide III band at 1253 cm−1 and the band at 838 cm−1 in the BSA SERS spectrum suggest that the peptide backbone must be very close to the nanoparticle surface as well. Interestingly, the usually very strong ring vibration of phenylalanine and tryptophan at 1004 cm−1 (ref. 40) does not appear in the spectrum, excluding the proximity of aromatic side chains to the nanoparticle surface. Since the nonpolar amino acid side chains are located inside the folded structure,36,45 hidden from the hydrophilic environment, the absence of the 1004 cm−1 band suggests that the probed BSA molecules preserved their secondary structure in so far as these residues do not become exposed.
Also the SERS spectrum of HSA (Fig. 2) displays selective enhancement of bands that are not particularly prominent in the normal Raman spectrum of the molecule (Fig. S3 and Table S1†).46,47 Examples are the pronounced signals at 1550 cm−1 of the ring stretching of tryptophan29 or the deformation vibrations of the –NH2 group at 1512 cm−1, at 1058 cm−1, as well as at 1070 cm−1.29 The latter two bands also contain contributions from vibrations of Cα–N and C–CH2 bonds in the peptide backbone, in accord with a distinct signal of the C–N stretching band at 1170 cm−1.40 The enhancement of the SERS signals from the –NH2 groups and of the protein backbone indicate proximity of the basic amino acid residues and of the peptide backbone, respectively, to the nanoparticle. As seen in the case of the SERS spectra of BSA, the 1004 cm−1 band is absent, suggesting that the native structure of the adsorbed HSA molecules is at least partially intact. There are several bands in both the BSA and HSA SERS spectra assigned to aromatic and aliphatic vibrations (Table 1), indicating their proximity to the nanoparticle surface, which could also point toward a hydrophobic interaction with the nanoparticles.
The basic NH2 groups can be expected to interact with citrate ions in an acid–base equilibrium more than with the net positive surface of the bare nanoparticles48 that can reveal upon desorption of citrate ions, since upon their protonation, –NH3+ groups would be electrostatically repelled from the positively charged bare gold surface. Therefore, we conclude that just like the BSA spectrum, also the HSA spectrum suggests the interaction of the protein based on the electrostatic binding hypothesis.12,30–32
In order to take into account the molecular information from many gold nanostructures and molecules without averaging effects, all individual spectra of the data sets were analyzed in a principal component analysis (PCA). Fig. 3A shows the scores plot of the first two principal components (PC) as the result of a PCA using all individual spectra of HSA and BSA in the spectral range of 400 cm−1 to 1800 cm−1 as input. As is visible from the scores of the first PC, the spectra of HSA show a greater variation than those of BSA (compare black and red symbols in Fig. 3A). The loading of PC1 displayed in Fig. 3B suggests that the variance in the band at 1406 cm−1, which can be assigned to the COO− symmetric stretching,29,49 has the strongest influence on this separation. Furthermore, variances are observed for the band at 1070 cm−1, assigned to stretching vibrations of C–O and/or C–C, NH2, and C–N groups, and the C–N stretching mode at 1170 cm−1.29,43 The frequency of occurrence of these bands in the BSA and HSA spectra is presented in Fig. 4. Only two out of the 100 BSA spectra contain the band at 1170 cm−1. In contrast, the 1070 cm−1, 1170 cm−1, and 1406 cm−1 bands are mostly present in the HSA spectra. There, the three bands appear mostly together, or the 1406 cm−1 vibration appears together with either the 1170 cm−1 or the 1070 cm−1 vibrations. Therefore, the analysis of the whole plethora of different individual spectra suggests that in some cases, specific for HSA, different surface interactions take place than the citrate-lysine electrostatic interaction.12,30–32
In order to understand the potential interaction based on the SERS data, we discuss them in the context of the protein primary structure here. The two proteins HSA and BSA are very similar: a comparison of the two sequences showed approximately 77.5% sequence overlap. Since both the citrate layer and the pristine gold nanoparticle surface possess a negative and a positive net charge, respectively, we expect the protein molecules to interact with the nanoparticles primarily via their charged side chains. In BSA, there are 40 aspartic acid, 59 glutamic acid, 17 histidine, 59 lysine, and 23 arginine residues, while in HSA there are 36 aspartic acid, 62 glutamic acid, 16 histidine, 59 lysine, and 24 arginine side chains. Even though the side chain of histidine is only weakly acidic, it participates in acid–base interactions, since the nitrogen atoms in its ring can act as proton shuttle depending on protonation. Therefore, the fast transport of protons between side chains is facilitated, and an acidic or a basic residue in the proximity of histidine is more likely charged.
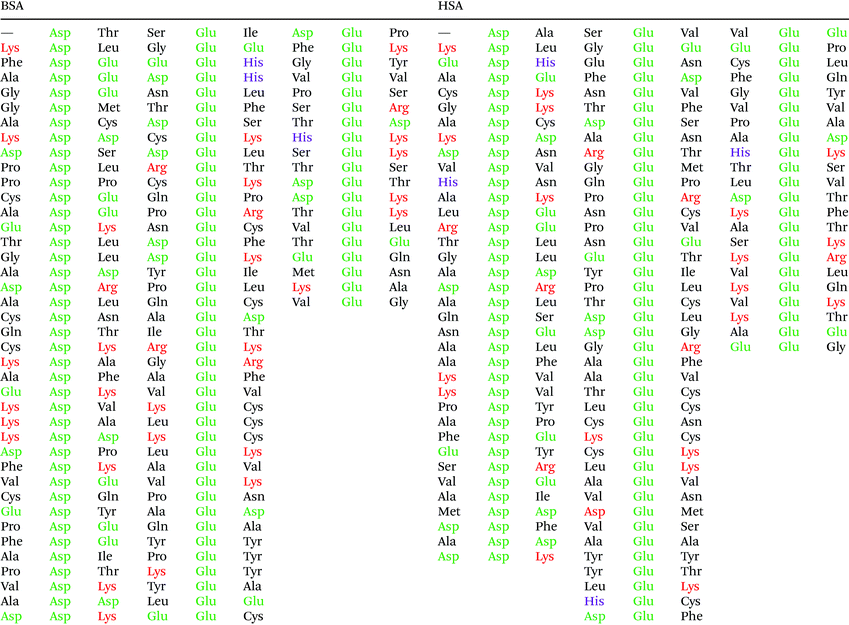
Fig. 5 shows that the aspartic acid and glutamic acid residues in BSA and HSA (99 and 98 in total in each protein, respectively) are distributed homogeneously along the protein chains. The pH of the local microenvironment can be very different from the global pH. Therefore, the protonation state of these amino acid side chains can be altered by their neighboring residues. Here, especially those neighbors that possess basic characteristics exert an influence, as they can facilitate the deprotonation of the acidic residues in proximity. Table 2 shows the list of neighboring groups of each aspartic acid and glutamic acid residue in both BSA and HSA, and the distribution of the basic residues lysine and arginine, as well as of histidine are marked. The data indicate that in BSA there are 12 and 15 lysine and one and five arginine residues neighboring aspartic acid and glutamic acid residues, respectively (Table 2). There are three histidine residues following a glutamic acid residue (Table 2). In contrast, in HSA, there are eight lysine, three arginine, and two histidine residues next to aspartic acid residues, and 11 lysine, four arginine, and two histidine residues next to glutamic acid residues (Table 2). In total, BSA contains six more amino acids that facilitate the deprotonation of their neighboring aspartic acid or glutamic acid. The pH of the sample was around 4.5, close to the isoelectric points of BSA30 and HSA,50 therefore, a deprotonating effect could have an influence on the protonation state of –COOH groups nearby.
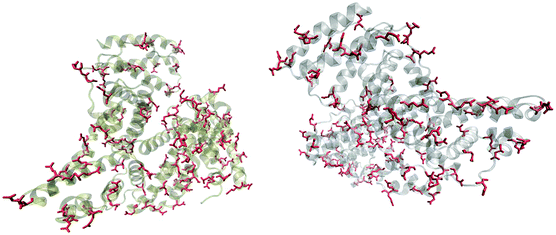 | ||
| Fig. 5 Distribution of acidic residues in BSA (left) and HSA (right), based on ref. 36 and 37, respectively. Protein data were visualized by VMD.45 | ||
Considering an interaction with the citrate ions, a deprotonated –COO− group would be repelled electrostatically from them, as they also carry negative charges. This would result in an overall lower affinity of BSA than that of HSA in case the interaction would take place with the citrate layer via –COOH groups on the surface. The symmetric COO− stretching vibration in the spectrum of HSA at 1406 cm−1 (compare Fig. 3) indicates that the –COOH groups in the protein must be deprotonated, thus the attractive electrostatic interaction between the –COO− and the negatively charged citrate layer can be precluded based on the SERS spectra. Since the acidity constants of the aspartic acid and glutamic acid side chains (2.23 × 10⁻⁴ and 5.62 × 10⁻⁵, respectively51) are close to the first and second acidity constants of citrate ions (7.08 × 10⁻⁴ and 1.70 × 10⁻⁵, respectively52), a dynamic protonation–deprotonation equilibrium can be established between the aspartic acid and glutamic acid side chains and the citrate ions of any degree of deprotonation. A fully protonated citric acid can re-protonate the deprotonated aspartic acid or glutamic acid side chain. As a consequence, –COO− groups can be in the proximity of the citrate layer, as is indicated in the spectra in the form of a signal of the symmetric –COO− stretching vibration.
The data also provide indication of a direct adsorption of the protein molecules to the nanoparticle surface as a consequence of the exchange of the citrate ligand molecules by the protein molecules. The direct adsorption of protein molecules on the positively charged surface of gold nanoparticles requires negatively charged residues, namely the deprotonated –COO− groups that are observed in the spectra of HSA. Furthermore, steric restrictions are implied by the protein secondary structure. Specifically, more flexible random coil structures would be energetically favored over very much defined α-helices, since flexible segments are distorted easier, allowing for the most preferred orientation of side chains involved in specific residue-nanoparticle interactions.53 In order to achieve the energetically most preferred site for adsorption, we expect amino acids inside a random coil sequence to preferentially interact with the nanoparticle surface. In BSA, no acidic side chain was found in a completely random-coiled structure, without having neighbors with basic residues that could be repelled by the net positive surface charge.36,45 In contrast, in HSA two such segments can be identified: …-Val293-Glu294-Asn295-Asp296-Glu297-Met298-… and …-Leu491-Glu492-Val493-…, both of which contain acidic residues. The flexibility of the segments was verified by modeling of protein structure flexibility, calculating the root-mean square fluctuations of the residues by CABS-flex 2.054 for the entire HSA chain, which suggests that the identified segments are indeed not rigid (Fig. S4†). As Fig. 4 indicates, the bands at 1070 cm−1, 1170 cm−1, and 1406 cm−1 are present together in several spectra, in about half of the spectra displaying the 1406 cm−1 band. In accord with this, the …-Val293-Glu294-Asn295-Asp296-Glu297-Met298-… segment contains three free –COOH groups, which are expected to adsorb on the positively charged surface of gold nanoparticles in the deprotonated form. The Asn295 residue between the Glu294 and Asp296, carries an amide functional group, which can contribute to both the 1070 cm−1 and the 1170 cm−1 signal as well. The simultaneous appearance of these three bands in one spectrum (see e.g., Fig. 2, top spectrum) suggests the interaction of the …-Val293-Glu294-Asn295-Asp296-Glu297-Met298-… segment with the surface of the nanoparticles. The …-Leu491-Glu492-Val493-… segment, where Glu492 has neighbors with only CHx (with x of 1, 2 or 3) groups can only contribute to the 1406 cm−1 band, therefore the sole appearance of this band can be explained by the adsorption of this segment, when considering the direct interaction with the nanoparticle surface.
Conclusions
In this study, we elucidated the interaction of the two very similar proteins, BSA and HSA, with gold nanoparticles. This was achieved by utilizing the high sensitivity and localized probing by SERS. Even though the high sequence overlap of the two molecules suggests their very similar interaction with the citrate-stabilized gold nanoparticles, very distinct SERS spectra were found. The discussion of the SERS data before the background of possible binding interactions suggests that electrostatic binding of the proteins to the citrate layer without ligand exchange is possible both for BSA and HSA via lysine residues, supporting data obtained by other methods.12,18,30,31,44 However, different from BSA, a portion of the HSA spectra clearly indicates direct binding of this protein to the nanoparticle surface via the …-Val293-Glu294-Asn295-Asp296-Glu297-Met298-… and …-Leu491-Glu492-Val493-… segments that were identified in the known protein primary structure, which results in the exchange of citrate ions. In addition to this particular structural information, the results indicate that in single protein systems the high selectivity and sensitivity of SERS is very beneficial for obtaining vibrational information, and the differentiation between two nearly identical proteins is possible. This further underpins the important role of surface-enhanced optical spectroscopies in the characterization of nano-bio-interactions and for future probing of the biomolecular corona in situ and in vivo.Conflicts of interest
There are no conflicts to declare.Acknowledgements
We thank Vesna Zivanovic (HU Berlin) and Sören Selve (ZELMI, TU Berlin) for the TEM micrographs. Funding by DFG GSC 2013 School of Analytical Sciences Adlershof (SALSA) is gratefully acknowledged. J. K. acknowledges funding by ERC grant No. 259432 MULTBIOPHOT.References
- S. C. Baetke, T. Lammers and F. Kiessling, Br. J. Radiol., 2015, 88, 20150207 CrossRef CAS PubMed.
- P. Aggarwal, J. B. Hall, C. B. McLeland, M. A. Dobrovolskaia and S. E. McNeil, Adv. Drug Delivery Rev., 2009, 61, 428–437 CrossRef CAS PubMed.
- E. L. L. Yeo, P. S. P. Thong, K. C. Soo and J. C. Y. Kah, Nanoscale, 2018, 10, 2461–2472 RSC.
- D. Pissuwan, S. M. Valenzuela and M. B. Cortie, Trends Biotechnol., 2006, 24, 62–67 CrossRef CAS PubMed.
- P. Baptista, E. Pereira, P. Eaton, G. Doria, A. Miranda, I. Gomes, P. Quaresma and R. Franco, Anal. Bioanal. Chem., 2008, 391, 943–950 CrossRef CAS PubMed.
- C. D. Walkey, J. B. Olsen, H. Guo, A. Emili and W. C. Chan, J. Am. Chem. Soc., 2012, 134, 2139–2147 CrossRef CAS PubMed.
- T. Cedervall, I. Lynch, S. Lindman, T. Berggard, E. Thulin, H. Nilsson, K. A. Dawson and S. Linse, Proc. Natl. Acad. Sci. U. S. A., 2007, 104, 2050–2055 CrossRef CAS PubMed.
- S. Reymond-Laruinaz, L. Saviot, V. Potin and M. d. C. Marco de Lucas, Appl. Surf. Sci., 2016, 389, 17–24 CrossRef CAS.
- C. D. Walkey and W. C. Chan, Chem. Soc. Rev., 2012, 41, 2780–2799 RSC.
- L. Vroman, A. L. Adams, G. C. Fischer and P. C. Munoz, Blood, 1980, 55, 156–159 CAS.
- S. B. Gunnarsson, K. Bernfur, A. Mikkelsen and T. Cedervall, Nanoscale, 2018, 10, 4246–4257 RSC.
- A. Wang, Y. R. Perera, M. B. Davidson and N. C. Fitzkee, J. Phys. Chem. C, 2016, 120, 24231–24239 CrossRef CAS PubMed.
- M. Moskovits, J. Chem. Phys., 1978, 69, 4159–4161 CrossRef CAS.
- K. Kneipp, H. Kneipp and J. Kneipp, Acc. Chem. Res., 2006, 39, 443–450 CrossRef CAS PubMed.
- D. Drescher, P. Guttmann, T. Buchner, S. Werner, G. Laube, A. Hornemann, B. Tarek, G. Schneider and J. Kneipp, Nanoscale, 2013, 5, 9193–9198 RSC.
- M. Iosin, F. Toderas, P. L. Baldeck and S. Astilean, J. Mol. Struct., 2009, 924–926, 196–200 CrossRef CAS.
- G. Das, F. Mecarini, F. Gentile, F. De Angelis, H. Mohan Kumar, P. Candeloro, C. Liberale, G. Cuda and E. Di Fabrizio, Biosens. Bioelectron., 2009, 24, 1693–1699 CrossRef CAS PubMed.
- T. Brulé, A. Bouhelier, A. Dereux and E. Finot, ACS Sens., 2016, 1, 676–680 CrossRef.
- X. X. Han, G. G. Huang, B. Zhao and Y. Ozaki, Anal. Chem., 2009, 81, 3329–3333 CrossRef CAS PubMed.
- B. Fazio, C. D'Andrea, A. Foti, E. Messina, A. Irrera, M. G. Donato, V. Villari, N. Micali, O. M. Marago and P. G. Gucciardi, Sci. Rep., 2016, 6, 26952 CrossRef CAS PubMed.
- E. E. Connor, J. Mwamuka, A. Gole, C. J. Murphy and M. D. Wyatt, Small, 2005, 1, 325–327 CrossRef CAS PubMed.
- M. Thomas and A. M. Klibanov, Proc. Natl. Acad. Sci. U. S. A., 2003, 100, 9138–9143 CrossRef CAS PubMed.
- J. Kneipp, H. Kneipp, M. McLaughlin, D. Brown and K. Kneipp, Nano Lett., 2006, 6, 2225–2231 CrossRef CAS PubMed.
- D. Drescher, H. Traub, T. Buchner, N. Jakubowski and J. Kneipp, Nanoscale, 2017, 9, 11647–11656 RSC.
- R. F. Aroca, R. A. Alvarez-Puebla, N. Pieczonka, S. Sanchez-Cortez and J. V. Garcia-Ramos, Adv. Colloid Interface Sci., 2005, 116, 45–61 CrossRef CAS PubMed.
- Ö. F. Karataş, E. Sezgin, Ö. Aydın and M. Çulha, Colloids Surf., B, 2009, 71, 315–318 CrossRef PubMed.
- E. López-Tobar, B. Hernández, A. Chenal, Y.-M. Coïc, J. Gómez Santos, E. Mejía-Ospino, J. V. Garcia-Ramos, M. Ghomi and S. Sanchez-Cortes, J. Raman Spectrosc., 2017, 48, 30–37 CrossRef.
- A. M. Michaels, M. Nirmal and L. E. Brus, J. Am. Chem. Soc., 1999, 121, 9932–9939 CrossRef CAS.
- F. Madzharova, Z. Heiner and J. Kneipp, J. Phys. Chem. C, 2017, 121, 1235–1242 CrossRef CAS.
- S. H. Brewer, W. R. Glomm, M. C. Johnson, M. K. Knag and S. Franzen, Langmuir, 2005, 21, 9303–9307 CrossRef CAS PubMed.
- S. Dominguez-Medina, S. McDonough, P. Swanglap, C. F. Landes and S. Link, Langmuir, 2012, 28, 9131–9139 CrossRef CAS PubMed.
- D. H. Tsai, F. W. DelRio, A. M. Keene, K. M. Tyner, R. I. MacCuspie, T. J. Cho, M. R. Zachariah and V. A. Hackley, Langmuir, 2011, 27, 2464–2477 CrossRef CAS PubMed.
- P. C. Lee and D. Meisel, J. Phys. Chem., 1982, 86, 3391–3395 CrossRef CAS.
- E. Gasteiger, Nucleic Acids Res., 2003, 31, 3784–3788 CrossRef CAS PubMed.
- P. H. C. Eilers, Anal. Chem., 2003, 75, 3631–3636 CrossRef CAS PubMed.
- A. Bujacz, K. Zielinski and B. Sekula, Proteins, 2014, 82, 2199–2208 CrossRef CAS PubMed.
- B. Sekula, A. Ciesielska, P. Rytczak, M. Koziolkiewicz and A. Bujacz, Biosci. Rep., 2016, 36, e00338 CrossRef CAS PubMed.
- C. Blum, T. Schmid, L. Opilik, S. Weidmann, S. R. Fagerer and R. Zenobi, J. Raman Spectrosc., 2012, 43, 1895–1904 CrossRef CAS.
- J. Kneipp, H. Kneipp, B. Wittig and K. Kneipp, Nanomedicine, 2010, 6, 214–226 CrossRef CAS PubMed.
- V. J. Lin and J. L. Koenig, Biopolymers, 1976, 15, 203–218 CrossRef CAS PubMed.
- A. Rygula, K. Majzner, K. M. Marzec, A. Kaczor, M. Pilarczyk and M. Baranska, J. Raman Spectrosc., 2013, 44, 1061–1076 CrossRef CAS.
- T. Watanabe and H. Maeda, J. Phys. Chem., 1989, 93, 3258–3260 CrossRef CAS.
- A. Hornemann, D. Drescher, S. Flemig and J. Kneipp, Anal. Bioanal. Chem., 2013, 405, 6209–6222 CrossRef CAS PubMed.
- X. Shi, D. Li, J. Xie, S. Wang, Z. Wu and H. Chen, Chin. Sci. Bull., 2012, 57, 1109–1115 CrossRef CAS.
- W. Humphrey, A. Dalke and K. Schulten, J. Mol. Graphics, 1996, 14, 33–38 CrossRef CAS PubMed , 27–38.
- A. I. Ivanov, R. G. Zhbankov, E. A. Korolenko, E. V. Korolik, L. A. Meleshchenko, M. Marchewka and H. Ratajczak, J. Appl. Spectrosc., 1994, 60, 305–309 Search PubMed.
- N. C. Dingari, G. L. Horowitz, J. W. Kang, R. R. Dasari and I. Barman, PLoS One, 2012, 7, e32406 CrossRef CAS PubMed.
- H. Al-Johani, E. Abou-Hamad, A. Jedidi, C. M. Widdifield, J. Viger-Gravel, S. S. Sangaru, D. Gajan, D. H. Anjum, S. Ould-Chikh, M. N. Hedhili, A. Gurinov, M. J. Kelly, M. El Eter, L. Cavallo, L. Emsley and J. M. Basset, Nat. Chem., 2017, 9, 890–895 CrossRef CAS PubMed.
- S. K. Kim, M. S. Kim and S. W. Suh, J. Raman Spectrosc., 1987, 18, 171–175 CrossRef CAS.
- F. Y. Oliva, L. B. Avalle, O. R. Cámara and C. P. De Pauli, J. Colloid Interface Sci., 2003, 261, 299–311 CrossRef CAS PubMed.
- pK and pl values of amino acids, 2018, https://www.anaspec.com/html/pK_n_pl_Values_of_AminoAcids.html.
- Dissociation constants of organic acids and bases, 2018, http://www.zirchrom.com/organic.htm.
- N. C. Fitzkee and G. D. Rose, Proc. Natl. Acad. Sci. U. S. A., 2004, 101, 12497–12502 CrossRef CAS PubMed.
- A. Kuriata, A. M. Gierut, T. Oleniecki, M. P. Ciemny, A. Kolinski, M. Kurcinski and S. Kmiecik, Nucleic Acids Res., 2018, 46, W338–W343 CrossRef PubMed.
- D. Drescher, T. Buchner, D. McNaughton and J. Kneipp, Phys. Chem. Chem. Phys., 2013, 15, 5364–5373 RSC.
- W. L. Peticolas, Methods Enzymol., 1995, 246, 389–416 CAS.
- K. Czamara, K. Majzner, M. Z. Pacia, K. Kochan, A. Kaczor and M. Baranska, J. Raman Spectrosc., 2015, 46, 4–20 CrossRef CAS.
- F. Madzharova, Z. Heiner, M. Guhlke and J. Kneipp, J. Phys. Chem. C, 2016, 120, 15415–15423 CrossRef CAS PubMed.
Footnote |
| † Electronic supplementary information (ESI) available. See DOI: 10.1039/c8an01321g |
| This journal is © The Royal Society of Chemistry 2018 |

