 Open Access Article
Creative Commons Attribution 3.0 Unported Licence
High-pressure synthesis, crystal structure and photoluminescence properties of a new terbium silicate: Na2Tb1.08Ca2.92Si6O18H0.8†
Xinjian Baoabc,
Xiaoyang Liu c and
Xi Liu
 *ab
*ab
aKey Laboratory of Orogenic Belts and Crustal Evolution, MOE, Peking University, Beijing 100871, China. E-mail: xi.liu@pku.edu.cn; Fax: +86-10-6275-2996; Tel: +86-10-6275-3585
bSchool of Earth and Space Sciences, Peking University, Beijing 100871, China
cState Key Laboratory of Inorganic Synthesis and Preparative Chemistry, College of Chemistry, Jilin University, Changchun 130012, China
First published on 27th October 2017
Abstract
The crystal properties of a terbium silicate Na2Tb1.08Ca2.92Si6O18H0.8 synthesized at 1 GPa and 800 °C using a piston-cylinder apparatus is reported. Our single-crystal X-ray analysis shows that this new compound is triclinic with the space group ![[P with combining macron]](https://www.rsc.org/images/entities/i_char_0050_0304.gif) 1 (Z = 1), and its unit-cell parameters are a = 7.056(3) Å, b = 7.075(3) Å, c = 8.029(3) Å, α = 102.381(5)°, β = 95.387(6)°, γ = 90.552(6)°, and V = 389.6(2) Å3. This structure consists of octahedral double chains of the compositions [Ca0.875Tb0.125O6] and [Ca0.585Tb0.415O6]. The double chains are linked by tetrasilicate chains via vertex oxygen atoms to form a 3D framework with 6-membered (2 octahedra and 4 tetrahedra) ring channels along the b-axis where the Na+ cations locate. The luminescence properties of the Na2Tb1.08Ca2.92Si6O18H0.8 phase are also investigated. This phase, with most of its Tb in 3+, emits mainly from one transition, 5D4 → 7F5 (542 and 552 nm). The room temperature fluorescence decay curves are fit well by an exponential function, yielding a lifetime value of about 2.498(7) ms.
1 (Z = 1), and its unit-cell parameters are a = 7.056(3) Å, b = 7.075(3) Å, c = 8.029(3) Å, α = 102.381(5)°, β = 95.387(6)°, γ = 90.552(6)°, and V = 389.6(2) Å3. This structure consists of octahedral double chains of the compositions [Ca0.875Tb0.125O6] and [Ca0.585Tb0.415O6]. The double chains are linked by tetrasilicate chains via vertex oxygen atoms to form a 3D framework with 6-membered (2 octahedra and 4 tetrahedra) ring channels along the b-axis where the Na+ cations locate. The luminescence properties of the Na2Tb1.08Ca2.92Si6O18H0.8 phase are also investigated. This phase, with most of its Tb in 3+, emits mainly from one transition, 5D4 → 7F5 (542 and 552 nm). The room temperature fluorescence decay curves are fit well by an exponential function, yielding a lifetime value of about 2.498(7) ms.
1. Introduction
Microporous lanthanide-containing silicates constitute a novel family of zeotype materials made of interlinked octahedra and tetrahedra. Many studies have focused on the synthesis of this group of compounds for their versatility in terms of chemical compositions, framework topologies and ion-exchange properties, as well as their interesting physical and chemical properties.1–5 Due to their high thermal stability and tunable optical properties, the lanthanide-containing silicates attract much interest as candidates of optical materials.6–8 In 1997, Rocha et al. reported a microporous sodium yttrium silicate Na4K2Y2Si16O38·10H2O.9 Since then a series of microporous lanthanide silicates have been successfully prepared. Recently, many studies have focused on the possibility to obtain phosphors with emission across the entire visible range by selection of lanthanide ions.10–13High-pressure (HP) experimental techniques have been usually employed in synthesizing the lanthanide-containing silicates in recent decades. As a few examples, Huang et al. documented the HP synthesis of a new europium silicate Cs3EuSi6O15, which consists of loop-branched vierer double chains of silicate with four-, six-, and eight-membered rings;3 Zhao et al. reported the HP synthesis of three new lanthanide silicates based on anionic silicate chain, layer, and framework.14 Liu's group synthesized a number of lanthanide-containing silicates under HP conditions and reported their structural features.15–18
In this work a new terbium silicate, Na2Tb1.08Ca2.92Si6O18H0.8, was synthesized at HP condition using a piston-cylinder apparatus. The crystallographic details of this phase were obtained by performing single-crystal X-ray diffraction analysis, and the luminescence properties were systematically investigated using a range of analytical techniques as well.
2. Experiment
2.1. Synthesis
The starting material was made as following: pure chemicals NaOH·H2O (Alfa Aesar, powder, 99.9%), TbCl3·6H2O (Alfa Aesar, powder, 99.9%), CaCO3 (Alfa Aesar, powder, 99.9%) and SiO2 (Alfa Aesar, powder, 99.9%) were weighed without any pretreatment, ground and homogenized in an agate mortar. This mixture was subsequently stored in a drying oven at 110 °C for later synthesizing experiment. The molar ratio of these chemicals in the starting material was ideally NaOH·H2O![[thin space (1/6-em)]](https://www.rsc.org/images/entities/char_2009.gif) :
:![[thin space (1/6-em)]](https://www.rsc.org/images/entities/char_2009.gif) TbCl3·6H2O
TbCl3·6H2O![[thin space (1/6-em)]](https://www.rsc.org/images/entities/char_2009.gif) :
:![[thin space (1/6-em)]](https://www.rsc.org/images/entities/char_2009.gif) CaCO3
CaCO3![[thin space (1/6-em)]](https://www.rsc.org/images/entities/char_2009.gif) :
:![[thin space (1/6-em)]](https://www.rsc.org/images/entities/char_2009.gif) SiO2 = 2
SiO2 = 2![[thin space (1/6-em)]](https://www.rsc.org/images/entities/char_2009.gif) :
:![[thin space (1/6-em)]](https://www.rsc.org/images/entities/char_2009.gif) 1
1![[thin space (1/6-em)]](https://www.rsc.org/images/entities/char_2009.gif) :
:![[thin space (1/6-em)]](https://www.rsc.org/images/entities/char_2009.gif) 3
3![[thin space (1/6-em)]](https://www.rsc.org/images/entities/char_2009.gif) :
:![[thin space (1/6-em)]](https://www.rsc.org/images/entities/char_2009.gif) 6, leading to ∼11.9 wt% CO2 and 11.32 wt% H2O in the bulk composition. The starting material was loaded into a Pt capsule, which was sealed at both ends using an arc-welding technique. Our synthesizing experiment was carried out with a piston-cylinder apparatus (Depths of The Earth Company Quickpress19,20). The experimental assembly and high-P experimental technique were generally identical to those reported in.21 Our sample was synthesized at 1 GPa and 800 °C with a heating time of 24 hours. After the reaction, the sample was quickly cooled down to room temperature by switching off the electrical power supply. Some parts of the resulting sample were first crushed, then treated with diluted HCl to remove any possible residues of carbonate and hydrate, and finally washed with deionized water for further test.
6, leading to ∼11.9 wt% CO2 and 11.32 wt% H2O in the bulk composition. The starting material was loaded into a Pt capsule, which was sealed at both ends using an arc-welding technique. Our synthesizing experiment was carried out with a piston-cylinder apparatus (Depths of The Earth Company Quickpress19,20). The experimental assembly and high-P experimental technique were generally identical to those reported in.21 Our sample was synthesized at 1 GPa and 800 °C with a heating time of 24 hours. After the reaction, the sample was quickly cooled down to room temperature by switching off the electrical power supply. Some parts of the resulting sample were first crushed, then treated with diluted HCl to remove any possible residues of carbonate and hydrate, and finally washed with deionized water for further test.
2.2. Characterizations
Powder X-ray diffraction (XRD) data were collected using a Rigaku D/Max 2550 V/PC X-ray diffractometer with graphite-monochromated Cu Kα radiation (λ = 0.15418 nm) at 50 kV and 200 mA at room temperature. Energy-dispersive spectroscopy (EDS) analysis was carried out using an EDS system attached to a JEOL JXA-8100 electron microprobe. The instrument was calibrated using a series of standards from Structure Probe, Inc. XPS valence band spectra were obtained with an ESCA LAB 250 photoelectron spectrometer. IR spectrum was recorded on a Nicolet Impact 410 FT-IR spectrometer using the KBr pellet technique. Thermogravimetric analysis (TG) was carried out on a Perkin-Elmer TGA unit in air with a heating rate of 10 °C min−1. Photoluminescence (PL) spectra were obtained on a F7000 (Hitachi) spectrophotometer with Xe 900 (150 W xenon arc lamp) as the light source. PL decay curves were measured on an FLS980 spectrophotometer (Edinburgh Instruments) with an mF90H flash lamp as the light source. To eliminate the second-order emission from the source radiation, a cut-off filter was used during the measurement. Slit widths were 0.20 (excitation) and 0.20 (emission) nm. All spectra were recorded at room temperature.2.3. Single-crystal X-ray diffraction
Suitable single crystal was selected for single-crystal X-ray diffraction analysis. Intensity data was collected on a Bruker Smart ApexII Quazar micro-focused diffractometer using Mo Kα radiation (λ = 0.71073 nm). The raw data was processed and corrected for the absorption effects using SAINT+ and SADAB. An initial structure solution was obtained via direct methods and refined by a full-matrix least-squares method using the SHELXT software included in the SHELXTL package. All heavy atoms (Na, Tb, Ca, and Si) were first located unambiguously in the Fourier maps, and then the O atoms were found in the subsequent difference maps. All atoms were refined with anisotropic displacement parameters. The final cycles of the least-squares refinement including atomic coordinates and anisotropic thermal parameters for the atoms [I > 2sigma(I)] converged at R1 = 0.0502, wR2 = 0.1186, and S = 1.015 for this new terbium silicate compound.3. Results and discussion
3.1. Phases in synthetic material
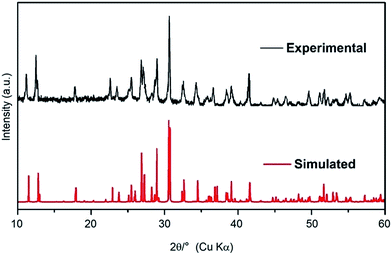
The SEM backscatter image shown in Fig. S1† indicates that there is just one crystalline phase in our synthetic product, in good agreement with our powder XRD data. The powder XRD pattern of the experimental product is shown in Fig. 1; since it is completely consistent with the simulated XRD pattern based on our single-crystal structure data (to be reported in the next Section), one crystalline phase in the experimental product is the only possible explanation. In addition, Fig. S1† reveals significant amount of holes and cracks in the sample, suggesting the role of a C–H–O fluid phase in our experiment; note that there was ∼23.22 wt% CO2 and H2O in the starting material. Ten EDS analyses performed on arbitrarily selected areas of the experimental product suggest a cation ration of Na![[thin space (1/6-em)]](https://www.rsc.org/images/entities/char_2009.gif) :
:![[thin space (1/6-em)]](https://www.rsc.org/images/entities/char_2009.gif) Tb
Tb![[thin space (1/6-em)]](https://www.rsc.org/images/entities/char_2009.gif) :
:![[thin space (1/6-em)]](https://www.rsc.org/images/entities/char_2009.gif) Ca
Ca![[thin space (1/6-em)]](https://www.rsc.org/images/entities/char_2009.gif) :
:![[thin space (1/6-em)]](https://www.rsc.org/images/entities/char_2009.gif) Si = 2
Si = 2![[thin space (1/6-em)]](https://www.rsc.org/images/entities/char_2009.gif) :
:![[thin space (1/6-em)]](https://www.rsc.org/images/entities/char_2009.gif) 1.08
1.08![[thin space (1/6-em)]](https://www.rsc.org/images/entities/char_2009.gif) :
:![[thin space (1/6-em)]](https://www.rsc.org/images/entities/char_2009.gif) 2.92
2.92![[thin space (1/6-em)]](https://www.rsc.org/images/entities/char_2009.gif) :
:![[thin space (1/6-em)]](https://www.rsc.org/images/entities/char_2009.gif) 6, slightly different from the original and ideal cation ration of Na
6, slightly different from the original and ideal cation ration of Na![[thin space (1/6-em)]](https://www.rsc.org/images/entities/char_2009.gif) :
:![[thin space (1/6-em)]](https://www.rsc.org/images/entities/char_2009.gif) Tb
Tb![[thin space (1/6-em)]](https://www.rsc.org/images/entities/char_2009.gif) :
:![[thin space (1/6-em)]](https://www.rsc.org/images/entities/char_2009.gif) Ca
Ca![[thin space (1/6-em)]](https://www.rsc.org/images/entities/char_2009.gif) :
:![[thin space (1/6-em)]](https://www.rsc.org/images/entities/char_2009.gif) Si = 2
Si = 2![[thin space (1/6-em)]](https://www.rsc.org/images/entities/char_2009.gif) :
:![[thin space (1/6-em)]](https://www.rsc.org/images/entities/char_2009.gif) 1
1![[thin space (1/6-em)]](https://www.rsc.org/images/entities/char_2009.gif) :
:![[thin space (1/6-em)]](https://www.rsc.org/images/entities/char_2009.gif) 3
3![[thin space (1/6-em)]](https://www.rsc.org/images/entities/char_2009.gif) :
:![[thin space (1/6-em)]](https://www.rsc.org/images/entities/char_2009.gif) 6 in the bulk composition. This compositional difference partially reflects a possible drawback of using untreated chemicals to prepare the starting material, and partially implies that the C–H–O fluid was not pure, but dissolved some Na, Ca and Si.
6 in the bulk composition. This compositional difference partially reflects a possible drawback of using untreated chemicals to prepare the starting material, and partially implies that the C–H–O fluid was not pure, but dissolved some Na, Ca and Si.
Combined with the single-crystal structure data, XPS data, FT-IR data and TG data reported below, the composition of this crystalline phase has been approximated by the chemical formula of Na2Tb1.08Ca2.92Si6O18H0.8.
3.2. Single-crystal structure
The single-crystal analysis of the Na2Tb1.08Ca2.92Si6O18H0.8 silicate reveals that it crystallizes in the![[P with combining macron]](https://www.rsc.org/images/entities/i_char_0050_0304.gif) 1 space group (Z = 1), with a = 7.056(3) Å, b = 7.075(3) Å, c = 8.029(3) Å, α = 102.381(5)°, β = 95.387(6)°, γ = 90.552(6)°, and V = 389.6(2) Å3 (Table 1). Each asymmetric unit of this new terbium silicate compound contains one distinct Na site, two distinct Ca(Tb) sites (denoted as M1 and M2), three distinct Si site and nine distinct O sites (Fig. S2†), with their coordinates and equivalent isotropic displacement parameters being listed in Table S1.†
1 space group (Z = 1), with a = 7.056(3) Å, b = 7.075(3) Å, c = 8.029(3) Å, α = 102.381(5)°, β = 95.387(6)°, γ = 90.552(6)°, and V = 389.6(2) Å3 (Table 1). Each asymmetric unit of this new terbium silicate compound contains one distinct Na site, two distinct Ca(Tb) sites (denoted as M1 and M2), three distinct Si site and nine distinct O sites (Fig. S2†), with their coordinates and equivalent isotropic displacement parameters being listed in Table S1.†
| Empirical formula | Na2Tb1.08Ca2.92Si6O18H0.8 | |
| Formula weight | 792.01 | |
| Temperature | 296(2) K | |
| Wavelength | 0.71073 Å | |
| Crystal system, space group | Triclinic, ![[P with combining macron]](https://www.rsc.org/images/entities/i_char_0050_0304.gif) 1 1 |
|
| Unit cell dimensions | a = 7.056(3) Å | α = 102.381(5)° |
| b = 7.075(3) Å | β = 95.387(6)° | |
| c = 8.029(3) Å | γ = 90.552(6)° | |
| Volume | 389.6(2) Å3 | |
| Z | 1 | |
| Crystal size | 0.1 × 0.08 × 0.08 mm | |
| Theta range for data collection | 2.61–25.34° | |
| Limiting indices | −3 ≤ h ≤ 8, −8 ≤ k ≤ 8, −9 ≤ l ≤ 9 | |
| Reflections collected/unique | 2059/1416 [R(int) = 0.0109] | |
| Completeness to theta = 25.10 | 99.20% | |
| Refinement method | Full-matrix least-squares on F2 | |
| Data/restraints/parameters | 1416/1/141 | |
| Goodness-of-fit on F2 | 1.015 | |
| Final R indices [I > 2sigma(I)] | R1 = 0.0502, wR2 = 0.1186 | |
| R Indices (all data) | R1 = 0.0506, wR2 = 0.1188 | |
| Largest diff. Peak and hole | 0.898 and −0.978e Å−3 | |
This novel Na2Tb1.08Ca2.92Si6O18H0.8 compound has a 3D-framework structure (Fig. 2). Two distinct [MO6] octahedra form edge-sharing double chains running along the b-axis. The [SiO4] tetrahedron in the crystal structure is linked to two adjacent [SiO4] tetrahedra, these three symmetrically independent [SiO4] tetrahedra form a C-shaped cluster, and neighboring C-shaped clusters are linked via sharing O atoms to form a zigzag chain along the b-axis. The tetrahedral chain is linked to the double chains of the [MO6] through corner-sharing. The stacking pattern along with the linkages between the layers of tetrahedra and octahedra gives rise to an I-beam topology where bands of the octahedra are linked to overlying and underlying silicate chains through the apical O atoms in the [SiO4] tetrahedra. The resulting framework contains 4-membered and 6-membered ring channels along the b-axis, where the H and Na cations locate, respectively.
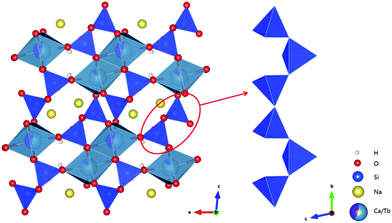 | ||
| Fig. 2 Polyhedral view of the Na2Tb1.08Ca2.92Si6O18H0.8 compound along the b-axis and [SiO4] tetrahedra single chain. | ||
The Ca and Tb atoms are disordered over the M1 and M2 sites with different occupancies. In the M1 and M2 sites, the Ca occupancies are 0.875 and 0.585, respectively. The corresponding structural formula is thus Na2(Tb0.25Ca1.75) (Tb0.83Ca1.17)Si6O18H0.8. As shown in Fig. 2 and Table S2,† all the M sites are coordinated to six bridging O atoms to form [MO6] octahedra. For the M1O6, the lengths of the six M1–O bands lie between 2.295(8) to 2.491(8) Å while the O–M1–O angles from 79.4(3) to 167.9(3)°. For the M2O6, the M2–O band lengths are in the range from 2.281(7) to 2.474(8) Å while the O–M2–O angles from 80.8(3) to 176.6(3)°. The Tb atoms on these two sites have mixed valences, with the Tb3+ dominant: the XPS spectrum (Fig. S3†) shows two main peaks at ∼148.11 and 150.27 eV, which are attributed to the Tb3+ and Tb4+, respectively; the ratio of Tb4+![[thin space (1/6-em)]](https://www.rsc.org/images/entities/char_2009.gif) :
:![[thin space (1/6-em)]](https://www.rsc.org/images/entities/char_2009.gif) Tb has been calculated as ∼0.194 by performing peak-area analysis.22 On the basis of charge balance, furthermore, the XPS data imply ∼0.7 H in the unit cell of the crystal structure.
Tb has been calculated as ∼0.194 by performing peak-area analysis.22 On the basis of charge balance, furthermore, the XPS data imply ∼0.7 H in the unit cell of the crystal structure.
The Si atoms are all in 4-fold coordination, and form [SiO4] tetrahedra. The Si–O lengths vary from 1.601(8) to 1.645(7) Å for the Si1–O bonds, from 1.577(8) to 1.647(7) Å for the Si2–O bonds, and from 1.593(7) to 1.666(7) Å for the Si3–O bonds. The O–Si–O angles are shown in Table S2.†
The hydrogen site (H1–O1) has been confirmed by the electron density difference following the ref. 23,24. The hydrogen bond length was fixed as 0.84 Å during the refinement. In addition, the existence of the O–H bond has been confirmed by our IR analysis (Fig. S4†): the peaks at ∼3500 cm−1 in the IR spectrum can be assigned to the O–H stretching bands. Further, the existence of the OH group in our new terbium silicate compound has been confirmed by the thermogravimetric analysis. As shown in Fig. S5,† the TG curve of the compound revealed a weight loss of ∼1 wt% in the temperature range of ∼300–650 °C. At temperatures higher than 650 °C, no significant weight loss occurred, indicating that the sample was almost anhydrous at relatively high temperatures. The TG data thus suggests approximately 0.88 H in the unit cell of this compound, a result in excellent agreement with that required by the XPS and EDS data if the experimental uncertainty in the TG analysis is taken into account.
With the knowledge of the cation–anion distances from Shannon,25 the Na cation is coordinated to six O atoms with the Na–O bond lengths ranging from 2.295(8) to 2.502(8) Å. There are two more O atoms, with the distances of 2.967(9) and 2.991(9) Å, surrounding the Na atom as well.
Table S3† presents the calculated bond valence sums (BVSs).26,27 The BVSs for the Si4+ cations are in good accordance with their theoretical values of 4.0 v.u. The total valences of the M cations are 9.2 v.u. depending on the formula, and the BVSs for the M cations are 9.376 v.u. which deviates slightly from the theoretical value by 1.02%. All O atoms show BVSs more or less close to their ideal values of 2.0 v.u. The relatively low values for O1 (1.512 v.u.) and O7 (1.618 v.u.) are explained by their connection to the H+ cation. Taking into account the Tb occupation and BVSs of the M cations, the compositions of the cations on the M1 and M2 sites are tentatively determined as Ca2+0.875Tb4+0.125 and Ca2+0.585Tb3+0.415, respectively. With the cation radius data from Shannon,25 the average cation radii of the M1 and M2 sites are calculated as 0.970 and 0.968 Å, respectively. It means that the coordination environments of the M1 and M2 sites are generally similar.
3.3. Photoluminescent studies
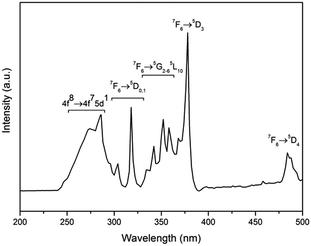
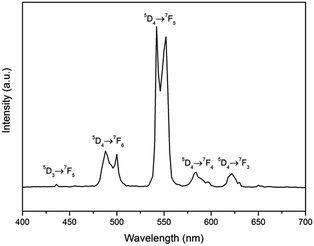
Fig. 3 shows the room temperature excitation spectra of the Na2Tb1.08Ca2.92Si6O18H0.8 phase, monitored within the Tb3+ 5D4 → 7F5 transition (542 nm). In the excitation spectrum, the sharp lines between 320 and 500 nm are assigned as the intraconfigurational 4f8 transitions of the Tb3+ between the 7F6 ground state and the 5D0,1, 5G2–6, 5L10, and 5D3,4 excited levels. On the other hand, the broad feature between ∼240 and 320 nm may be contributed by both the spin-forbidden and spin-allowed interconfigurational 4f8 → 4f75d1 (f–d) transitions of the Tb3+;28,29 specifically, the bands at ∼275 nm can be assigned to the spin-allowed 7D levels of the 4f8 → 4f75d transition while the bands at ∼300 nm can be assigned to the spin-forbidden 9D levels of the 4f8 → 4f75d transition of the Tb3+ ions.Fig. 4 shows the RT emission spectrum of the Na2Tb1.08Ca2.92Si6O18H0.8 phase. The emission spectrum excited at 378 nm (Tb3+ 5D3) displays a series of sharp lines from 475 to 675 nm, which are associated with the 5D4 → 7F3–6 transitions of the Tb3+, with the strongest at about 542 and 552 nm (5D4 → 7F5). No apparent emission from the Tb4+ ion is expected in this range due to the charge transfer.30 Luminescence from any higher excited states (e.g., 5D3) is very weak. The peak at 436 nm is assigned to the transition 5D3 → 7F5. Other potential emissions with origins from the 5D3 to 7Fj transitions of the Tb3+ ions are not detected due to the cross-relaxation effect.31
The RT fluorescence decay curve of the 5D4 → 7F5 transitions (542 nm) for the Na2Tb1.08Ca2.92Si6O18H0.8 phase (Fig. 5) is well fitted by the single exponential function, yielding the lifetime value of τ = 2.498(7) ms, which is in good agreement with the reported value for the Tb3+ emission.32
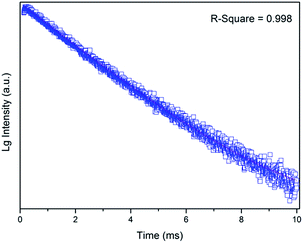 | ||
| Fig. 5 RT fluorescence decay curve detected at 542 nm (λem = 276 nm). The solid line represents the best fit to the data. | ||
4. Implication
Rare earth element-doped chain silicates, such as the MSiO3 (M = Mg, Ca, Sr, Ba) solid solutions, form a very important group of photoluminescence materials, with different M-site cations leading to different photoluminescence spectra.33–35 Furthermore, there are usually multiple M sites in these silicates. When these M sites are occupied by different rare earth elements, different luminescence properties are resulted in. In the case of the Eu2+-doped NaScSi2O6–CaMgSi2O6 solid solutions,36 as an example, the color-tunable photoluminescence feature was ascribed to the different local M-site environments of the Eu2+. Accordingly, it's important to investigate the rare earth element distribution on the M sites. In this study, we have analyzed the Tb distribution of the chain silicate Na2Tb1.08Ca2.92Si6O18H0.8 on its different M sites using single-crystal data. Combined with the BVSs, the valences of the Tb have been constrained as well. On the other hand, it remains to be explored whether the structure of this new phase, plus its optical properties, has strong dependence on the substitution between Tb and Ca on the M sites. We believe that the result reported here should stimulate further research on rare earth element-doped silicate photoluminescence materials.5. Conclusions
In summary, a new microporous compound, with the composition of Na2Tb1.08Ca2.92Si6O18H0.8 and a novel 3-D framework, has been synthesized under HP conditions. The structure of this phase can be viewed as made of some [MO6] polyhedron double chains and zigzag [SiO4] tetrahedron single chains. The [MO6] polyhedron double chains, in parallel to the b-axis, are connected by neighboring SiO4 tetrahedron via vertex oxygen atoms to form a three-dimensional framework. This new phase contains large 6-membered ring channels along the b-axis direction, which are delimited by the [SiO4] tetrahedra and [MO6] polyhedra. Its photoluminescence studies are consistent with the crystallographic results, suggesting a strong green emission and a lifetime value of 2.498(7) ms. The successful synthesis of this new terbium silicate under HP conditions and the research on the rare earth element distribution on the M sites will stimulate further study on the lanthanide silicates with novel structures and useful optical properties.Conflicts of interest
There are no conflicts to declare.Acknowledgements
This study was financially supported by the Strategic Priority Research Program (B) of Chinese Academy of Sciences (Grant No. XDB18000000), by the DREAM project of MOST, China (Grant No. 2016YFC0600408), and by the Program of the Data Integration and Standardization in the Geological Science and Technology from MOST, China (Grant No. 2013FY1109000-3).Notes and references
- D. Ananias, M. Kostova, F. A. A. Paz, A. Ferreira, L. D. Carlos, J. Klinowski and J. Rocha, J. Am. Chem. Soc., 2004, 126, 10410 CrossRef CAS PubMed.
- G. Wang, J. Li, J. Yu, P. Chen, Q. Pan, H. Song and R. Xu, Chem. Mater., 2006, 18, 5637 CrossRef CAS.
- M. Y. Huang, Y. H. Chen, B. C. Chang and K. H. Lii, Chem. Mater., 2005, 17, 5743 CrossRef CAS.
- J. Rocha, L. D. Carlos, F. A. A. Paz and D. Ananias, Chem. Soc. Rev., 2011, 40, 926 RSC.
- D. Ananias, F. A. A. Paz, L. D. Carlos and J. Rocha, Microporous Mesoporous Mater., 2013, 166, 50 CrossRef CAS.
- L. D. Sanjeewa, K. Fulle, C. D. McMillen, F. Wang, Y. f. Liu, J. He, J. N. Anker and J. W. Kolis, Solid State Sci., 2015, 48, 256 CrossRef CAS.
- D. Ananias, F. A. A. Paz, D. S. Yufit, L. D. Carlos and J. Rocha, J. Am. Chem. Soc., 2015, 137, 3051 CrossRef CAS PubMed.
- M. Wierzbicka-Wieczorek, M. Göckeritz, U. Kolitsch, C. Lenz and G. Giester, Eur. J. Inorg. Chem., 2015, 2015, 2426 CrossRef CAS.
- J. Rocha, P. Ferreira and Z. Lin, Chem. Commun., 1997, 21, 2103 RSC.
- D. Ananias, A. Ferreira, J. Rocha, P. Ferreira, J. P. Rainho, C. Morais and L. D. Carlos, J. Am. Chem. Soc., 2001, 123, 5735–5742 CrossRef CAS PubMed.
- A. Ferreira, D. Ananias, L. D. Carlos, C. M. Morais and J. Rocha, J. Am. Chem. Soc., 2003, 125, 14573 CrossRef CAS PubMed.
- J. Rocha, P. Ferreira, Z. Lin, P. Brandão, A. Ferreira and J. D. P. d. Jesus, J. Phys. Chem. B, 1998, 102, 4739 CrossRef CAS.
- H. Chen, C. X. Li, Y. J. Hua, L. L. Yu, Q. Y. Jiang, D. G. Deng, S. L. Zhao, H. P. Ma and S. Q. Xu, Ceram. Int., 2014, 40, 1979 CrossRef CAS.
- X. G. Zhao, J. Y. Li, P. Chen, Y. Li, Q. X. Chu, X. Y. Liu, J. H. Yu and R. R. Xu, Inorg. Chem., 2010, 49, 9833 CrossRef CAS PubMed.
- C. Wang, X. Liu, M. E. Fleet, S. Fenga and R. Xua, J. Solid State Chem., 2006, 179, 2245 CrossRef CAS.
- C. Wang, X. Liu, M. E. Fleet, J. Li, S. Feng, R. Xu and Z. Jin, CrystEngComm, 2010, 12, 1617 RSC.
- W. Liu, M. Yang, Y. Ji, F. Y. Liu, Y. Wang, X. F. Wang, X. D. Zhao and X. Y. Liu, RSC Adv., 2014, 4, 26951 RSC.
- W. Liu, Y. Ji, F. Y. Liu, Y. Wang, X. D. Zhao and X. Y. Liu, RSC Adv., 2015, 5, 29121 RSC.
- L. Chang, X. Liu, C. Wu, X. Liu and G. Li, Phys. Chem. Miner., 2015, 42, 223 CrossRef CAS.
- Q. He, X. Liu, B. Li, L. Deng, Z. Chen, X. Liu and H. Wang, Phys. Chem. Miner., 2013, 40, 29 CrossRef.
- X. Liu and M. Fleet, J. Mineral. Petrol. Sci., 2009, 104, 25 CrossRef CAS.
- J. F. Moulder, W. F. Stickle, P. E. Sobol and K. D. Boomben, Handbook of X-ray Photoelectron Spectroscopy, Physical Electronics, 1995 Search PubMed.
- T. K. Hirsch and L. Ojamäe, Acta Crystallogr., Sect. B: Struct. Sci., 2004, 60, 179 Search PubMed.
- T. K. Hirsch, Z. Anorg. Allg. Chem., 2003, 629, 666 CrossRef CAS.
- R. D. Shannon, B. E. Taylor, T. E. Gier, H. Y. Chen and T. Berzins, Inorg. Chem., 1978, 17, 958 CrossRef CAS.
- I. D. Brown and D. Altermatt, Acta Crystallogr., Sect. B: Struct. Sci., 1985, 41, 244 CrossRef.
- N. E. Brese and M. O'Keeffe, Acta Crystallogr., Sect. B: Struct. Sci., 1991, 47, 192 CrossRef.
- P. Dorenbos, J. Lumin., 2000, 91, 91 CrossRef CAS.
- P. Dorenbos, J. Phys.: Condens. Matter, 2003, 15, 6249 CrossRef CAS.
- H. Ebendorff-Heidepriem and D. Ehrt, Opt. Mater., 2002, 18, 419 CrossRef CAS.
- G. Blasse, Prog. Solid State Chem., 1988, 18, 79 CrossRef CAS.
- W. H. Di, X. J. Wang, B. J. Chen, S. Z. Lu and X. X. Zhao, J. Phys. Chem. B, 2005, 109, 13154 CrossRef CAS PubMed.
- S. H. M. Poort, H. M. Reijnhoudt, H. O. T. Kuip and G. Blasse, J. Alloys Compd., 1996, 241, 75 CrossRef CAS.
- Z. G. Cui, G. H. Jia and D. G. Deng, J. Lumin., 2012, 132, 153 CrossRef CAS.
- M. A. Mickens and Z. Assefa, J. Lumin., 2014, 145, 498 CrossRef CAS.
- Z. G. Xia, Y. Y. Zhang, M. S. Molokeev, V. V. Atuchin and Y. Luo, Sci. Rep., 2013, 3, 3310 CrossRef PubMed.
Footnote |
| † Electronic supplementary information (ESI) available. CCDC 1574110. For ESI and crystallographic data in CIF or other electronic format see DOI: 10.1039/c7ra10182a |
| This journal is © The Royal Society of Chemistry 2017 |

