 Open Access Article
Facile synthesis of tea waste/Fe3O4 nanoparticle composite for hexavalent chromium removal from aqueous solution
Shisuo Fan *ab,
Yi Wanga,
Yang Lic,
Jun Tanga,
Zhen Wanga,
Jie Tanga,
Xuede Liab and
Kai Hua
aSchool of Resources and Environment, Anhui Agricultural University, Hefei, 230036, P. R. China. E-mail: fanshisuo@ahau.edu.cn; Fax: +86-551-6578-6311; Tel: +86-551-6578-6311
bHefei Scientific Observing and Experimental Station of Agro-Environment, Ministry of Agriculture, P. R. China, Hefei, 230036, China
cCollege of Environmental Science and Engineering, Tongji University, Shanghai 200092, P. R. China
First published on 23rd January 2017
Abstract
The modification of biomass waste, as a multifunctional composite, has received tremendous attention for resource utilization and recycling. In this study, tea waste, which is a high level generator of biomass waste, was loaded with nano-Fe3O4 particles to prepare a magnetic tea waste/Fe3O4 (TW/Fe3O4) composite through a facile chemical co-precipitation approach. BET, SEM, TEM, XRD, magnetic properties, FTIR, XPS were used to characterize the TW/Fe3O4 composite. A superparamagnetic TW/Fe3O4 composite (Fe3O4: about 20 nm) was successfully synthesized and possessed the advantages of tea waste and nano-Fe3O4 particles. A chromium(VI) adsorption experiment showed that this material has a strong adsorption capacity for aqueous chromium ions, which reached 75.76 mg g−1 based on the Langmuir model. The adsorption process could be well fitted by a pseudo-second-order kinetic model and Langmuir, Temkin and Dubinin–Radushkevich (D–R) isotherm models, and was spontaneous and endothermic according to the thermodynamic analysis. The TW/Fe3O4 composite revealed good reusability and the removal rate was more than 70% after five recycling cycles. The mechanism of Cr(VI) removal involved electrostatic attraction, reduction process, ion exchange, surface complexation, etc. 70% of Cr(VI) was reduced to Cr(III) in this investigation. This study indicated that a TW/Fe3O4 composite could be an attractive option for heavy metal treatment.
1. Introduction
Chromium is one of the most worrying pollutants in the environment. The primary sources of chromium include the electroplating, cement, fertilizer, textile and steel industries.1 The speciation of chromium determines its environmental behavior. The main valences of chromium are Cr(VI) and Cr(III). The mobility and solubility of Cr(VI) are higher in aqueous solution. Cr(VI) may exert a toxic effect on biological systems.2 Hence, removal of Cr(VI) from the water system is crucial.Many approaches, including chemical precipitation, ion-exchange, electrochemical, reduction, membrane filtration, and adsorption,3,4 have been proposed for the removal of Cr(VI) from aqueous solution. Due to the advantages of convenient operation, lower cost, and higher efficiency, the adsorption method has been widely applied. Currently, adsorbents derived from biomass or modified biomass have drawn great attention.5–8
With the development of the tea industry, the amount of tea waste has also increased. Tea waste could act as a good absorbent for heavy metal removal from wastewater because of its abundant organic functional groups and cellulose-based pore structure. The removal of metals by tea waste has been reported in previous literature, including Cu2+,9–12 Cd2+,10–12 Zn2+,11,13 Ni2+,13–15 and Pb2+.9,11–13 Meanwhile, the removal of Cr(VI) by tea waste has also been investigated in previous studies.16,17
However, it is difficult to separate powdered adsorbent from an aqueous solution for recycling and the adsorption capacity of biomass for heavy metals is limited. The introduction of magnetic nano-particles into the adsorbent could solve this problem. Chen et al.18 found that loading of Fe3O4 nanoparticles into the composite could improve the magnetic and adsorption properties of raw composite. Nano-Fe3O4 material had been widely used in wastewater treatment based on its superparamagnetic properties, high surface area, easy separation, lower toxicity, etc.19,20 Meanwhile, the loading of nano-Fe3O4 onto a biomass adsorbent could also enhance the dispersibility and stability of nano-Fe3O4 particles.21
A preliminary investigation into a tea waste/nano particle composite was also carried out. The preparation of a tea waste/nano Fe3O4 composite has been used to remove Ni(II) from aqueous solution.22 Babaev et al.23 investigated Cr(VI) removal by spent tea-supported magnetite nano-particles from aqueous solutions. The preparation method was co-precipitation (FeCl2·4H2O + NaOH) and the maximum adsorption capacity was 30 mg g−1. However, most studies focused on the adsorption thermodynamics or kinetics, and investigation of the adsorption capacity of a tea waste/nano particle composite was limited. The removal of Cr(VI) by tea waste/nano Fe3O4 has rarely been reported, especially the adsorption mechanism and potential recycling.
Therefore, tea waste was chosen as the matrix for the synthesis of a composite. Nano-Fe3O4 particles were loaded into the tea waste by a chemical co-precipitation method to prepare a magnetic tea waste/Fe3O4 composite. The composite was applied to remove Cr(VI) from aqueous solution. The purposes of this study are (1) to investigate the effect of proper parameters, kinetics, and equilibrium on Cr(VI) adsorption on a tea waste/Fe3O4 composite; (2) to explore the interaction mechanism between Cr(VI) and the tea waste/Fe3O4 composite; (3) to assess the potential recycling of the tea waste/Fe3O4 composite acting as Cr(VI) absorbent. Our results showed that a tea waste/Fe3O4 composite can be facilely prepared and could be used to remove Cr(VI) from aqueous solution.
2. Materials and methods
2.1. Synthesis of TW/Fe3O4 composite
Tea waste was collected from a tea factory in Anhui province, China. The pretreatment procedure of tea waste was described in a previous ref. 22. The chemical co-precipitation method had been used to prepare nano-particles with a homogeneous composition and narrow size distribution.24 This method was facile and widely used to synthesize nano-particles. The product was called a TW/Fe3O4 composite (TW: tea waste) and the reactions are as shown in eqn (1) and (2). To obtain nano-Fe3O4 particles, 5.2 g of FeSO4·7H2O and 7.4 g of FeCl3·6H2O were put in a three-mouth flask and 80 mL of distilled water was added to dissolve the iron compound with vigorous stirring. When the solution was heated to 80 °C, 20 mL of ammonium hydroxide (25%) was added. Then, 10 g of tea waste was added into the solution and the reaction proceeded for 30 min at 80 °C under constant stirring. The whole process was conducted under the protection of N2 gas. The reaction product was cooled down to room temperature and then repeatedly washed with distilled water and absolute ethyl alcohol to remove the unreacted chemicals. An external magnet was used to separate the product from the solution. The prepared product was dried in a vacuum oven at 60 °C for 10 h.| Fe2+ + 2Fe3+ + 8OH− → Fe3O4 + 4H2O | (1) |
| Fe3O4 + TW + 4H2O → TW − Fe3O4 | (2) |
All the chemicals used were of analytical grade and were purchased from the Sinopharm Group Chemical Reagent Co., Ltd. China. The experiments were determined in triplicate and the average value is shown.
2.2. Batch adsorption experiments
The Cr(VI) stock solution was prepared by dissolving 0.2829 g of K2Cr2O7 in 1000 mL of distilled water. The effect of pH, adsorbent dosage, contact time, and temperature on Cr(VI) removal was examined through batch adsorption studies.An amount of TW/Fe3O4 composite (0.04 g) and 40 mL of Cr(VI) solution of 40 mg L−1 were mixed in a 50 mL centrifugal tube. The solution pH was adjusted to 2–8 with 0.1 M HCl or 0.1 M NaOH solutions (pH effect). A varying mass of TW/Fe3O4 composite and 40 mL of Cr(VI) solution of 25 mg L−1 were added to a 50 mL centrifugal tube to give a solid/liquid ratio in the range of 0.1–3 g L−1 (dosage effect). The experiment was conducted in an oscillator with the conditions of temperature 298 K, contact time 12 h and an agitation rate of 180 rpm. When the adsorption reached equilibrium, the suspended solution was separated using an external magnet and was passed through a 0.45 μm filter member. The concentration of Cr(VI) in the supernatant was determined by measuring the absorbance of the purple complex of Cr(VI) with 1,5-diphenylcarbazide at 540 nm by a spectrophotometer (722S, Shanghai Precision, Shanghai, China). The removal rate and adsorption amount were calculated according to formulas (3) and (4).
 | (3) |
 | (4) |
 | (5) |
2.3. Characterization
The textural properties of tea waste and TW/Fe3O4 composite were analyzed with a surface area and porosity analyzer (Micromeritics, Tristar II 3020) at 77 K under N2 atmosphere. The surface area, pore volume and average pore size were calculated using the nitrogen adsorption isotherms. The multipoint Brunauer–Emmett–Teller method was employed to calculate the surface area. The pore volume and average pore size were obtained from desorption isotherms using the Barrett–Joyner–Halenda method. The surface morphology of the TW/Fe3O4 composite was characterized by a Scanning Electron Microscope (SEM, Sirion 200, FEI company, USA) and a Transmission Electron Microscope (TEM, Tecnai G2 spirit Biotwin, FEI, USA). The crystal composition of the TW/Fe3O4 composite was also analyzed by X-ray diffraction (XRD, Bruker, D8 Advance, Germany). The magnetic properties of the TW/Fe3O4 composite and the adsorbed Cr(VI) composite were determined by a SQUID instrument (MPMS XL-7, Quantum Design, USA). The functional groups of TW/Fe3O4 composite and absorbed Cr(VI) composite were measured by Fourier Transform Infrared Spectroscopy (Nicolette is50, Thermo Fourier, USA).The concentration of released metals (Ca2+, Na+, K+, Mg2+) from the TW/Fe3O4 composite in the supernatant of the equilibrium solution was analyzed by inductively coupled plasma optical emission spectroscopy (ICP-OES, PerkinElmer, 2100DV, USA). The corresponding release of Ca2+, Na+, K+, Mg2+ from the TW/Fe3O4 composite with deionized water served as a control.
The concentration of total Cr in the supernatant was determined by atomic absorption spectroscopy (AAS, ZEEnit 700P, Analytik Jena AG, Germany). The concentration of Cr(VI) was analyzed by spectrophotometer. The concentration of Cr(III) in the supernatant was calculated as the difference between the total Cr and Cr(VI) concentrations.
The valence of the Cr bound on the TW/Fe3O4 composite was determined by an X-ray Photoelectron Spectrometer (Thermo-VG Scientific, ESCALAB 250, USA). The Cr-laden TW/Fe3O4 composite was obtained by shaking 1 g L−1 composite with 50 mg L−1 at pH 2 for 10 h.
3. Results and discussion
3.1. Characterization of tea waste/Fe3O4 composite
The SEM and TEM spectra of the TW/Fe3O4 composite are shown in Fig. 1. The raw tea waste had a fibrous structure due to its cellulose and hemicellulose components (Fig. 1(a)). Fig. 1(b) shows the image of the Fe3O4 nano-particles. As shown in Fig. 1(c), the nano-Fe3O4 particles had been successfully loaded into the tea waste. The surface and interiors of the tea waste were covered with nano-Fe3O4 particles. The introduction of nano-Fe3O4 particles increases the pore diameter and provides more adsorption sites to remove Cr(VI). As Fig. 1(d) shows, the TW/Fe3O4 composite could be obviously seen and appeared to have a cubic spinel structure. The size of the Fe3O4 nanoparticles is approximately 20 nm. Thus, the TW/Fe3O4 composite had been successfully prepared and was used for the subsequent adsorption experiments.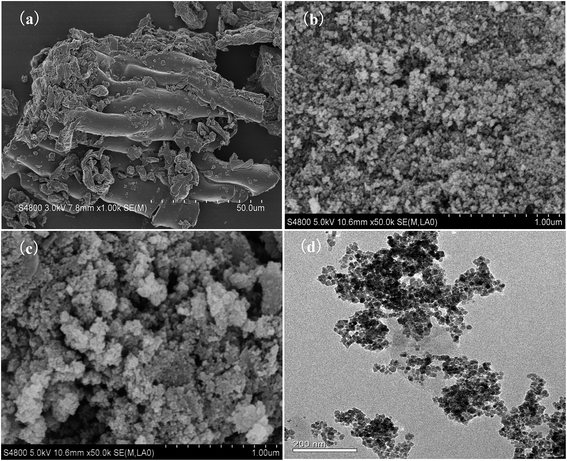 | ||
| Fig. 1 SEM photo (a) tea waste; (b) Fe3O4; (c) TW/Fe3O4 composite and (d) TEM of TW/Fe3O4 composite. | ||
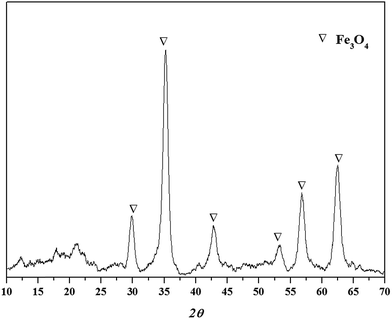
The XRD spectrum of the TW/Fe3O4 composite is shown in Fig. 2. As can be seen in Fig. 2, a Fe3O4 crystal compound could be detected and the values of 2θ were 30.20°(220), 35.54°(311), 43.30°(400), 53.50°(422), 57.30°(511), 62.90°(440).18,25 Thus, nano-Fe3O4 particles had been produced and loaded into the tea waste. The peaks (2θ) of the composite which were located nearby at 17° and 22° may relate to the amorphous carbon based on tea waste.
The specific surface area, pore volume and average pore diameter of the TW/Fe3O4 composite were 6.906 m2 g−1, 0.042 cm3 g−1 and 65.471 nm, respectively. Meanwhile, the specific surface area, pore volume and average pore diameter of the raw tea waste were 0.913 m2 g−1, 0.007 cm3 g−1 and 2.611 nm, respectively. Compared with tea waste, the surface area and pore volume of the TW/Fe3O4 composite increased significantly. This indicated that more adsorption sites could be provided, benefiting the binding of Cr(VI). However, the average pore diameter of the TW/Fe3O4 composite also obviously increased. This means that loading of nano-Fe3O4 particles could increase the pore average, consistent with the previous study.26
The introduction of nano-Fe3O4 particles could cause the composite to be magnetic.
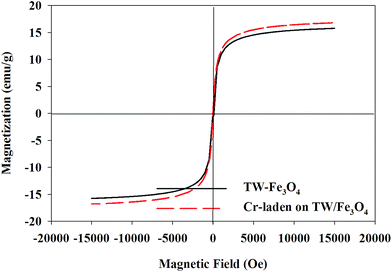
Magnetic hysteresis loops of the TW/Fe3O4 composite and the Cr-adsorbed composite are shown in Fig. 3. As shown in the figure, with the increase in magnetic field, the magnetization of the TW/Fe3O4 composite also increased and tended to saturation. The saturation magnetization of the TW/Fe3O4 composite and adsorbed-Cr composite were 15.8 emu g−1 and 16.8 emu g−1, respectively. The TW/Fe3O4 composite also showed a good superparamagnetic character though the composite had adsorbed the Cr(VI) aqueous solution. The TW/Fe3O4 composite could be easily separated from aqueous solution by an external magnet. Thus, the magnetization curves indicated that the TW/Fe3O4 composite possesses a good magnetic characteristic. The magnetic property of the TW/Fe3O4 composite also remained after Cr(VI) adsorption, suggesting that the TW/Fe3O4 composite has the potential for recycling.
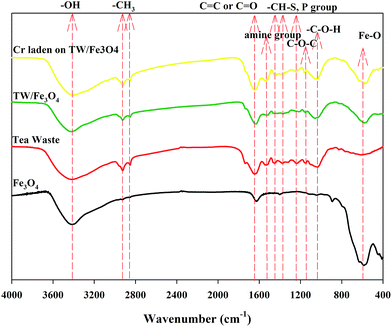
The FTIR spectra of tea waste, Fe3O4, TW/Fe3O4 and Cr(VI)-adsorbed onto TW/Fe3O4 are shown in Fig. 4. The FTIR spectra of tea waste, Fe3O4, TW/Fe3O4 and Cr(VI) adsorbed onto TW/Fe3O4 composite were different and the typical functional groups are presented in Table 1. The peaks of the main functional groups in tea waste include 3416 cm−1 (bonded –OH groups), 2924 cm−1 and 2852 cm−1 (aliphatic C–H group), 1647 cm−1 (C![[double bond, length as m-dash]](https://www.rsc.org/images/entities/char_e001.gif) O stretching or aromatic C
O stretching or aromatic C![[double bond, length as m-dash]](https://www.rsc.org/images/entities/char_e001.gif) C and C
C and C![[double bond, length as m-dash]](https://www.rsc.org/images/entities/char_e001.gif) O/C
O/C![[double bond, length as m-dash]](https://www.rsc.org/images/entities/char_e001.gif) C stretching), 1536 cm−1 (secondary amine group), 1452 cm−1 (C–H alkanes in aromatic rings), 1370 cm−1 (C–H bending –CH3 symmetric bending of CH3), 1234 cm−1 (–SO3 stretching/P
C stretching), 1536 cm−1 (secondary amine group), 1452 cm−1 (C–H alkanes in aromatic rings), 1370 cm−1 (C–H bending –CH3 symmetric bending of CH3), 1234 cm−1 (–SO3 stretching/P![[double bond, length as m-dash]](https://www.rsc.org/images/entities/char_e001.gif) O), 1149 cm−1 (C–O–C of polysaccharides), 1036 cm−1 (C–O–H stretching), 613 cm−1 (–C–C–).27,28 Thus, tea waste contains protein-like, aliphatic-like, cellulose-like substances which have hydroxyl, carboxyl, and amine groups, and S- and P-containing functional groups. The obvious peak at 583 cm−1 in the spectrum of Fe3O4 indicates Fe–O, suggesting the assignment of Fe3O4. Other peaks were at 892 cm−1 (Fe–O–H), 1630 cm−1 and 1400 cm−1 (hydroxyl groups from water adsorbed during the preparation of the TW/Fe3O4 composite).29,30 The peaks of the main functional groups of the TW/Fe3O4 composite include 3423 cm−1 (bonded –OH groups), 2923 cm−1 and 2852 cm−1 (aliphatic C–H group), 1630 cm−1 (assigned to C
O), 1149 cm−1 (C–O–C of polysaccharides), 1036 cm−1 (C–O–H stretching), 613 cm−1 (–C–C–).27,28 Thus, tea waste contains protein-like, aliphatic-like, cellulose-like substances which have hydroxyl, carboxyl, and amine groups, and S- and P-containing functional groups. The obvious peak at 583 cm−1 in the spectrum of Fe3O4 indicates Fe–O, suggesting the assignment of Fe3O4. Other peaks were at 892 cm−1 (Fe–O–H), 1630 cm−1 and 1400 cm−1 (hydroxyl groups from water adsorbed during the preparation of the TW/Fe3O4 composite).29,30 The peaks of the main functional groups of the TW/Fe3O4 composite include 3423 cm−1 (bonded –OH groups), 2923 cm−1 and 2852 cm−1 (aliphatic C–H group), 1630 cm−1 (assigned to C![[double bond, length as m-dash]](https://www.rsc.org/images/entities/char_e001.gif) O and C
O and C![[double bond, length as m-dash]](https://www.rsc.org/images/entities/char_e001.gif) C aromatic vibrations), 1518 cm−1 (secondary amine group), 1367 cm−1 (C–O stretching vibration), 1215 cm−1 (C–N stretching), 1151 cm−1 (C–O stretching of ether groups), 1059 cm−1 (C–O stretching of COOH), 579 cm−1 (Fe–O). Thus, the TW/Fe3O4 composite retained the functional groups of tea waste and also loaded the functional groups of nano-Fe3O4. Meanwhile, the introduction of Fe3O4 also changed some functional groups of tea waste and led to a shift in some peaks or the intensity reduction of some peaks, such as 1647 cm−1, 1536 cm−1, 1452 cm−1, 1234 cm−1, and 1036 cm−1.
C aromatic vibrations), 1518 cm−1 (secondary amine group), 1367 cm−1 (C–O stretching vibration), 1215 cm−1 (C–N stretching), 1151 cm−1 (C–O stretching of ether groups), 1059 cm−1 (C–O stretching of COOH), 579 cm−1 (Fe–O). Thus, the TW/Fe3O4 composite retained the functional groups of tea waste and also loaded the functional groups of nano-Fe3O4. Meanwhile, the introduction of Fe3O4 also changed some functional groups of tea waste and led to a shift in some peaks or the intensity reduction of some peaks, such as 1647 cm−1, 1536 cm−1, 1452 cm−1, 1234 cm−1, and 1036 cm−1.
| Tea waste cm−1 | Assignment | Fe3O4 cm−1 | Assignment | TW/Fe3O4 | Assignment | ||
|---|---|---|---|---|---|---|---|
| Before adsorption | After adsorption | Difference | |||||
| 3416 | Bonded –OH groups | 3423 | Hydroxyl groups | 3423 | 3406 | +17 | Bonded –OH groups |
| 2924 | Aliphatic C–H group | 1630 | Hydroxyl groups | 2923 | 2923 | 0 | Aliphatic C–H group |
| 2852 | Aliphatic C–H group | 1400 | Hydroxyl groups | 2852 | 2852 | 0 | Aliphatic C–H group |
| 1647 | C![[double bond, length as m-dash]](https://www.rsc.org/images/entities/char_e001.gif) O stretching aromatic C O stretching aromatic C![[double bond, length as m-dash]](https://www.rsc.org/images/entities/char_e001.gif) C C C C![[double bond, length as m-dash]](https://www.rsc.org/images/entities/char_e001.gif) O/C O/C![[double bond, length as m-dash]](https://www.rsc.org/images/entities/char_e001.gif) C stretching C stretching |
892 | Fe–O–H | 1630 | 1640 | −10 | Assigned to C![[double bond, length as m-dash]](https://www.rsc.org/images/entities/char_e001.gif) O and C O and C![[double bond, length as m-dash]](https://www.rsc.org/images/entities/char_e001.gif) C aromatic vibrations C aromatic vibrations |
| 1536 | Secondary amine group | 583 | Fe–O | 1518 | 1541 | −23 | Secondary amine group |
| 1452 | C–H alkanes in aromatic rings | 1367 | 1385 | −18 | C–O stretching vibration | ||
| 1370 | C–H bending –CH3 symmetric bending of CH3 | 1215 | 1246 | −31 | C–N stretching | ||
| 1234 | –SO3 stretching/P![[double bond, length as m-dash]](https://www.rsc.org/images/entities/char_e001.gif) O O |
1151 | 1158 | 0 | C–O stretching of ether groups | ||
| 1149 | C–O–C of polysaccharides | 1059 | 1059 | 0 | C–O stretching of COOH | ||
| 1036 | C–O–H stretching | 579 | 579 | 0 | Fe–O | ||
| 613 | –C–C– | ||||||
When the Cr(VI) was adsorbed on the TW/Fe3O4 composite, some peaks had changed, including 3423 → 3406 cm−1, 1630 → 1640 cm−1, 1518 → 1541 cm−1, 1367 → 1385 cm−1, 1215 → 1246 cm−1. Hence, –OH, C![[double bond, length as m-dash]](https://www.rsc.org/images/entities/char_e001.gif) O and C
O and C![[double bond, length as m-dash]](https://www.rsc.org/images/entities/char_e001.gif) C, C–O, the secondary amine groups, and C–N functional group may participate in the adsorption of Cr(VI), referring to surface complexation, ion exchange, etc.
C, C–O, the secondary amine groups, and C–N functional group may participate in the adsorption of Cr(VI), referring to surface complexation, ion exchange, etc.
The XPS spectrum of the TW/Fe3O4 composite and Cr(VI) adsorbed onto TW/Fe3O4 are displayed in Fig. 5. As shown in Fig. 5(a), elements in the TW/Fe3O4 composite involve C, O, Fe, etc. When the Cr(VI) was adsorbed on the TW/Fe3O4 composite, the Cr was detected (as shown in Fig. 5(b)). The fitting of the Cr valence is shown in Fig. 5(c).
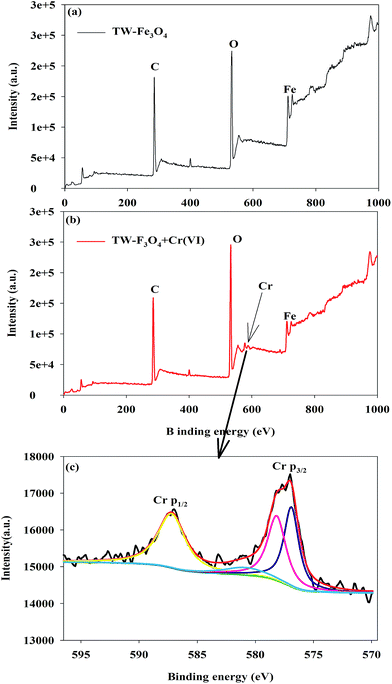 | ||
| Fig. 5 XPS analysis of the TW/Fe3O4 composite and absorbed Cr on the TW/Fe3O4 composite (a) TW/Fe3O4 composite (b) Cr laden on the TW/Fe3O4 composite (c) speciation analysis of Cr. | ||
The binding energies at 587.2 and 576.9 eV could be assigned to Cr(III) and binding energies at 578.2 and 580.9 eV could be attributed to Cr(VI).31–37 The ratio of Cr(III)/Cr(VI) was 1.68, based on the peak area analysis. The results confirm that both Cr(VI) and Cr(III) coexist on the surface of the Cr(VI)-adsorbed TW/Fe3O4 composite. Thus, most of the Cr bound to the adsorbent was in the trivalent state during Cr(VI) adsorption. The results of XPS confirm that the reduction of Cr(VI) to Cr(III) by the TW/Fe3O4 composite is the major process, while more Cr(VI) was bound in a reduced state of Cr(III) during the process.
When the Cr(VI) was reduced to Cr(III), organic compounds in tea waste were responsible for reducing Cr(VI), including carboxyl, methoxy, carbonyl, and hydroxyl groups, and amino groups which could act as electron-donors. Meanwhile, under the acidic atmosphere, few Fe2+ ions may be oxidized by Cr(VI), although Fe3O4 nanoparticles are relatively stable and further confirmation is needed in future research.
3.2. Effect of pH
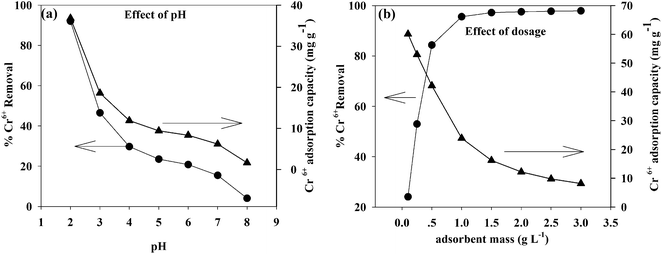
pH is a key factor in the adsorption process and affects the surface charge of the adsorbent, the degree of ionization, and the speciation of metals in the solution.38The adsorption of Cr(VI) on the TW/Fe3O4 composite is highly pH dependent. The effect of pH on the adsorption of Cr(VI) onto the TW/Fe3O4 composite was investigated in the pH range from 2 to 8. As shown in Fig. 6(a), pH significantly affects Cr(VI) removal. With an increase in pH, the removal rate of Cr(VI) significantly decreased. When the pH was 2, the removal of Cr(VI) was more than 90%. When the pH was 3, the removal of Cr(VI) was lower than 50%. The removal of Cr(VI) decreased when the pH was larger than 3. Thus, pH 2 was a suitable parameter in this work. All subsequent adsorption experiments herein were conducted at pH 2, the optimum pH for adsorption of Cr(VI) onto the TW/Fe3O4 composite.
pH influenced the surface charge and the protonation degree of the TW/Fe3O4 composite. The main Cr(VI) species are HCrO4−, CrO42−, Cr2O72−, etc.39,40 When the pH was lower, the surface charge of the TW/Fe3O4 composite caused a protonation reaction and more positive charge formed. The binding site of the TW/Fe3O4 composite could interact with Cr(VI) through electrostatic attraction or an ion exchange process. With the increase in pH, OH− increased and competed with HCrO4−, leading to a decrease in Cr(VI) removal efficiency.41 Meanwhile, the positive surface charge of Fe3O4 could attract HCrO4− through electrostatic interaction under the acidic conditions, consistent with previous studies.42,43
3.3. Effect of TW/Fe3O4 composite dosage
Adsorbent dosage is also an important parameter to determine its adsorption ability. The effect of dosage on removal rate and adsorption amount is shown in Fig. 6(b). As shown in Fig. 6(b), as the dosage was increased from to 0.1 to 1, the removal rate of Cr(VI) increased from 20% to 90%. When the adsorbent dosage was larger than 1, the removal rate increased slightly, suggesting that the adsorption reached a saturated state. The TW/Fe3O4 composite provided enough adsorption sites to bind the Cr(VI). However, adsorption density (adsorption capacity for unit mass of the adsorbent) decreased with an increase in adsorbent concentration due to formula (3). This was consistent with the previous study.44 After comprehensive consideration of removal rate, adsorption capacity, and cost, the optimum absorbent dosage was found to be 1 g L−1.3.4. Effect of contact time, initial concentration and temperature on the removal of Cr(VI)
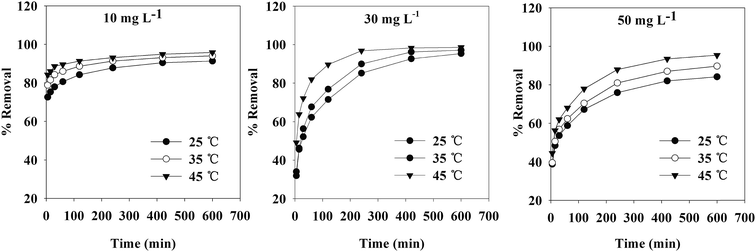
The contact time, initial concentration and temperature also had pronounced effects on the removal of Cr(VI) from aqueous solution. The effects of these parameters on Cr(VI) removal rate are shown in Fig. 7. The rate of Cr(VI) uptake was quite fast for the first 30 min. The adsorption reaction reached equilibrium when the contact time was 10 h.When the initial concentration of Cr(VI) was higher, the rate of Cr(VI) removal was relatively slow at the beginning. With a prolonged contact time, the adsorption ultimately reached equilibrium. The removal rate was higher when the initial concentration of Cr(VI) was lower under the same conditions, as the TW/Fe3O4 composite could provide more adsorption sites. When the initial concentration of Cr(VI) was the same, a higher temperature led to a higher removal rate in the temperature range of 25–45 °C. A higher temperature was beneficial for the adsorption of Cr(VI) on the TW/Fe3O4 composite.
3.5. Adsorption kinetics
Based on the adsorption kinetics of Cr(VI) onto the TW/Fe3O4 composite, experimental data was fitted using pseudo-first-order, pseudo-second-order, intra-particle diffusion and Elovich models.45–48 The kinetic equations are expressed as the following eqn (6)–(9).Pseudo-first-order
 | (6) |
Pseudo-second-order
 | (7) |
Intra-particle diffusion
| qt = kidt1/2 + C | (8) |
Evolich
qt = (1/β)ln(αβ) + 1/β![[thin space (1/6-em)]](https://www.rsc.org/images/entities/char_2009.gif) ln(t) ln(t)
| (9) |
The kinetic fitting of Cr(VI) on the TW/Fe3O4 composite at 298 K is shown in Fig. 8.
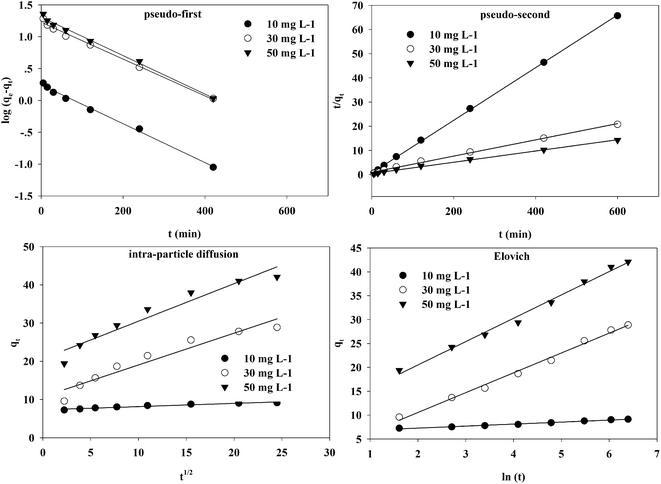 | ||
| Fig. 8 Pseudo-first-order, pseudo-second-order, intra-particle diffusion, and Elovich kinetics models of Cr(VI) adsorption onto the TW/Fe3O4 composite at 298 K. | ||
The fitting parameters of pseudo-first-order and pseudo-second-order kinetics are presented in Table 2. The correlation coefficient (R2) was larger than 0.99 and indicates that pseudo-first-order and pseudo-second-order kinetic models could fit the adsorption process well. However, the calculated qe from the pseudo-first-order kinetic model shows a large difference from the qe from experiment. The calculated qe from the pseudo-second-order kinetic model was close to the qe from experiment. Thus, the pseudo-second-order model could better fit the adsorption process of Cr(VI) onto the TW/Fe3O4 composite. Generally, the pseudo-second-order kinetic model was used to describe chemisorption, referring to valency force through the sharing or exchange of electrons between the adsorbent and adsorbate as covalent forces, and ion exchange.46,49,50 Therefore, the removal rate of Cr(VI) by the TW/Fe3O4 composite was controlled by a chemisorption mechanism.
| Initial concentration (mg L−1) | T (K) | Pseudo-first-order | Pseudo-second-order | ||||
|---|---|---|---|---|---|---|---|
| qe | k1 | R2 | qe | k2 | R2 | ||
| 10 | 298 | 1.7557 | 0.0070 | 0.9945 | 9.1827 | 0.0175 | 0.9997 |
| 308 | 1.3006 | 0.0065 | 0.9863 | 9.3897 | 0.0243 | 0.9998 | |
| 318 | 0.9838 | 0.0057 | 0.9758 | 9.5923 | 0.0302 | 0.9999 | |
| 30 | 298 | 16.8601 | 0.0069 | 0.9915 | 29.7530 | 0.0012 | 0.9964 |
| 308 | 17.1712 | 0.0083 | 0.9940 | 30.3674 | 0.0014 | 0.9982 | |
| 318 | 11.9989 | 0.0120 | 0.9897 | 30.1023 | 0.0033 | 0.9998 | |
| 50 | 298 | 20.3470 | 0.0070 | 0.9934 | 42.9738 | 0.0012 | 0.9976 |
| 308 | 21.9149 | 0.0067 | 0.9921 | 45.7875 | 0.0010 | 0.9974 | |
| 318 | 22.4647 | 0.0075 | 0.9944 | 48.7329 | 0.0011 | 0.9983 | |
The fitting parameters of the intra-particle diffusion and Evolich models are shown in Table 3. Intra-particle diffusion is a transport process which describes the movement of species from the bulk of the solution to the solid phase.45 The correlation coefficient (R2) was larger than 0.90, indicating that intra-particle kinetic models could also fit the adsorption process. The line does not pass through the origin, which means that the adsorption of Cr(VI) onto the TW/Fe3O4 composite was controlled by chemisorption coupled with intra-particle diffusion, involving electron sharing or electron transfer.47
| Initial concentration (mg L−1) | T (K) | Intra-particle model | Evolich model | ||||
|---|---|---|---|---|---|---|---|
| kd | C | R2 | α | β | R2 | ||
| 10 | 298 | 0.0840 | 7.2950 | 0.9430 | 2.4696 × 10⁶ | 2.4155 | 0.9910 |
| 308 | 0.8310 | 10.7200 | 0.9320 | 7.1403 × 100 | 0.2410 | 0.9930 | |
| 318 | 0.9810 | 20.6700 | 0.9360 | 4.3934 × 101 | 0.2047 | 0.9910 | |
| 30 | 298 | 0.0650 | 7.9780 | 0.9220 | 1.5283 × 10⁹ | 3.0488 | 0.9960 |
| 308 | 0.8360 | 11.7100 | 0.9000 | 8.3477 × 100 | 0.2355 | 0.9940 | |
| 318 | 1.0720 | 21.4100 | 0.9320 | 3.7918 × 101 | 0.1868 | 0.9930 | |
| 50 | 298 | 0.0490 | 8.4870 | 0.9280 | 3.4964 × 10¹³ | 4.0816 | 0.9820 |
| 308 | 0.5990 | 7.5900 | 0.7900 | 8.5280 × 101 | 0.3114 | 0.9710 | |
| 318 | 1.0950 | 24.1700 | 0.9190 | 5.6834 × 101 | 0.1817 | 0.9930 | |
The Elovich kinetic equation is used to interpret the kinetics of chemisorption on highly heterogeneous sorbents.51 The correlation coefficient (R2) was larger than 0.95, indicating that the Evolich model could also fit the adsorption process well. Chemisorption plays an important role during the adsorption of Cr(VI) onto the TW/Fe3O4 composite.
Herein, the focus of our research is the adsorption process of the Cr(VI) on the TW/Fe3O4 composite. The reduction of Cr(VI) is the subsequent reaction after the Cr(VI) reaches the surface of the TW/Fe3O4 composite. The reduction process may influence the isotherm/kinetics models and belongs to the whole adsorption process. Recently, advanced reduction kinetics have been developed to fit the kinetics process and confirmed the “reduction mechanism”.52,53 Further research is needed in the future.
3.6. Adsorption isotherms
The equilibrium adsorption isotherm is fundamental in describing the interactive behavior between adsorbates and adsorbent, and is important in the design of adsorption systems.54–57 Research into adsorption isotherms is crucially important in the modeling, design, and commercial application of adsorbents.58–60The Langmuir, Freundlich, Temkin and Dubinin–Radushkevich (D–R) isotherms were expressed as the following eqn (10)–(15).
Langmuir:
 | (10) |
Freundlich:
 | (11) |
Temkin:
 | (12) |
Dubinin–Radushkevich (D–R) equation:
| ln(qe) = ln(qm) − βD–Rε2 | (13) |
 | (14) |
 | (15) |
The fitting curves of the different isotherm equations are displayed in Fig. 9.
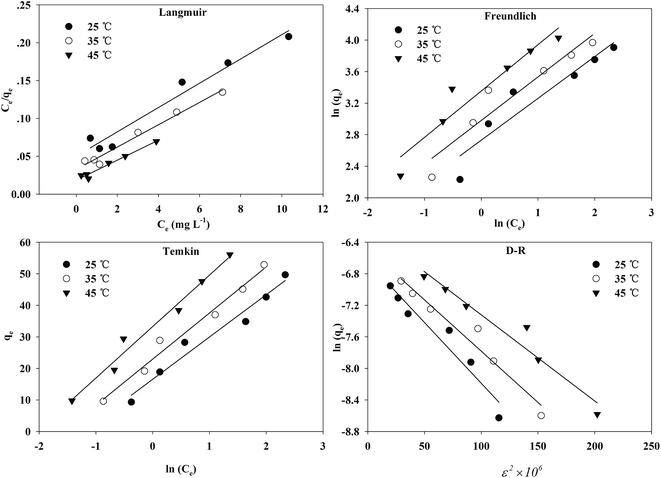 | ||
| Fig. 9 The fitting of Langmuir, Freundlich, Temkin, D–R isotherms for Cr(VI) adsorption onto the TW/Fe3O4 composite. | ||
The adsorption isotherms and fitting results are shown in Table 4. According to the correlation coefficient, Langmuir, Temkin and D–R isotherms could fit the adsorption process well. The maximum adsorption capacity of Cr(VI) by the TW/Fe3O4 composite was 75.76 mg g−1. The maximum adsorption capacity of the TW/Fe3O4 composite is much higher than that of most adsorbents reported in the literature,5 and thus it can be applied as a highly efficient adsorbent to remove trace Cr(VI) from aqueous solution. The Langmuir constant (b) was in the range of 0–1, indicating that the TW/Fe3O4 composite had a good potential to remove Cr(VI). Thus, the adsorption of Cr(VI) onto the TW/Fe3O4 composite related to monomolecular adsorption. With the increase in temperature, the maximum adsorption capacity gradually increased, suggesting that higher temperatures benefit the adsorption process.
| Temperature (°C) | Langmuir | Freundlich | ||||
|---|---|---|---|---|---|---|
| qmax | b | R2 | Kf | n | R2 | |
| 25 | 62.11 | 0.3214 | 0.9609 | 15.3375 | 1.8854 | 0.8876 |
| 35 | 67.57 | 0.4554 | 0.9786 | 19.6957 | 1.8096 | 0.9150 |
| 45 | 75.76 | 0.7174 | 0.9720 | 28.6141 | 1.7010 | 0.9132 |
| Temperature (°C) | Temkin | D–R | |||||
|---|---|---|---|---|---|---|---|
| A | B | R2 | qm | β | E | R2 | |
| 25 | 3.4305 | 13.4120 | 0.9647 | 3.14541 × 10⁻⁵ | 0.0150 | 8.1650 | 0.9330 |
| 35 | 4.7987 | 14.6180 | 0.9795 | 3.6362 × 10⁻⁵ | 0.0130 | 8.7706 | 0.9580 |
| 45 | 7.6963 | 16.2970 | 0.9776 | 5.2102 × 10⁻⁵ | 0.0100 | 10.000 | 0.9500 |
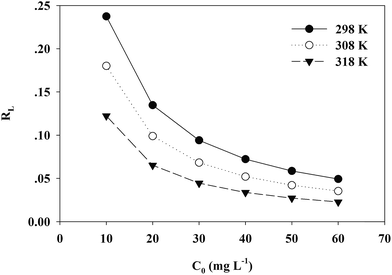
A dimensionless separation factor RL was defined as RL = 1/(1 + C0b).61 The value of RL indicates the shape of the isotherm to be either unfavourable (RL > 1), linear (RL = 1), favourable (0 < RL < 1) or irreversible (RL = 0).62,63 As shown in Fig. 10, RL was lower than 1 in this study and the adsorption was favorable. A higher initial concentration and temperature benefited the adsorption of Cr(VI) onto the TW/Fe3O4 composite.
The Temkin isotherm model assumes that the heat of adsorption decreases linearly rather than logarithmically with coverage and describes the chemisorption interaction with primarily electrostatic interactions. In this study, the correlation coefficient of the Temkin model was larger than 0.95. Thus, electrostatic interaction was an important mechanism between Cr(VI) and the TW/Fe3O4 composite, consistent with the result of the pH effect.
The D–R isotherm could also well describe the adsorption process of Cr(VI) onto the TW/Fe3O4 composite. When Ea is in the range of 1–8 kJ mol−1, physical interaction plays an important role. When Ea is between 8 and 16 kJ mol−1, the main interaction is an ion exchange process. Chemisorption interaction was the main mechanism when Ea ranged from 16 to 40 kJ mol−1.64 In this research, Ea ranged from 8 to 10 kJ mol−1 when the temperature was between 25 and 45 °C. The fitting results showed that the main adsorption mechanism was ion exchange between Cr(VI) and the TW/Fe3O4 composite, coexisting with physical interaction. With an increase in temperature, the increased Ea suggests that the chemisorption interaction became more pronounced.
3.7. Adsorption thermodynamics
In order to better understand the effect of temperature on the adsorption of Cr(VI) on the TW/Fe3O4 composite, the thermodynamic parameters of the adsorption process such as change in standard free energy (ΔG), enthalpy (ΔH), and entropy (ΔS) can be calculated using the eqn (16)–(18).65,66
 | (16) |
ΔG = −RT![[thin space (1/6-em)]](https://www.rsc.org/images/entities/char_2009.gif) ln(K0) ln(K0)
| (17) |
 | (18) |
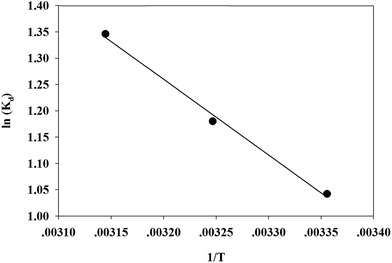
According to the method suggested by Khan and Singh,66 the sorption distribution coefficient K0 for the sorption reaction was determined from the slope of the plot ln(qe/Ce) against Ce at various temperatures and extrapolating to zero Ce. The values of ΔH and ΔS can be obtained from the slope and intercept of a plot of ln![[thin space (1/6-em)]](https://www.rsc.org/images/entities/char_2009.gif) K0 against 1/T and are shown in Fig. 11.
K0 against 1/T and are shown in Fig. 11.
The thermodynamic parameters of Cr(VI) adsorption on the TW/Fe3O4 composite are given in Table 5. The ΔG value was negative for all three considered temperatures, and this suggests that the adsorption was a spontaneous process. As the temperature increases, the ΔG values decrease, indicating that elevated temperatures benefit the adsorption process. The ΔH value was positive and the adsorption process was endothermic. The positive value of ΔS confirms that the randomness of Cr(VI) increased at the solid–solution interface during the adsorption process.
| Temperature (K) | ΔG (kJ mol−1) | ΔH (kJ mol−1) | ΔS (J mol−1 K−1) |
|---|---|---|---|
| 298 | −2.5817 | 11.964 | 48.770 |
| 308 | −3.0214 | ||
| 318 | −3.5593 |
3.8. Concentration of different Cr species under different parameters
The concentrations of different Cr species under various parameters are shown in Fig. 12. It was found that the concentrations of total and hexavalent chromium were not equal, which meant that after the contact between the TW/Fe3O4 composite and Cr(VI) solutions, the Cr(III) concentration rose in solution. This result also confirmed that a chemical redox reaction occurs during the adsorption process.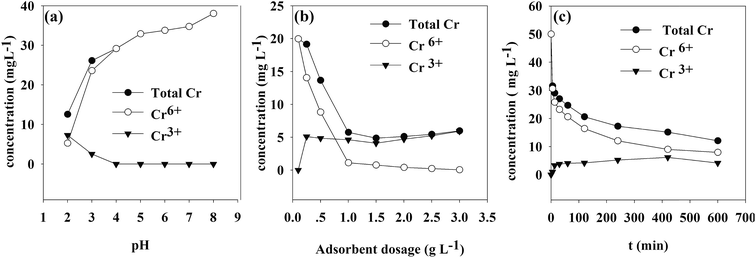 | ||
| Fig. 12 Concentration of total Cr, Cr(VI), Cr(III) under different parameters (a) pH (b) adsorbent mass (c) contact time. | ||
As shown in Fig. 8(a), when the pH was lower than 4, Cr(III) could be detected in the solution. This indicated that Cr(VI) was easily reduced to Cr(III) under acidic conditions. The experimental result was in line with the effect of pH on Cr(VI) removal.
The effect of adsorbent dosage is presented in Fig. 8(b). The experimental conditions were consistent with the effect of dosage on Cr(VI) removal. When the solid–liquid ratio was larger than 0.25, the reduction reaction occurred under acidic conditions. When the solid–liquid ratio was larger than 1, the concentration remained stable because the Cr(VI) was adsorbed onto the TW/Fe3O4 composite and was reduced to Cr(III). Cr(VI) could not be detected in the solution.
The effect of contact time is described in Fig. 8(c). The experimental conditions were equal to those of the adsorption kinetics (initial concentration of Cr(VI) was 50 mg L−1). Cr(III) could be detected in the solution of the adsorption experiment after 5 min. The concentration of Cr(III) increased as the contact time increased. When Cr(VI) was reduced to Cr(III) on the surface of the TW/Fe3O4 composite, part of the Cr(III) was released into solution due to electrostatic repulsion.67
The proportion of reduced Cr was calculated by means of XPS analysis and the results of Fig. 8(c) using formula (19). The results showed that 70% of Cr(VI) was reduced to Cr(III). 30% of the Cr(VI) was adsorbed onto the surface of the TW/Fe3O4 and existed in solution.
 | (19) |
3.9. Desorption and regeneration experiment
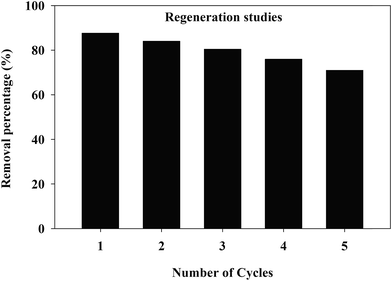
Desorption and regeneration batch experiments were designed to study the recoverable potential of the TW/Fe3O4 composite. The conditions for the adsorption experiments were 50 mg L−1 initial concentration of Cr(VI), 40 mL of solution, adsorbent mass 0.1 g, pH 2, temperature 25 °C, 180 rpm for 10 h. When the adsorption process reached equilibrium, 50 mL of NaOH (0.5 mol L−1) was used to desorb the adsorbent for 2 h. The Cr(VI) was determined by a spectrophotometric method. Then, HCl (0.5 mol L−1) was used to regenerate the absorbent.The Cr(VI) removal rate of the TW/Fe3O4 composite after five recycles of desorption–regeneration is shown in Fig. 13 and the removal rate was still higher at more than 70%, indicating the potential recycling of the TW/Fe3O4 composite, consistent with the measurement of magnetic hysteresis loops (Fig. 4). Desorption of the Cr(VI) from the TW/Fe3O4 composite was favored by weak alkaline conditions68,69 and HCl could be a choice for the regeneration of adsorbent.25,67 Therefore, the TW/Fe3O4 composite has the potential for regeneration and reusability.
3.10. Proposed mechanisms
The mechanism of Cr(VI) removal is not fully understood and involves many models or steps.69–76 The adsorption mechanism of Cr(VI) onto the TW/Fe3O4 composite is a complicated process and multiple interactions coexist. According to the research of Saha and Orvig,70 there are four potential mechanisms explaining Cr(VI) sorption by biosorbents: (a) anionic adsorption, (b) adsorption-coupled reduction, (c) anionic and cationic adsorption and (d) reduction and cationic adsorption. According to an analysis of the above results, the mechanism of Cr(VI) sorption by the TW/Fe3O4 composite involved adsorption-coupled reduction.According to the analysis of the FTIR, functional groups (–OH, C![[double bond, length as m-dash]](https://www.rsc.org/images/entities/char_e001.gif) O and C
O and C![[double bond, length as m-dash]](https://www.rsc.org/images/entities/char_e001.gif) C, C–O, secondary amine groups, C–N) could participate in the adsorption–reduction process. Herein, the oxygen-containing or nitrogen-containing groups played three functions. First, functional groups could adsorb Cr(VI) through surface complexation, an ion exchange process, etc. Second, a functional group could be protonated by the H+ in the solution, especially the amine functional groups. A protonated functional group could reduce Cr(VI) to Cr(III).73,74,77 The Cr(III) was confirmed by the analysis of XPS (Fig. 5) and the difference between total Cr and Cr(VI) (Fig. 13). Third, the functional groups could also bind with Cr(III) through surface complexation, an ion-exchange process, etc. Thus, functional groups of the TW/Fe3O4 composite played an important role during the adsorption–reduction process.
C, C–O, secondary amine groups, C–N) could participate in the adsorption–reduction process. Herein, the oxygen-containing or nitrogen-containing groups played three functions. First, functional groups could adsorb Cr(VI) through surface complexation, an ion exchange process, etc. Second, a functional group could be protonated by the H+ in the solution, especially the amine functional groups. A protonated functional group could reduce Cr(VI) to Cr(III).73,74,77 The Cr(III) was confirmed by the analysis of XPS (Fig. 5) and the difference between total Cr and Cr(VI) (Fig. 13). Third, the functional groups could also bind with Cr(III) through surface complexation, an ion-exchange process, etc. Thus, functional groups of the TW/Fe3O4 composite played an important role during the adsorption–reduction process.
The ion exchange process is also an important mechanism. The concentrations of Ca2+, Mg2+, Na+, K+ in the supernatant were determined and deionized water served as a control. The ion exchange capacities of Ca2+, Mg2+, Na+, K+ were calculated and are presented in Table 6. The sum of ion exchange capacity increased when the Cr(VI) was removed by the TW/Fe3O4 composite. The ion exchange capacity was higher when the initial concentration of Cr(VI) was higher. Ca2+ and K+ ions participate more in the ion exchange process, consistent with previous studies.78 The results also confirm the conclusions of the kinetic and isotherm models.
| Samples | The net amount of released cations (mequiv. g−1) | Sum | |||
|---|---|---|---|---|---|
| Ca2+ | Mg2+ | Na+ | K+ | ||
| a Note: 10 mg L−1 to 25 °C means the concentration of Cr(VI) was 10 mg L−1 and the operating temperature was 25 °C during the adsorption kinetics experiment. | |||||
| 10 mg L−1 to 25 °C | 0.0243 | −0.0015 | −0.0568 | 0.0448 | 0.0109 |
| 30 mg L−1 to 25 °C | 0.0264 | −0.0003 | −0.0505 | 0.1080 | 0.0837 |
| 50 mg L−1 to 25 °C | 0.0259 | 0.0003 | −0.0431 | 0.1714 | 0.1545 |
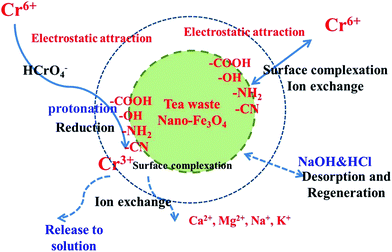
In brief, the adsorption mechanism of Cr(VI) onto the TW/Fe3O4 composite referred to physical adsorption, electrostatic interaction, reduction, ion exchange, surface complexation, etc.
Meanwhile, Cr(VI) in solution had been adsorbed onto the surface of the adsorbent and then reduced to Cr(III) by a heterogeneous redox process under an acid environment (as shown in eqn (20)). A few Fe2+ ions may be oxidized by Cr(VI) although Fe3O4 nanoparticles are relatively stable. The reaction process follows eqn (21).43 The converted Cr(III) was retained by the TW/Fe3O4 composite and part of the Cr(III) was released into solution due to electrostatic repulsion. Some portion of the Cr(III) could be adsorbed onto the TW/Fe3O4 composite by carbon–oxygen groups or weak acid surface groups.79–83
| HCrO4− + 7H+ + 3e− → Cr3+ + 4H2O | (20) |
| 3Fe2+ + CrO42− + 4H2O → Cr3+ + 3Fe3+ + 8OH− | (21) |
In conclusion, the proposed mechanism of Cr(VI) removal by the TW/Fe3O4 composite is as displayed in Fig. 14. The main steps follow: first step, Cr(VI) is adsorbed quickly onto the surface of the TW/Fe3O4 composite due to electrostatic attraction (protonated functional groups or positive Fe3O4 nanoparticles) or an ion exchange process or surface complexation. Second step, some portions of Cr(VI) were reduced to Cr(III). Third step, some Cr(III) was adsorbed onto the surface of the TW/Fe3O4 composite through ion exchange or surface complexation. Last step, part of the Cr(III) was released into solution due to electrostatic repulsion. Then, NaOH and HCl acted as the desorption reagent and regeneration reagent, respectively.
4. Conclusions
In this study, a tea waste/nano-Fe3O4 composite was facilely prepared and used to remove Cr(VI) from aqueous solution. The maximum removal of Cr(VI) by the TW/Fe3O4 composite was observed at pH 2. The adsorption process data was found to best fitted by a pseudo-second-order kinetic model. The maximum adsorption capacity was higher and reached 75.76 mg g−1 based on the Langmuir model. Adsorption of hexavalent chromium ions by the TW/Fe3O4 composite is spontaneous in nature, endothermic, and results in increased randomness at the adsorbent/adsorbate interface, due to an investigation of the thermodynamics. Desorption and regeneration experiments revealed that the TW/Fe3O4 composite had a good potential for recycling. The mechanism of Cr(VI) removal involved an adsorption–reduction process, referring to physical adsorption, electrostatic interaction, reduction, ion exchange, surface complexation, etc. 70% of the Cr(VI) was reduced to Cr(III) in this investigation. Therefore, the TW/Fe3O4 composite could be applied as a novel adsorbent for Cr(VI) removal from industrial wastewater.List of symbols
| bT | Temkin isotherm constant (J mol−1) |
| C0 | Initial Cr(VI) concentration (mg L−1) |
| Ce | Cr(VI) concentration in solution at equilibrium (mg L−1) |
| Ct | Concentration of Cr(VI) at t time (mg L−1) |
| Kf | Freundlich isotherm constant (mg g−1) (mg L−1)−1 |
| k1 | Pseudo-first-order rate constant (L min−1) |
| k2 | Pseudo-second-order rate constant (g mg−1 min−1) |
| kid | Intraparticle diffusion rate constant (mg g−1 min−0.5) |
| K0 | Apparent equilibrium constant |
| m | Amount of adsorbent (TW/Fe3O4) composite (g) |
| qt | Adsorption capacities of Cr(VI) ions at time t (mg g−1) |
| qe | Adsorption capacities of Cr(VI) ions at equilibrium time (mg g−1) |
| qmax | The maximum adsorption capacity based on Langmuir model (mg g−1) |
| qm | Maximum adsorption capacity (mg g−1) in D–R model |
| R | Ideal gas constant, 8.314 J mol−1 K−1 |
| R2 | Coefficient of determination |
| RL | Dimensionless separation factor |
| T | Kelvin temperature (K) |
| V | Volume of Cr(VI) solution (L) |
| 1/n | The heterogeneity of the sorption sites and an indicator of isotherm nonlinearity |
| ΔG | Gibbs free energy (kJ mol−1) |
| ΔH | Enthalpy (kJ mol−1) |
| ΔS | Entropy (J mol−1 K−1) |
| ε | Dubinin–Radushkevich isotherm constant |
| α | The initial adsorption coefficient in Evolich model (mg g−1 min−1) |
| β | The desorption coefficient in Evolich model (g mg−1) |
| βD–R | Dubinin–Radushkevich isotherm constant (mol2 kJ−2) |
Acknowledgements
This study was financially supported by Natural Science Foundation of China (No. 51609001), National Major Water Project (No. 2015ZX07103007) and Anhui Agricultural University Youth Fund Project (No. 2014zr004, jz2015-23).References
- D. Mohan and C. U. Pittman Jr, J. Hazard. Mater., 2006, 137, 762–811 CrossRef CAS PubMed.
- J. Kotaś and Z. Stasicka, Environ. Pollut., 2000, 107, 263–283 CrossRef.
- M. Owlad, M. K. Aroua, W. D. W. Ashri and S. Baroutian, Water, Air, Soil Pollut., 2009, 200, 59–77 CrossRef CAS.
- Y. Liu, C. Luo, G. Cui and S. Yan, RSC Adv., 2015, 5, 54156–54164 RSC.
- T. Khan, M. H. Isa, M. R. Ul Mustafa, H. Yeek-Chia, L. Baloo, T. S. Binti Abd Manan and M. O. Saeed, RSC Adv., 2016, 6, 56365–56374 RSC.
- D. Ding, X. Ma, W. Shi, Z. Lei and Z. Zhang, RSC Adv., 2016, 6, 74675–74682 RSC.
- D. Sud, G. Mahajan and M. P. Kaur, Bioresour. Technol., 2008, 99, 6017–6027 CrossRef CAS PubMed.
- M. M. Zhang, Y. G. Liu, T. T. Li, W. H. Xu, B. H. Zheng, X. F. Tan, H. Wang, Y. M. Guo, F. Y. Guo and S. F. Wang, RSC Adv., 2015, 5, 46955–46964 RSC.
- B. Amarasinghe and R. Williams, Chem. Eng. J., 2007, 132, 299–309 CrossRef CAS.
- S. Çay, A. Uyanık and A. Özaşık, Sep. Purif. Technol., 2004, 38, 273–280 CrossRef.
- H. D. Utomo and K. A. Hunter, Environ. Technol., 2006, 27, 25–32 CrossRef CAS PubMed.
- S. Wan, Z. Ma, Y. Xue, M. Ma, S. Xu, L. Qian and Q. Zhang, Ind. Eng. Chem. Res., 2014, 53, 3629–3635 CrossRef CAS.
- S. S. Ahluwalia and D. Goyal, Eng. Life Sci., 2005, 5, 158–162 CrossRef CAS.
- E. Malkoc and Y. Nuhoglu, J. Hazard. Mater., 2005, 127, 120–128 CrossRef CAS PubMed.
- E. Malkoc and Y. Nuhoglu, J. Hazard. Mater., 2006, 135, 328–336 CrossRef CAS PubMed.
- E. Malkoc and Y. Nuhoglu, Chem. Eng. Sci., 2006, 61, 4363–4372 CrossRef CAS.
- E. Malkoc and Y. Nuhoglu, Sep. Purif. Technol., 2007, 54, 291–298 CrossRef CAS.
- D. Chen, Y. Li, J. Zhang, J. Zhou, Y. Guo and H. Liu, Chem. Eng. J., 2012, 185–186, 120–126 CrossRef CAS.
- J. Liu, Z. Zhao, G. Jiang and C. Ren, Environ. Sci. Technol., 2008, 42, 6949–6954 CrossRef CAS PubMed.
- S. Nethaji, A. Sivasamy and A. Mandal, Bioresour. Technol., 2013, 134, 94–100 CrossRef CAS PubMed.
- C. Su, J. Hazard. Mater., 2016, 32, 48–84 Search PubMed.
- P. Panneerselvam, N. Morad and K. A. Tan, J. Hazard. Mater., 2011, 186, 160–168 CrossRef CAS PubMed.
- A. A. Babaev and T. S. Salimov, Desalin. Water Treat., 2015, 57, 1–13 Search PubMed.
- Y. S. Kang, S. Risbud, J. F. Rabolt and P. Stroeve, Chem. Mater., 1996, 8, 2209–2211 CrossRef CAS.
- C. Ding, W. Cheng, Y. Sun and X. Wang, J. Hazard. Mater., 2015, 295, 127–137 CrossRef CAS PubMed.
- B. Chen, Z. Chen and S. Lv, Bioresour. Technol., 2011, 102, 716–723 CrossRef CAS PubMed.
- E. E. Özbaş, A. Öngen and C. E. Gökçe, Desalin. Water Treat., 2013, 51, 7523–7535 CrossRef.
- H. Eroğlu, S. Yapici, Ç. Nuhoğlu and E. Varoğlu, J. Hazard. Mater., 2009, 163, 607–617 CrossRef PubMed.
- Q. Zhang, X. Han and B. Tang, RSC Adv., 2013, 3, 9924–9931 RSC.
- S. Ni, X. Wang, G. Zhou, F. Yang, J. Wang, Q. Wang and D. He, Mater. Lett., 2009, 63, 2701–2703 CrossRef CAS.
- H. Gu, S. B. Rapole, J. Sharma, Y. Huang, D. Cao, H. A. Colorado, Z. Luo, N. Haldolaarachchige, D. P. Young, B. Walters, S. Wei and Z. Guo, RSC Adv., 2012, 2, 11007–11018 RSC.
- N. Fiol, C. Escudero and I. Villaescusa, Bioresour. Technol., 2008, 99, 5030–5036 CrossRef CAS PubMed.
- W. Cheng, C. Ding, X. Wang, Z. Wu, Y. Sun, S. Yu, T. Hayat and X. Wang, Chem. Eng. J., 2016, 293, 311–318 CrossRef CAS.
- G. Yang, L. Tang, Y. Cai, G. Zeng, P. Guo, G. Chen, Y. Zhou, J. Tang, J. Chen and W. Xiong, RSC Adv., 2014, 4, 58362–58371 RSC.
- E. J. Kim, S. Park, H. J. Hong, Y. E. Choi and J. W. Yang, Bioresour. Technol., 2011, 102, 11155–11160 CrossRef CAS PubMed.
- T. Wang, L. Zhang, C. Li, W. Yang, T. Song, C. Tang, Y. Meng, S. Dai, H. Wang and L. Chai, Environ. Sci. Technol., 2015, 49, 5654–5662 CrossRef CAS PubMed.
- X. Yao, S. Deng, R. Wu, S. Hong, B. Wang, J. Huang, Y. Wang and G. Yu, RSC Adv., 2016, 6, 8797–8805 RSC.
- D. Kołodyńska, R. Wnętrzak, J. Leahy, M. Hayes, W. Kwapiński and Z. Hubicki, Chem. Eng. J., 2012, 197, 295–305 CrossRef.
- X. F. Sun, M. Yue, X. W. Liu, S. G. Wang, B. Y. Gao and X. M. Li, Water Res., 2010, 44, 2517–2524 CrossRef CAS PubMed.
- J. Zhang and P. Zheng, RSC Adv., 2015, 5, 17768–17774 RSC.
- H. L. Ma, Y. Zhang, Q. H. Hu, D. Yan, Z. Z. Yu and M. Zhai, J. Mater. Chem., 2012, 22, 5914–5916 RSC.
- P. Yuan, M. Fan, D. Yang, P. He, D. Liu, A. Yuan, J. Zhu and T. Chen, J. Hazard. Mater., 2009, 166, 821–829 CrossRef CAS PubMed.
- J. Hu, I. M. C. Lo and G. Chen, Water Sci. Technol., 2004, 50, 139–146 CAS.
- S. Chen, Q. Yue, B. Gao and X. Xing, J. Colloid Interface Sci., 2010, 349, 256–264 CrossRef CAS PubMed.
- M. Barkat, D. Nibou, S. Chegrouche and A. Mellah, Chen. Eng. Process, 2009, 48, 38–47 CrossRef CAS.
- Y. S. Ho, J. Hazard. Mater., 2006, 37, 681–689 CrossRef PubMed.
- Y. S. Ho and G. Mckay, Process Biochem., 1999, 34, 451–465 CrossRef CAS.
- S. H. Hasan, K. K. Singh, O. Prakash, M. Talat and Y. S. Ho, J. Hazard. Mater., 2008, 152, 356–365 CrossRef CAS PubMed.
- Y. Sun, C. Ding, W. Cheng and X. Wang, J. Hazard. Mater., 2014, 280, 399–408 CrossRef CAS PubMed.
- C. Dan, L. Yang, Z. Jia, W. Li, J. Zhou, S. Li and G. Qian, J. Hazard. Mater., 2012, 243, 152–160 CrossRef PubMed.
- S. H. Chien and W. R. Clayton, Soil Sci. Soc. Am. J., 1980, 44, 265–268 CrossRef CAS.
- D. Park, Y. S. Yun, H. W. Lee and J. M. Park, Bioresour. Technol., 2008, 99, 1141–1147 CrossRef CAS PubMed.
- I. S. Ng, X. Wu, X. Yang, Y. Xie, Y. Lu and C. Chen, Bioresour. Technol., 2013, 145, 297–301 CrossRef CAS PubMed.
- I. Langmuir, J. Am. Chem. Soc., 1917, 38, 102–105 Search PubMed.
- H. M. F. Freundlich, J. Phys. Chem., 1906, 57, 385–471 CAS.
- M. Temkin and V. Pyzhev, Acta Physicochim. URSS, 1940, 12, 217–222 Search PubMed.
- B. Kavitha and D. Sarala Thambavani, RSC Adv., 2016, 6, 5837–5847 RSC.
- E. Nakkeeran, S. Rangabhashiyam, M. S. G. Nandagopal and N. Selvaraju, Desalin. Water Treat., 2016, 57, 1–14 CrossRef.
- S. Rangabhashiyam, E. Nakkeeran, N. Anu and N. Selvaraju, Res. Chem. Intermed., 2015, 41, 1–20 CrossRef.
- S. Rangabhashiyam and N. Selvaraju, J. Mol. Liq., 2015, 209, 487–497 CrossRef CAS.
- T. W. Weber and R. K. Chakravorti, AIChE J., 1974, 20, 228–238 CrossRef CAS.
- M. Xu, Y. Zhang, Z. Zhang, Y. Shen, M. Zhao and G. Pan, Chem. Eng. J., 2011, 168, 737–745 CrossRef CAS.
- G. Mckay, H. S. Blair and J. R. Gardner, J. Appl. Polym. Sci., 1982, 27, 3043–3057 CrossRef CAS.
- A. H. Chen, S. C. Liu, C. Y. Chen and C. Y. Chen, J. Hazard. Mater., 2008, 154, 184–191 CrossRef CAS PubMed.
- X. Chang, M. Li, Q. Liu, Q. Liu and J. Yao, RSC Adv., 2016, 6, 46879–46888 RSC.
- A. A. Khan and R. P. Singh, Colloids Surf., 1987, 24, 33–42 CrossRef CAS.
- T. Lin, F. Yan, Y. Pang, G. Zeng, J. Wang, Y. Zhou, Y. Deng, G. Yang, C. Ye and J. Chen, Chem. Eng. J., 2014, 254, 302–312 CrossRef.
- C. Gan, Y. Liu, X. Tan, S. Wang, G. Zeng, B. Zheng, T. Li, Z. Jiang and W. Liu, RSC Adv., 2015, 5, 35107–35115 RSC.
- H. Wang, X. Xu, Z. Ren and B. Gao, RSC Adv., 2016, 6, 47237–47248 RSC.
- B. Saha and C. Orvig, Coord. Chem. Rev., 2010, 254, 2959–2972 CrossRef CAS.
- D. Park, Y. S. Yun, H. J. Ji and J. M. Park, Water Res., 2005, 39, 533–540 CrossRef CAS PubMed.
- X. Huang, Y. Liu, S. Liu, X. Tan, Y. Ding, G. Zeng, Y. Zhou, M. Zhang, S. Wang and B. Zheng, RSC Adv., 2016, 6, 94–104 RSC.
- Z. Lei, S. Zhai, J. Lv, Y. Fan, Q. An and Z. Xiao, RSC Adv., 2015, 5, 77932–77941 RSC.
- M.-r. Shang, Y.-g. Liu, S.-b. Liu, G.-m. Zeng, X.-f. Tan, L.-h. Jiang, X.-x. Huang, Y. Ding, Y.-m. Guo and S.-f. Wang, RSC Adv., 2016, 6, 85202–85212 RSC.
- F. Gao, H. Gu, H. Wang, X. Wang, B. Xiang and Z. Guo, RSC Adv., 2015, 5, 60208–60219 RSC.
- Y. Ma, W. J. Liu, N. Zhang, Y. S. Li, H. Jiang and G. P. Sheng, Bioresour. Technol., 2014, 169, 403–408 CrossRef CAS PubMed.
- D. Zhao, X. Gao, C. Wu, R. Xie, S. Feng and C. Chen, Appl. Surf. Sci., 2016, 384, 1–9 CrossRef CAS.
- Q. H. Shen, T. T. Zhi, L. H. Cheng, X. H. Xu and H. L. Chen, Chem. Eng. J., 2013, 228, 993–1002 CrossRef CAS.
- T. Cordero, J. Rodriguez-Mirasol, N. Tancredi, J. Piriz, G. Vivo and J. Rodriguez, Ind. Eng. Chem. Res., 2002, 41, 6042–6048 CrossRef CAS.
- S. Wan, Z. Ma, Y. Xue, M. Ma, S. Xu, L. Qian and Q. Zhang, Ind. Eng. Chem. Res., 2014, 53, 3629–3635 CrossRef CAS.
- J. Rivera-Utrilla and M. Sánchez-Polo, Water Res., 2003, 37, 3335–3340 CrossRef CAS PubMed.
- Y. Nakano, K. Takeshita and T. Tsutsumi, Water Res., 2001, 35, 496–500 CrossRef CAS PubMed.
- Z. Lu, Y. Liu, S. Liu, Y. Yin, G. Zeng, X. Tan, H. Xi, X. Hu, L. Jiang and D. Yang, Bioresour. Technol., 2016, 218, 351–359 CrossRef PubMed.
| This journal is © The Royal Society of Chemistry 2017 |

