 Open Access Article
A highly selective near-infrared fluorescent probe for imaging H2Se in living cells and in vivo†
Fanpeng
Kong
,
Lihong
Ge
,
Xiaohong
Pan
,
Kehua
Xu
*,
Xiaojun
Liu
and
Bo
Tang
*
College of Chemistry, Chemical Engineering and Materials Science, Collaborative Innovation Center of Functionalized Probes for Chemical Imaging in Universities of Shandong, Key Laboratory of Molecular and Nano Probes, Ministry of Education, Shandong Provincial Key Laboratory of Clean Production of Fine Chemicals, Shandong Normal University, Jinan 250014, P. R. China. E-mail: tangb@sdnu.edu.cn; xukehua@sdnu.edu.cn
First published on 28th October 2015
Abstract
Hydrogen selenide (H2Se), a highly reactive Se species, is an important selenium metabolism intermediate involved in many physiological and pathological processes. This compound is of scientific interest with regard to the real-time monitoring of H2Se in living cells and in vivo to understand the anti-cancer mechanism of selenium. However, monitoring H2Se in living cells is still challenging due to the lack of straight forward, highly selective and rapid methods. Here, we developed a novel small-molecule fluorescent probe, NIR-H2Se, for imaging endogenous H2Se. NIR-H2Se exhibited high selectivity toward H2Se over selenocysteine (Sec), H2S and small molecule thiols and was successfully used to image the H2Se content in HepG2 cells during Na2SeO3-induced apoptosis. Increased H2Se content and reduced ROS levels were observed under hypoxic conditions compared to normoxic conditions, which indicated that the cell apoptosis induced by Na2SeO3 under a hypoxic environment is via a non-oxidative stress mechanism. Thus, this probe should serve as a powerful tool for exploring the physiological function of H2Se and Se anticancer mechanisms in a variety of physiological and pathological contexts.
Introduction
Selenium (Se) is an essential trace element for various physiological functions in the human body. Insufficient or excessive Se intake has been associated with a number of diseases.1,2 Importantly, selenium plays a role in cancer prevention and treatment.3 However, the anticancer mechanism for Se is still not fully understood. The effectiveness of Se compounds as anticancer agents is correlated to their chemical form and dose.4 H2Se, a reduced form of selenium, is an important metabolite of dietary Se compounds.5 Endogenous H2Se is generated by reducing selenite via GSH and other reduction systems6 and is involved in many physiological and pathological processes.7 A reliable and rapid method to determine H2Se in vivo must be developed to investigate the physiological function of H2Se and the anticancer mechanism of Se.Fluorescent probes with high sensitivity, good selectivity, and short response times via direct observation are powerful tools for the in vivo detection of biomolecules.8 Several fluorescent probes for detecting Se species were recently reported. Maeda et al. developed the first fluorescent probe, BESThio, to discriminate selenols from their Cys counterparts based on their different nucleophilicity at pH = 5.8.9 Using the recognition group Maeda reported, Fang and Lin exploited probes by adjusting the fluorophore to detect selenols with high selectivity under physiological conditions.10 In addition, Fang et al. developed another novel fluorescent probe (TRFS-green) using a 1,2-dithiolane reporter group to selectively image thioredoxin reductase (TrxR) at pH = 7.4.11 Wu reported a cadmium sulfide (CdS) quantum dot (QD) probe for HSe− ions in aqueous solution.12 However, a small-molecule fluorescent probe for imaging the highly reactive H2Se in living cells and in vivo has not been reported.
Previously, our group discovered that the Se–N bond can be cleaved using sulfhydryl groups and we developed a series of fluorescence methods to monitor thiols and their redox state in living cells.13–15 We subsequently found that the Se–N bond in 2,1,3-benzoselenadiazole (BS) can be specifically broken by selenol via direct nucleophilic addition and we designed a new fluorescent probe (HB) to image endogenous Sec in living cells and in vivo.16 These results inspired us to develop a H2Se fluorescent probe based on the BS group by modifying the probe molecule structure.
Here, we integrated the BS moiety into a near infrared (NIR) merocyanine dye17 to develop a novel small-molecule fluorescent probe for detecting H2Se (NIR-H2Se). NIR-H2Se responds to H2Se rapidly, with a high selectivity over H2S, Sec and biological thiols and was used to successfully image endogenous H2Se in living cells and in vivo. Moreover, we used a radical oxygen species (ROS) probe and found that the H2Se contents increased during HepG2 cell apoptosis induced by Na2SeO3 in a time- and dose-dependent manner, while the ROS level did not change under a hypoxic environment. This probe will provide a powerful tool for investigating the metabolism and antitumor mechanism of Se compounds.
Results and discussion
The syntheses are illustrated in Scheme 1, and the probe and intermediate structures were fully characterized by 1H NMR, 13C NMR, and HRMS. We first examined the spectroscopic properties of this probe and optimized the fluorescence measurement conditions (Fig. S1 and S2, ESI†). NIR-H2Se exhibits an emission maximum at 735 nm with weak fluorescence (Φ = 0.019) in aqueous solutions buffered at physiological pH (10 mM phosphate buffered saline, PBS, pH = 7.4) due to effective fluorescence quenching of the BS via the heavy atom effect of Se. As predicted, the BS moiety in NIR-H2Se reacts selectively with H2Se over Sec, H2S, and small molecule thiols. The HPLC analysis confirmed that the fluorescent product was a diamino product (Scheme 2 and Fig. S3 and S4, ESI†).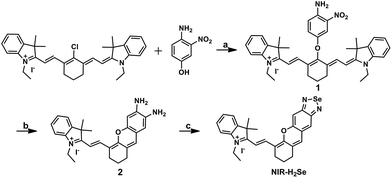 | ||
| Scheme 1 Synthesis of NIR-H2Se. Reaction conditions: (a) NaH, DMF, rt, 73%; (b) SnCl2, HCl, CH3OH, 70 °C, 45%; (c) SeO2, grind, 71%. | ||
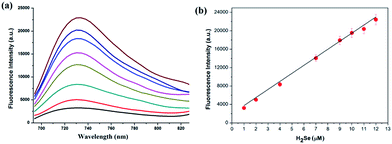
We then tested the fluorescence response to H2Se. Adding H2Se increased the fluorescence intensity of NIR-H2Seca.10-fold (Φ = 0.13, Fig. 1a). There was good linearity between the fluorescence intensities and H2Se concentrations for the range 0–12 μM (Fig. 1b). The regression equation was F = 2096.7 + 1772.3[H2Se] μM with a linear coefficient of 0.9941. The limit of detection was 7.0 nM (standard deviation 3.5%, n = 11).
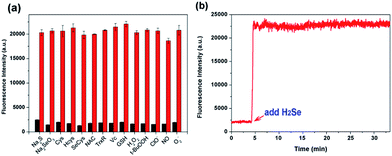
To evaluate the selectivity of NIR-H2Se for H2Se, we measured the fluorescence spectra for the probe with H2Se, H2S and thiols. High concentrations of thiols such as cysteine (Cys), homocysteine (Hcy) and glutathione (GSH) (1 mM for each) produced low fluorescence responses, and NIR-H2Se also gave a negative response for H2S, Sec, Na2SeO3, N-acetyl-L-cysteine (NAC), thioredoxin reductase (TrxR) and vitamin C (Vc). The reactivity of NIR-H2Se towards ROS was then tested. Fig. 2a shows that biologically relevant ROS, including H2O2, −OCl, O2˙−, and ROO˙, did not trigger any fluorescence changes in the probe. Moreover, considering that nitric oxide (NO) may be a potential interfering species,18 the fluorescence response of NIR-H2Se to differing amounts of NO were studied both with and without H2Se. The results indicated that even high NO concentrations (10 equiv.) did not induce an obvious fluorescence change in the detection system. The interference from metal ions and other amino acids were also tested as shown in Fig. S5 and S6.† Collectively, NIR-H2Se selectively recognized H2Se under physiological conditions.
Considering the variable nature and quick metabolism of endogenous H2Se in biological systems, a fast-responding method for H2Se detection is necessary. The response of NIR-H2Se to H2Se was evaluated via a kinetics experiment. The results indicated that the fluorescence intensity immediately increased to its maximum after adding H2Se to the probe solution, which indicated that the probe instantly responds to H2Se (Fig. 2b). In addition, the cytotoxicity of the probe in HepG2 cells was determined via a conventional MTT assay (Fig. S7, ESI†), which indicated that the NIR-H2Se probe exhibited low biotoxicity and could be used as a viable probe for detecting H2Se in biological samples.
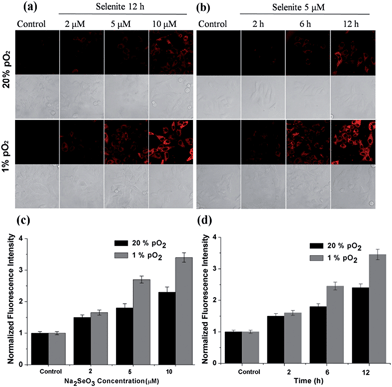
After confirming the high sensitivity, selectivity and rapid response of this probe for H2Se, we explored its applications to image endogenous H2Se in living cells. During these cell imaging experiments, Na2SeO3 was used as the H2Se precursor because sodium selenite can be metabolized to hydrogen selenide (H2Se) via selenodiglutathione (GSSeSG) and glutathione selenenylsulfide (GSSeH).19 HepG2 cells were treated with 2–10 μM Na2SeO3 for 12 h or incubated with 5 μM Na2SeO3 for 2–12 h, as our previous study found that these action concentrations and times of Na2SeO3 can induce HepG2 cell apoptosis.16 After treatment, the cells were loaded with 10 μM of NIR-H2Se. The experimental results are shown in Fig. 3. Higher H2Se contents were observed in hypoxic environments than under normoxic conditions during these parallel experiments.
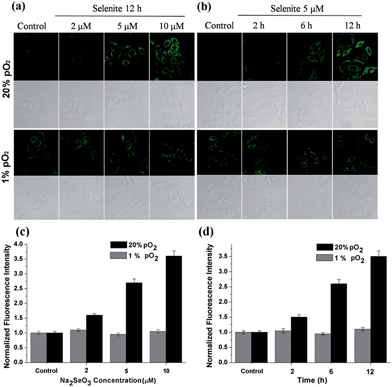
We found that the apparent discrepancies above were related to the aerobic metabolism of H2Se. Under normoxic conditions (20% pO2), H2Se rapidly oxidized to generate a mass of superoxide anion radicals (O2˙−) and an accumulation of reactive oxygen species during the tumor apoptosis process induced by Na2SeO3.20 However, under a hypoxic environment (1% pO2), H2Se cannot quickly metabolize due to the lack of oxygen, which allows H2Se to effectively accumulate. To further confirm our viewpoint, the H2O2 content was evaluated using a H2O2 probe21 for parallel experiments.
HepG2 cells were treated with different Na2SeO3 concentrations for 12 h or incubated with 5 μM Na2SeO3 for differing times before loading with 10 μM of the H2O2 probe. Fig. 4 shows that the H2O2 content gradually increased under normoxic conditions in the HepG2 cells with Na2SeO3 in a time- and dose-dependent manner, while low H2O2 levels were maintained under hypoxic conditions during the parallel experiments. These results indicate that the Na2SeO3 anticancer mechanism is not a ROS-induced apoptosis process under hypoxic conditions. Because hypoxia is a characteristic feature of solid tumors due to the imbalance between new blood vessel formation and rapid cancer cell proliferation,22 these results also imply that the anticancer effect of Na2SeO3 in solid tumors is not owed to oxidative stress.23
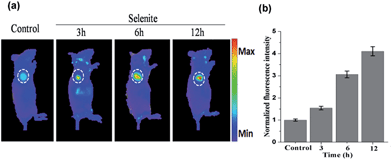
The above results indicate that NIR-H2Se has potential for detecting endogenous H2Se in vivo. To evaluate this proposal, mice bearing subcutaneously implanted tumors grown from murine hepatoma cell line H22 were subcutaneously injected with buffer solutions containing NIR-H2Se (10 μM) and sodium selenite (10 μM), and fluorescence images were then obtained at different times using an in vivo imaging system (IVIS). Fig. 5 shows that the fluorescence signal of the probe was exclusively observed in the tumor region without a background signal, and that the fluorescence intensity increased from 3 h to 12 h post injection. The results indicated that the hypoxic solid tumor generated H2Se from sodium selenite and that the H2Se gradually accumulated.
Conclusions
In summary, we developed a novel small-molecule fluorescent probe, NIR-H2Se, to detect H2Se. The probe rapidly responded to H2Se, exhibited high sensitivity and good selectivity for H2Se over Sec, H2S, ROS and other sulfur-containing species and was successfully used to image endogenous H2Se in living cells and in vivo. Furthermore, we found that normoxic conditions increased the H2O2 content, while the H2Se level rose only slightly during HepG2 cell apoptosis induced by Na2SeO3. However, H2Se accumulated gradually and the ROS remained low in a hypoxic environment. These findings indicate that the anticancer mechanism of Se for hypoxic solid tumors is via non-oxidative stress. We anticipate that the current probe will provide an ideal tool for further studies into the biological functions of H2Se and Se anticancer mechanisms.Experimental
Materials and instruments
All chemicals were available commercially and the solvents were purified by conventional methods before use. Cysteine (Cys), homocysteine (Hcy), glutathione (GSH) and 3-(4,5-dimethylthiazol-2yl)-2,5-diphenyltetrazolium bromide (MTT) were purchased from Sigma Chemical Company. Na2SeO3, N-acetyl-L-cysteine (NAC), thioredoxin reductase (TrxR) and vitamin C (Vc) were purchased from Sigma-Aldrich Co. Ltd. The silica gel (100–200 mesh) was used for the flash chromatography. Cy.7.Cl was synthesized in our laboratory. Sartorius ultrapure water (18.2 MΩ cm) was used throughout the analytical experiments. H2Se was prepared by the reaction of Al2Se3 with H2O in an N2 atmosphere for 30 min at room temperature before use every time.24 H2O2, tert-butylhydroperoxide (TBHP), and hypochlorite (NaOCl) were delivered from 30%, 70%, and 10% aqueous solutions respectively. Nitric oxide (NO) was used from a stock solution prepared by sodium nitroprusside. Superoxide (O2˙−) was delivered from KO2 in DMSO solution or from xanthine oxidase.1H NMR and 13C NMR spectra were determined using 300 MHz and 400 MHz Bruker NMR spectrometers. The mass spectra were obtained using a Bruker maXis ultra-high resolution-TOF MS system. The melting points were measured using a SGW X-4 Melting Point Tester. The fluorescence spectra measurements were performed using an FLS-920 Fluorescence Spectrometer (Edinburgh Instruments, UK). All pH measurements were performed with a pH-3c digital pH-meter (Shanghai Lei Ci Device Works, Shanghai, China) with a combined glass/calomel electrode. The fluorescence images of cells were taken using a TCS SP5 confocal laser scanning microscope with an objective lens (×40). The absorbance was measured using a TRITURUS microplate reader in the MTT assay.
Synthesis and characterization of NIR-H2Se
Fluorescence analysis
Fluorescence spectra were obtained with an FLS-920 Fluorescence Spectrometer (Edinburgh Instruments, UK). After dilution to 10 μM of the probe with 10 mM PBS, various amounts of H2Se were added. The fluorescence intensity was measured at λex/λem = 688/735 nm.Cell culture
HepG2 cells were maintained following the protocols provided by the American Type Tissue Culture Collection. Cells were first grown in a circular Petri dish (60 mm) using high glucose Dulbecco's Modified Eagle Medium (DMEM, 4.5 g of glucose per L) supplemented with 10% fetal bovine serum (FBS), NaHCO3 (2 g L−1) and 1% antibiotics (penicillin/streptomycin, 100 U mL−1). Cultures were maintained in a humidified incubator at 37 °C, in 5% CO2/95% air. One day before imaging, cells were passed and plated on 18 mm glass coverslips in a culture dish. The culture medium was refreshed every 24 h. All cells used were in the exponential growth phase.Confocal imaging
Fluorescence imaging studies were performed with a TCS SP5 confocal laser scanning microscope (Germany Leica Co., Ltd) with an objective lens (×40). Excitation of the H2Se probe-loaded cells at 633 nm was carried out with an argon laser, and emission was collected using a META detector between 650 and 750 nm. Excitation of the H2O2 probe-loaded cells at 532 nm was carried out with an argon laser, and emission was collected using a META detector between 650 and 750 nm. Prior to imaging, the medium was removed. Cell imaging was carried out after washing cells with PBS (pH = 7.4, 10 mM) three times.Animal and tumor models
All animal experiments were carried out according to the Principles of Laboratory Animal Care (People's Republic of China) and the Guidelines of the Animal Investigation Committee, and approved by the local Animal Care and Use Committee. Six- to eight-week-old female Kunmin male mice were purchased from the Shanghai SLAC Laboratory Animal Co., Ltd. During procedures, the mice were anesthetized with inhaled isoflurane. 1 × 10⁶ H22 cells were injected into the enterocoelia of each Kunmin mouse, ascites were formed after 5 or 7 days, which were further used after three passages. Four- to six-week-old nude mice received a subcutaneous injection of 1 × 10⁶ H22 ascite tumor cells into the axillary lateral subcutaneous of their right forelimbs. Tumors were then allowed to grow over a period of 15 to 20 days until reaching 0.5–1.5 cm in diameter.Acknowledgements
This work was supported by 973 Program (2013CB933800), National Natural Science Foundation of China (21535004, 21227005, 21390411, 21275092, 21575081 and 21405098).Notes and references
- (a) C. M. Weekley and H. H. Harris, Chem. Soc. Rev., 2013, 42, 8870–8894 RSC; (b) M. P. Rayman, Lancet, 2012, 379, 1256–1268 CrossRef CAS PubMed.
- (a) M. A. Reeves and P. R. Hoffmann, Cell. Mol. Life Sci., 2009, 66, 2457–2478 CrossRef CAS PubMed; (b) S. Misra, D. Peak, N. Chen, C. Hamilton and S. Niyogi, Comp. Biochem. Physiol., Part C: Pharmacol., Toxicol. Endocrinol., 2012, 155, 560–565 CrossRef CAS PubMed; (c) S. J. Fairweather-Tait, Y. Bao, M. R. Broadley, R. Collings, D. Ford, J. E. Hesketh and R. Hurst, Antioxid. Redox Signaling, 2011, 14, 1337–1383 CrossRef CAS PubMed.
- (a) C. M. Weekley, J. B. Aitken, S. Vogt, L. A. Finney, D. J. Paterson, M. D. de Jonge, D. L. Howard, I. F. Musgrave and H. H. Harris, Biochemistry, 2011, 50, 1641–1650 CrossRef CAS PubMed; (b) A. J. Duffield-Lillico, M. E. Reid, B. W. Turnbull, G. F. Combs Jr, E. H. Slate, L. A. Fischbach, J. R. Marshall and L. C. Clark, Cancer Epidemiol., Biomarkers Prev., 2002, 11, 630–639 CAS; (c) C. M. Weekley, J. B. Aitken, S. Vogt, L. A. Finney, D. J. Paterson, M. D. de Jonge, D. L. Howard, P. K. Witting, I. F. Musgrave and H. H. Harris, J. Am. Chem. Soc., 2011, 133, 18272–18279 CrossRef CAS PubMed.
- (a) C. M. Weekley and H. H. Harris, Chem. Soc. Rev., 2013, 42, 8870–8894 RSC; (b) L. C. Clark, G. F. Combs, B. W. Turnbull, E. H. Slate, D. K. Chalker, J. Chow, L. S. Davis, R. A. Glover, G. F. Graham and E. G. Gross, J. Am. Med. Assoc., 1996, 276, 1957–1963 CrossRef CAS; (c) S. M. Lipp-man, E. A. Klein, P. J. Goodman, M. S. Lucia, I. M. Thompson, L. G. Ford, H. L. Parnes, L. M. Minasian, J. M. Gaziano and J. A. Hartline, J. Am. Med. Assoc., 2009, 301, 39–51 CrossRef CAS PubMed.
- G. Combs and W. Gray, Pharmacol. Ther., 1998, 79, 179–192 CrossRef CAS PubMed.
- M. Wallenberg, E. Olm, C. Hebert, M. Björnstedt and A. P. Fer-nandes, Biochem. J., 2010, 429, 85–93 CrossRef CAS PubMed.
- (a) Z. Veres, L. Tsai, T. D. Scholz, M. Politino, R. S. Balaban and T. C. Stadtman, Proc. Natl. Acad. Sci. U. S. A., 1992, 89, 2975–2979 CrossRef CAS PubMed; (b) R. S. Glass, W. P. Singh, W. Jung, Z. Veres, T. D. Scholz and T. C. Stadtman, Biochemistry, 1993, 32, 12555–12559 CrossRef CAS PubMed; (c) Y. Kobayashi, Y. Ogra, K. Ishiwata, H. Takayama, N. Aimi and K. T. Suzuki, Proc. Natl. Acad. Sci. U. S. A., 2002, 99, 15932–15936 CrossRef CAS PubMed.
- (a) L. Yuan, W. Y. Lin, K. B. Zheng, L. W. He and W. M. Huang, Chem. Soc. Rev., 2013, 42, 622–661 RSC; (b) Z. Q. Guo, S. Park, J. Y. Yoon and I. Shin, Chem. Soc. Rev., 2014, 43, 16–29 RSC; (c) R. Weissleder and V. Ntziachristos, Nat. Med., 2003, 9, 123–128 CrossRef CAS PubMed.
- H. Maeda, K. Katayama, H. Matsuno and T. Uno, Angew. Chem., Int. Ed., 2006, 45, 1810–1813 CrossRef CAS PubMed.
- (a) B. Zhang, C. Ge, J. Yao, Y. Liu, H. Xie and J. Fang, J. Am. Chem. Soc., 2015, 137, 757 CrossRef CAS PubMed; (b) H. Chen, B. Dong, Y. Tang and W. Lin, Chem.–Eur. J., 2015, 21, 11696–11700 CrossRef CAS PubMed.
- L. Zhang, D. Duan, Y. Liu, C. Ge, X. Cui, J. Sun and J. Fang, J. Am. Chem. Soc., 2014, 136, 226–233 CrossRef CAS PubMed.
- C. L. Wu and Y. B. Zhao, Anal. Bioanal. Chem., 2007, 388, 717–722 CrossRef CAS PubMed.
- B. Tang, Y. Xing, P. Li, N. Zhang, F. Yu and G. Yang, J. Am. Chem. Soc., 2007, 129, 11666–11667 CrossRef CAS PubMed.
- K. Xu, M. Qiang, W. Gao, R. Su, N. Li, Y. Gao, Y. Xie, F. Kong and B. Tang, Chem. Sci., 2013, 4, 1079–1086 RSC.
- B. Tang, L. Yin, X. Wang, Z. Chen, L. Tong and K. Xu, Chem. Commun., 2009, 45, 5293–5295 RSC.
- F. Kong, B. Hu, Y. Gao, X. H. Pan, F. Huang, Q. Zheng, H. Chen and B. Tang, Chem. Commun., 2015, 51, 3102–3105 RSC.
- (a) L. Yuan, W. Lin, S. Zhao, W. Gao, B. Chen, L. He and S. Zhu, J. Am. Chem. Soc., 2012, 134, 13510–13523 CrossRef CAS PubMed; (b) H. Chen, W. Lin and L. Yuan, Org. Biomol. Chem., 2013, 11, 1938–1941 RSC; (c) J. A. Richard, Org. Biomol. Chem., 2015, 13, 8169–8172 RSC; (d) H. Chen, W. Lin, H. Cui and W. Jiang, Chem.–Eur. J., 2015, 21, 733–745 CrossRef CAS PubMed.
- (a) H. Kojima, N. Nakatsubo, K. Kikuchi, S. Kawahara, Y. Kirino, H. Nagoshi, Y. Hirata and T. Nagano, Anal. Chem., 1998, 70, 2446–2453 CrossRef CAS PubMed; (b) Y. Gabe, Y. Urano, K. Kikuchi, H. Ko-jima and T. Nagano, J. Am. Chem. Soc., 2004, 126, 3357–3367 CrossRef CAS PubMed; (c) E. Sasaki, H. Kojima, H. Nishimatsu, Y. Urano, K. Kikuchi, Y. Hirata and T. Nagano, J. Am. Chem. Soc., 2005, 127, 3684–3685 CrossRef CAS PubMed.
- (a) H. E. Ganther, Biochemistry, 1971, 10, 4089–4098 CrossRef CAS PubMed; (b) M. Wallenberg, E. Olm, C. Hebert, M. Björnstedt and A. P. Fernandes, Biochem. J., 2010, 429, 85–93 CrossRef CAS PubMed; (c) S. J. Fairweather-Tait, Y. Bao, M. R. Broadley, R. Collings, D. Ford, J. E. Hesketh and R. Hurst, Antioxid. Redox Signaling, 2011, 14, 1337–1383 CrossRef CAS PubMed; (d) M. Björnstedt, S. Kumar and A. Holmgren, J. Biol. Chem., 1992, 267, 8030–8034 Search PubMed; (e) S. Kumar, M. Björnstedt and A. Holmgren, Eur. J. Biochem., 1992, 207, 435–439 CrossRef CAS PubMed; (f) M. Björnstedt, M. Hamberg, S. Kumar, J. Xue and A. Holmgren, J. Biol. Chem., 1995, 270, 11761–11764 CrossRef.
- L. Yan and J. E. Spallholz, Biochem. Pharmacol., 1993, 45, 429–437 CAS.
- (a) N. Karton-Lifshin, E. Segal, L. Omer, M. Portnoy, R. Satchi-Fainaro and D. Shabat, J. Am. Chem. Soc., 2011, 133, 10960–10965 CrossRef CAS PubMed; (b) X. Pan, X. Wang, L. Wang, K. Xu, F. Kong and B. Tang, Anal. Chem., 2015, 87, 7092–7097 CrossRef CAS PubMed.
- (a) P. Vaupel, F. Kallinowski and P. Okunieff, Cancer Res., 1989, 49, 6449–6465 CAS; (b) H. Harada, Nat. Commun., 2012, 3, 783 CrossRef PubMed; (c) D. Hanahan and R. A. Weinberg, Cell, 2000, 100, 57–70 CrossRef CAS PubMed; (d) M. C. Hung, G. B. Mills and D. Yu, Nat. Med., 2009, 15, 246–247 CrossRef CAS PubMed.
- (a) N. S. Rajasekaran, P. Connell, E. S. Christians, L.-J. Yan, R. P. Taylor, A. Orosz, X.-Q. Zhang, T. J. Stevenson, R. M. Peshock, J. A. Leopold, W. H. Barry, J. Loscalzo, S. J. Odelberg and I. J. Benjamin, Cell, 2007, 130, 427–439 CrossRef CAS PubMed; (b) V. M. Labunskyy, B. C. Lee, D. E. Handy, J. Loscalzo, D. L. Hat-field and V. N. Gladyshev, Antioxid. Redox Signaling, 2011, 14, 2327–2336 CrossRef CAS PubMed.
- (a) C. Mealli, S. Midollini and L. Sacconi, Inorg. Chem., 1978, 17, 632–637 CrossRef CAS; (b) V. V. Matylitsky, A. Shavel, N. Gaponik, A. Eychmüller and J. Wachtveitl, J. Phys. Chem. C, 2008, 112, 2703–2710 CrossRef CAS.
Footnote |
| † Electronic supplementary information (ESI) available: The NMR and HR MS spectra of NIR-H2Se, HPLC analysis of the reaction of the probe and H2Se, and other materials. See DOI: 10.1039/c5sc03471j |
| This journal is © The Royal Society of Chemistry 2016 |


