A comprehensive review of sodium layered oxides: powerful cathodes for Na-ion batteries
Man Huon
Han
a,
Elena
Gonzalo
a,
Gurpreet
Singh
a and
Teófilo
Rojo
*ab
aCICenergigune, Parque Tecnológico de Álava, Albert Einstein 48, ED.CIC, 01510, Miñano, Spain. E-mail: trojo@cicenergigune.com; Tel: +34 945297108
bDepartamento de Química Inorgánica, Universidad del País Vasco UPV/EHU, P.O. Box. 644, 48080, Bilbao, Spain. E-mail: teo.rojo@ehu.es; Fax: +34 946013500; Tel: +34 946012458
First published on 18th November 2014
Abstract
The room temperature Na-ion secondary battery has been under focus lately due to its feasibility to compete against the already well-established Li-ion secondary battery. Although there are many obstacles to overcome before the Na-ion battery becomes commercially available, recent research discoveries corroborate that some of the cathode materials for the Na-ion battery have indeed indisputable advantages over its Li-ion counterparts. In this publication, a comprehensive review of layered oxides (NaTMO2, TM = Ti, V, Cr, Mn, Fe, Co, Ni, and a mixture of 2 or 3 elements) as a viable Na-ion battery cathode is presented. Single TM systems are well characterized not only for their electrochemical performance but also for their structural transitions during the cycle. Binary TM systems are investigated in order to address issues regarding low reversible capacity, capacity retention, operating voltage, and structural stability. As a consequence, some materials already have reached an energy density of 520 mW h g−1, which is comparable to that of LiFePO4. Furthermore, some ternary TM systems retained more than 72% of their capacity along with over 99.7% Coulombic efficiency for 275 cycles. The goal of this review is to present the development of Na layered oxide materials in the past as well as the state of the art today in order to emphasize the compatibility and durability of layered oxides as powerful candidates for Na-ion battery cathode materials.
Broader contextIn order to fulfil today's energy demand, a secondary battery beyond the Li-ion battery must be considered especially for large grid systems. Recently, the Na-ion battery is being focused on for its possibility to replace the Li-ion battery because of the economical aspects and availability of intercalation elements. This article provides a comprehensive overview of Na layered oxides as viable cathodes for the Na-ion battery that has already demonstrated economic advantage, large capacities, and ability to cycle for a long term. Although some aspects remain challenging, recent discoveries strongly support the feasibility of Na layered oxides as powerful candidates for Na-ion batteries. |
1. Introduction
Rapidly growing advanced technology is a main theme in the 21st century where everyday life depends on many electronic gadgets that require smaller and more powerful energy storage devices in every new generation. Naturally, the development of Li-ion batteries since the first commercialization in 1991![[thin space (1/6-em)]](https://www.rsc.org/images/entities/char_2009.gif) 1 has been the main focus because of its high energy density and almost every portable device today is operated by various forms of Li-ion batteries. Over the decades the huge commercial success of Li-ion batteries leads to even more investments in Li-ion battery research in order to improve the energy density, safety and manufacturing cost of fully functional units. However recently much attention has been shifted to the Na-ion battery,2–11 because of the cost effectiveness and geographical distribution of Na. Theoretically speaking, the Na-ion battery may not reach the energy density of the Li-ion battery because Na is more than 3 times heavier than Li and the standard electrochemical potential of Na (2.71 V) is lower than Li (3.04) with respect to SHE. Therefore, more suitable applications of the Na-ion battery would be expected in the presence of a large grid support where the operation cost and longevity of the battery are more important aspects of a whole system.
1 has been the main focus because of its high energy density and almost every portable device today is operated by various forms of Li-ion batteries. Over the decades the huge commercial success of Li-ion batteries leads to even more investments in Li-ion battery research in order to improve the energy density, safety and manufacturing cost of fully functional units. However recently much attention has been shifted to the Na-ion battery,2–11 because of the cost effectiveness and geographical distribution of Na. Theoretically speaking, the Na-ion battery may not reach the energy density of the Li-ion battery because Na is more than 3 times heavier than Li and the standard electrochemical potential of Na (2.71 V) is lower than Li (3.04) with respect to SHE. Therefore, more suitable applications of the Na-ion battery would be expected in the presence of a large grid support where the operation cost and longevity of the battery are more important aspects of a whole system.
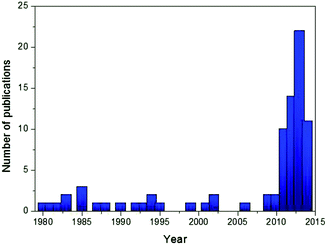
Among many cathode candidates, layered oxides (NaTMO2, TM = Ti, V, Cr, Mn, Fe, Co, Ni, and a mixture of 2 or 3 elements) offer many advantages due to their simple structures, high capacities, and ease of synthesis. As seen in Fig. 1, a dramatic increase in the number of literature studies published in scientific journals in recent years regarding Na layered oxides reflects particular interest by the scientific community. The feasible electrochemistry was already demonstrated using single TM layered oxides during the 1980s,12–19 although the initial investigations resulted in poor specific capacity and low capacity retention which later were proved to be due to poor conditions of electrolyte, equipment, etc. Over the years, the substitution of electrochemically active or inactive elements into oxide layers, which has been extensively explored during and after the year 2010, has proven to be a versatile approach to address concerns regarding low reversible capacity, poor capacity retention, low operating voltage and structural instability. Incorporating electrochemically active multiple elements activates the redox reaction at a target voltage in order to achieve a smoother charge–discharge profile and higher operating voltage, and utilize more stable de/intercalation reactions. Incorporating a small mole fraction of electrochemically inactive element into an oxide layer could stabilize oxide layers, resulting in better long term cyclability although the amount of Na de/intercalation is reduced by substitution.
Some of the best specific capacities have been achieved with binary TM systems,20 which illustrated that an equivalent or even larger energy density compared to commercially available Li-ion cathodes could be possible with Na layered oxides. Electrochemical Li–Na ion exchange of Li-rich layered oxides showing capacity as high as 200 mA h g−1,21,22 excellent capacity retention over a long term cycling achieved by structurally stabilized layered oxides,23 and successful demonstration of full cells utilizing hard carbon as the anode24,25 all contributed to the development of the idea of commercial Na-ion batteries. Probably increasing the average operating voltage is one of the biggest challenges remaining today although some of the substituted systems exhibited the potential to address this issue in the near future.26
2. Structure and nomenclature
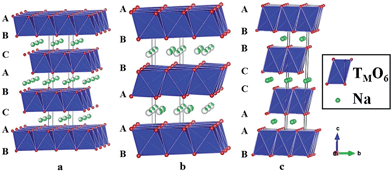
Layered oxides of general formula NaxTMO2 are composed of repeating sheets of TMO6 layers with Na ions being sandwiched in between the oxide layers. Typical Na layered oxides can be synthesized in O3-, P2-, and P3-phases depending on the surrounding Na environment and the number of unique oxide layer packings.27 The letter indicates the environment where Na is located (O: octahedral, P: prismatic) and the number indicates the number of unique interlayers that are surrounded by different oxide layers. The use of prime (′) indicates a distorted phase. In the O3-phase, mainly known to occur when 0.7 ≤ x ≤ 1, oxide layer stacking follows the ABCABC pattern and all Na shares one edge and one face (Fig. 2a). In the P2-phase, mainly known to occur when x ≈ 0.7, oxide layer stacking follows the ABBA pattern and all Na shares either entirely edge or entirely face (Fig. 2b). In the P3-phase, mainly known to occur when x ≈ 0.5, oxide layer stacking follows the ABBCCA pattern and all Na shares one face with a TMO6 octahedron and three edges with three TMO6 octahedra (Fig. 2c).Electrochemical behaviours are heavily influenced by the structure of the phase not only because of the amount of Na in the pristine state but also due to the stability of each layer and kinetics affected by the surrounding environment of Na. For example, the O3-phase normally undergoes a series of phase transitions due to slab-gliding during the electrochemical cycling.28 Generally speaking, a better overall electrochemistry is achieved with the P2- than the O3-phase at or beyond the 2nd cycle because of the low diffusion barrier and high ionic conductivity5,29,30 although the O3-phase normally exhibits a much higher 1st charge capacity because of higher Na contents in the pristine state. Also, the P2-phase is considered to be structurally more stable than the O3-phase because the O3-phase may undergo a series of slab gliding during the de/intercalation process at room temperature. However, a recent study showed that the transition from P2 to O2 is also possible if an extensive amount of Na is deintercalated from the host structure,31 which implies the structural instability of layered oxides at a deep charge state.
3. Single TM systems: NaxTMO2
Single TM systems are mainly studied for obtaining feasible electrochemistry, and each TM element shows quite unique electrochemical performance regarding reversible capacity, capacity retention, voltage range, and cyclic profile because kinetics involved in the electrochemical process are heavily influenced by the crystallographic phase, structural stability, spin state, electron localization, etc. However, some of the unary systems exhibit excellent reversible electrochemistry in a fairly high voltage range with good kinetics, and are the basis of other complex systems.3.1 NaxTiO2
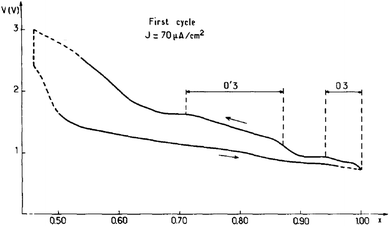
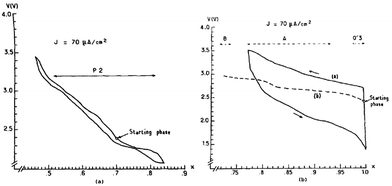
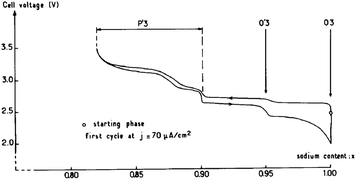
The focus of the initial studies on sodium titanates was to decrease the operating electrochemical potential window because of the possible oxidation of propylene carbonate by highly oxidizing properties of transition metals such as Cr, Co or Ni.15 Reversible sodium de/intercalation was observed only within 0.7 ≤ x ≤ 1 using NaClO4 in PC as an electrolyte, and irreversible capacity loss along with 2D to 3D structural transition was observed for x < 0.7. During the charging process, the irreversibility is expected due to the migration of the titanium ions into the interlayer space through the triangular oxygen window, which leads to an increase in polarization because such a process requires high energy. Due to the highly reducing properties of NaTiO2, slow reduction of the liquid electrolyte was also observed and a fully sodiated phase could not be possible during the discharge process even though the integrity of the structure is maintained up to x ≈ 0.7. A small monoclinic distortion (O′3) from the ideal O3-phase occurred in the slightly sodium deficient phase (Fig. 3).3.2 NaxVO2
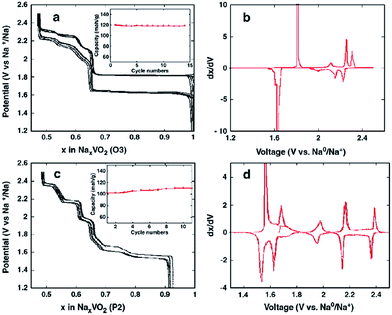
Two phases of sodium vanadium oxide, NaVO2 and Na0.7VO2 synthesized by a solid-state reaction, have been studied for their structure and electrochemistry.32 O3-phase NaVO2 forms a distorted monoclinic structure while P2-phase Na0.7VO2 crystallizes with P63/mmc space group symmetry. Despite the multiple plateau behavior, the charge–discharge curves of both phases show a highly reversible electrochemical process (∼0.5Na) with the P2-phase having less polarization than the O3-phase (Fig. 4a and c) within the voltage range of 2.4–1.2 V at C/20. The derivative curves of both phases (Fig. 4b and d) are significantly different, indicating that the de/intercalation mechanisms are different.In addition, the in situ XRD study of P2-phase Na0.7VO2 revealed that the phase remains stable for the whole range while undergoing a series of complex cell parameter evolutions.
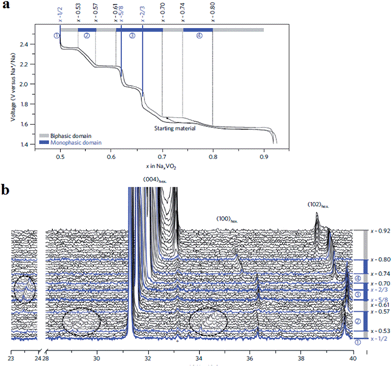
More detailed structural change of P2-phase Na0.71VO2 has been investigated by cycling within the voltage range of 2.5–1.4 V at C/100 (reversible capacity of 110 mA h g−1 and small polarization) while monitoring the phase transition using the in situ XRD technique.33,34 The studied voltage window limit lies in between the anode and cathode for sodium ion batteries and therefore the implementation of such materials as electrodes is difficult to be realized or restricted to anodes for high voltage sodium ion cathodes. Four biphasic regions and three monophasic domains are displayed in the 0.5 ≤ x ≤ 0.9 range while three ordered phases at x = 1/2, 5/8, and 2/3 appeared, and clear indication of superstructures or modulated structures is evidenced by extra peaks in Fig. 5.
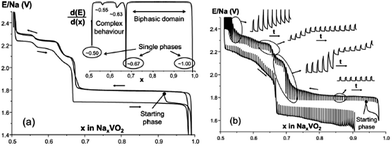
In the meantime, O3-phase NaxVO2 obtained by chemically reducing NaVO3 in an H2 atmosphere35 has shown a similar phase transition behavior to that of the directly synthesized O3-phase. As seen in Fig. 6a, single phases at x ≈ 0.5, 0.67, and 1.0 are observed during the cycling, and significant polarization along with not fully relaxed states at particularly around x ≈ 0.5 and 0.67 (Fig. 6b) was recognized even after a long relaxation which implies low kinetics. The difference in the polarization between the O3 and P2 phases could be considered due to the different Na+ ion diffusion mechanism within the crystal structure. In the O3 type structure Na+ ions move through the interstitial tetrahedral site, which is difficult for the larger Na+ ion, whereas in the case of the P2 type structure Na+ ions are expected to pass through a lower diffusion barrier. The reversible capacity reached 126.4 mA h g−1 within the voltage range of 2.5–1.4 V at C/100.
3.3 NaxCrO2
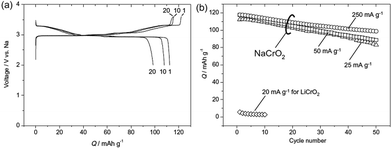
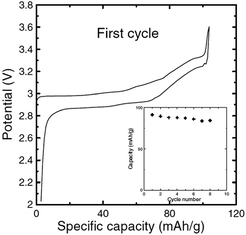
Electrochemistry of NaxCrO2 was investigated as early as 1982 where only 0.15Na could be reversibly cycled.13 However, reinvestigation of the same material revealed that approximately 120 mA h g−1 discharge capacity (∼0.48Na) could be achieved with a nearly flat voltage profile at 3 V within the voltage range of 3.6–2.0 V at a current density of 25 mA g−1 (Fig. 7a) while the Li analogue does not exhibit much of electrochemistry except the 1st charge capacity of 55 mA h g−1.36 The rate capability study (Fig. 7b) showed that at higher current density, the reversible capacity and the capacity retention improved, which is speculated to be due to an accelerated oxidative decomposition of the electrolyte solution at low current density.In order to show the feasibility of Cr containing layered oxides as possible cathodes for Na-ion batteries, the reactivity of NaxCrO2 against the electrolyte and its thermal stability have been investigated.37 While undergoing phase transitions of O3(hexagonal)–O3(monoclinic)–P3(monoclinic) the pristine material delivered a capacity of approximately 110 mA h g−1 within the voltage range of 3.6–2.0 V at a current density of 25 mA g−1 (Fig. 8).
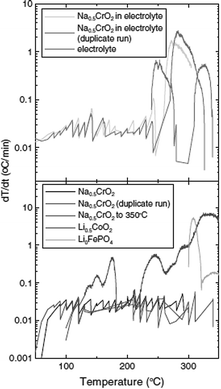
The self-heating rate vs. temperature plot of Na0.5CrO2 (a partially charged product) in EC–DEC solvent exhibited no measurable exothermic heat in the temperature range of 50–350 °C as seen in Fig. 9 although Li0.5CoO2 and Li0FePO4 showed reactivity at 120 °C and 300 °C, respectively. The high stability of Li0FePO4 is considered to be due to the strong bond between the O2− and P5+ but still some reactivity has been observed at high temperature. ARC (accelerated rate calorimetry) with solvent and TGA experiments for Na0.5CrO2, in which no mass loss was observed below 400 °C, confirmed little or no side reaction. On the basis of the XRD and ARC experiments the following reaction mechanism has been proposed:
Furthermore, a carbon coating strategy has been incorporated to improve the electrochemical performance of the NaCrO2 cathode.38 The electron microscopy study revealed homogeneous carbon coated particles of NaCrO2 along with a large amount of carbon trapped in between the particles. With smaller polarization, the carbon coated cathode delivers the charge–discharge capacity of 135/116 mA h g−1 at a current density of 5 mA g−1. In the meantime, the naked cathode delivers 125/106 mA h g−1 at a similar current density while having the same shape of the cyclic profile (Fig. 10a). Evidenced by anodic and cathodic peaks being closer to each other and having better symmetry in CV (Fig. 10b), the carbon coated cathode exhibits better reversibility and faster diffusion. Also, the carbon coated cathode maintains superior capacity retention by losing only 0.16% per cycle while the naked cathode loses 0.32% per cycle (Fig. 10c).
It is suggested that the improved electrochemical performance is related to the (1) suppression of the side reaction, (2) slowing down of the SEI formation, and (3) increased electronic conductivity as seen in Li-ion battery materials.
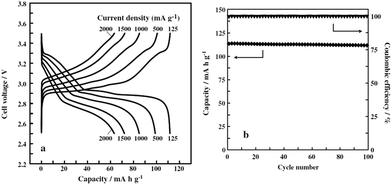
The development of the sodium ion battery has followed the footprints of the lithium ion battery development and in this regard commonly used organic electrolytes such as NaClO4 or NaPF6 in carbonate based solvents are usually studied, which are similar to their lithium synonymous LiClO4 or LiPF6. However such electrolytes are considered to be highly volatile and flammable and hence pose a safety risk. Therefore to overcome the drawbacks of the organic based electrolytes, the intermediate temperature ionic liquids have been studied. The electrochemical performance of NaCrO2 has also been tested in ionic liquids, NaFSA–KFSA (FSA: bis(fluorosulfonyl)amide) at 363 K.39 The charge–discharge profile (Fig. 10a) exhibits a large specific capacity of 113 mA h g−1 within the voltage range of 3.5–2.5 V at a current density of 125 mA g−1. As evidenced by ex situ XRD, the pristine material undergoes a series of phase transitions, O3–O′3–P′3 during the cycling. The capacity is maintained at 63 mA h g−1 for a high current density of 2000 mA g−1 (Fig. 11a). The excellent cycling performance, approximately 98% capacity retention and 99.6% Coulombic efficiency at the 100th cycle at a current density of 125 mA g−1, clearly indicates the good stability of NaCrO2 at intermediate temperatures (Fig. 11b).
3.4 NaxMnO2
NaxMO2, one of the earliest and most characterized layered oxides,17 is metallic or semiconducting in nature depending on the M–M bond distance and the d orbital overlapping which is a critical factor to determine the kinetics of the system. NaxMnO2 can be categorized into two different types of structures. 3D structures (x = 0.4 and 0.44) and 2D structures (x = 1.0 and 0.7). The 3D or tunnel structure is investigated for many aspects,40–44 especially for aqueous electrolytes. However, it will not be focused here because it is out of scope of this review. Among the 2D phases three different structures have been observed viz. Na0.7MnO2+y (categorized as P2), α-NaMnO2 and β-NaMnO2 depending on the synthesis conditions and stoichiometry. α-NaMnO2 can be indexed to monoclinic while β-NaMnO2 can be indexed to the orthorhombic phase.45 In high temperature (900 °C) orthorhombic β-NaMnO2, MnO2 sheets consist of two stacks of edge-sharing MnO6 octahedra. When tested electrochemically only 0.22 Na could be reversibly cycled in α and 0.15 Na can be cycled in β-NaMnO2.17 Low conductivity of Na+ ions causes a high polarization observed in α-NaMnO2. Further the Jahn–Teller effect decreases the Na+ diffusion coefficient even more. Low polarization in β-NaMnO2 (not shown) compared to α-NaMnO2 could be due to the observed structural differences.For P2-phase Na0.7MnO2, all the electrochemical studies have been performed on the oxygen rich hexagonal phases. A solid solution is identified in the range of 0.45 ≤ x ≤ 0.85 and the P2-phase is maintained during this entire range of electrochemical de/intercalation above 2.0 V (Fig. 12a). The hopping mechanism (Mn3+ ↔ Mn4+) is responsible for the conduction in NaxMnO2. Further the Jahn–Teller effect of Mn3+ increases the electronic localization and a lower diffusion coefficient results due to the Na+/e− binding.17,46
A close correlation between the defect structure of Na0.7MnO2 and its electronic properties with the electrochemical performance reveals that deviation from the ideal stoichiometry is highly dependent on the synthesis conditions especially temperature and the partial oxygen pressure.18 Thermogravimetric and thermoelectric power characterizations of the defect structure show that the most probable structural defects are due to the occupancy of some of the sodium sites by the manganese. This leads to the defective structure in both the Na and Mn–O sublattices. This deviation from the ideal stoichiometry in the Mn–O sublattice introduces donor states having ionization energy ≈1 eV. Two different samples were studied electrochemically where it has been shown that Na0.7MnO2.02 and Na0.7MnO2.18 can insert 0.04 and 0.11 moles of Na respectively.
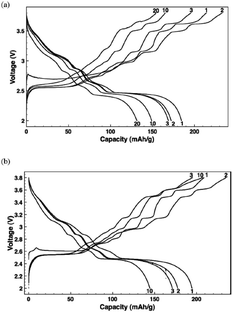
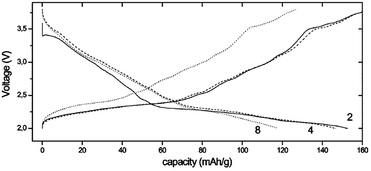
Recently, the electrochemical performance of monoclinic α-NaMnO2 has been reinvestigated,47 and the charge–discharge capacity during the 1st cycle reached 210 mA h g−1 and 197 mA h g−1 respectively within the voltage range of 3.8–2.0 V at C/10 (Fig. 13a), which decreased to 165 and 149 mA h g−1 after 10 cycles. In this study it has been shown that 0.7 Na can be deintercalated up to 3.5 V, which is much higher than α-NaMnO2 studied previously. Even though the exact reasons for such abnormality are not clear, the use of different electrolytes (NaPF6 in EC–DMC in the present case) has been proposed as one of the possible reasons.
When the cell is charged up to 4.2 V, additional charge capacity, mainly due to decomposition of the electrolyte, is obtained. The phase changes in NaMnO2 during the cycling are attributed to Na+ vacancy ordering or transitions involving the gliding of metal oxygen planes.
P2-phase Na0.6MnO2 with hexagonal crystal structure has been further studied for sodium ion battery cathodes using a PTFE based binder and graphite for cathode mix in conjunction with 1 M NaClO4 in PC as electrolytic solution.48 As seen in Fig. 14, the similar shape of charge and discharge curves indicates a quasi-reversible de/intercalation process and the discharge capacity reaches 140 mA h g−1 within the voltage range of 3.8–2.0 V at a current density of 0.1 mA cm−2. However, due to the severe volume changes during the de/intercalation process, the structure collapses after few cycles.
In addition, the distortion in the NaxMnO2 structures is due to the high spin Mn3+ Jahn–Teller active ions. The structural investigations regarding Li, Ni and Co doped NaxMnO2 reveal that the substitution of Li, Ni and Co leads to the orthorhombic or ideal P2 structure and exposing the sample to air further reduces the degree of distortion.49 Dopants such as Li, Co and Ni effectively suppress the Jahn–Teller distortion in the structure and hence lead to the ideal undistorted P2 phase even at lower synthesis temperature. Water plays a critical role in the stability of the P2 structure. Exposed and dried Na0.7MnO2 samples have a monoclinic and orthorhombic distortion, respectively, but Na0.7Mn0.85M0.15O2 [M = Co, Ni] has orthorhombic distortion under both dry and air exposed conditions. Since the lattice parameters did not change drastically after exposing to air, which is expected if water is intercalated between the layers, therefore it is expected that the filling of the vacancies by oxygen and empty sodium sites by the proton could lead to the changes that have been observed.49 Weakly substituted samples decompose after exposure to boiling water, however heavily substituted samples show comparatively less changes.
In an attempt to increase the electrochemical performance, a nanoplate of Na0.7MnO2 has been synthesized using a hydrothermal method.50 The nanoplate with uniform size distribution and an average length of about 500 nm along with a width of about 200 nm undergoes a multiple redox process during the cycling, and the CV curves for the first 10 cycles overlap with each other very well except for the 1st cycle, which means that the charge–discharge process after the 2nd cycle is highly reversible. With a small irreversible capacity loss during the 1st discharge process, the capacity reaches 163 mA h g−1 within the voltage range of 4.5–2.0 V at a current density of 20 mA g−1.
The discharge capacity is maintained at approximately 150 mA h g−1 after 10 cycles at a current density of 40 mA g−1 and a good rate capability of 125 mA h g−1 discharge capacity at a current density of 180 mA g−1 along with the ability to regain a similar discharge capacity when reducing the current density indicates excellent kinetics, indicated by the rate capability experiment.
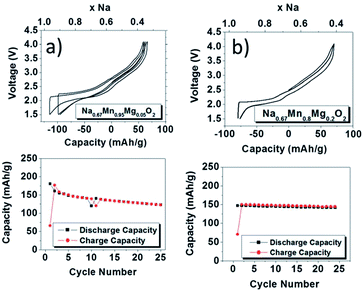
In an effort to demonstrate a positive effect of partially substituting electrochemically inactive elements for transition metals, Mg2+ substituted P2-phase Na0.67Mn1−xMgxO2 (0 ≤ x ≤ 0.2) has been investigated where substitution of a small amount of Mn (x = 0.05) improves the overall performance without compromising much on the capacity.51 The charge–discharge profiles became smoother as more Mg2+ is substituted for both slowly cooled (Fig. 15a and b) and quenched samples (not shown here) because substitution of Mg2+ effectively suppresses the Jahn–Teller distortion of Mn3+ by increasing the concentration of Mn4+. At 5% substitution, the initial discharge capacity reaches 175 mA h g−1 with moderate capacity retention for 25 cycles and at 20% substitution, the initial discharge capacity reaches 150 mA h g−1 along with a capacity retention of 96% after 25 cycles within the voltage range of 4.0–1.5 V at a current density of 12 mA g−1. The plateau above 3.5 V is attributed to the P2–OP4 structural change. Very recently it has been shown that the capacity values can be further pushed beyond 200 mA h g−1 by pushing the Mg substitution to achieve the final stoichiometry as Na0.67Mg0.28Mn0.72O2. Such a high capacity, which is beyond its theoretical limit based on the Mn3+/4+ redox, is considered to be due to the contribution from oxide ions similar to Li2MnO3 based solid solutions for lithium ion batteries.52
3.5 NaxFeO2
α- and β-NaFeO2 are well characterized for the phase separation based on the synthesis conditions,53 and only the low temperature phase, α-NaFeO2, is electrochemically active. In the case of the acid treated NaFeO2, only 0.1Na can be removed from the structure using bromine as an oxidizing agent, yet no chemical reaction has been observed with the less oxidative iodine,14 which is due to the higher OCV of the α-NaFeO2 than the oxidative potential of iodine. The structure remains unchanged when sodium ions are extracted up to Na0.9FeO2, and Mössbauer spectroscopy proves the presence of Fe4+ ions during the deintercalation reaction. The pristine material has higher than 108 Ω cm electrical resistivity at room temperature, and Na0.9FeO2 is thermally unstable as it decomposed to stable α-NaFeO2 and Fe3O4 above 130 °C.54 Electrical conductivity can be explained on the basis of the hopping mechanism of the Fe in the octahedral sites through the adjacent empty tetrahedral sites (Fig. 16). α-NaFeO2 has also been tested against the Li anode and a monoclinic structure has been obtained at Na0.5FeO2.55 The small degree of elongation of the FeO6 octahedron (compared to the MnO6 in NaMn3+O2) could be ascribed to the structural compensation for the loss of Na ions rather than by the Jahn–Teller effect of Fe4+ ions. Deintercalation beyond x = 0.5 was not successful as deintercalation of more than 0.5Na leads to the decomposition of the electrolyte and electrode. A further detailed study on the ionic conductivity has been carried out as well.56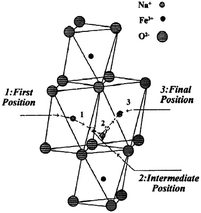 | ||
| Fig. 16 Sodium ion conduction model in the quasi-bidimensional α-NaFeO2.57 Reprinted with permission from Elsevier: C. Delmas, A. Maazaz, C. Fouassier, J. M. Reau and P. Hagenmuller, Mat. Res. Bull., 1979, 14, 329–335. Copyright 1979. | ||
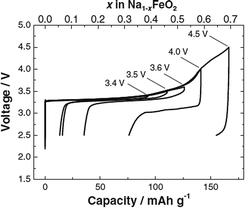
Structural and electrochemical characterization of O3-phase α-NaFeO2 has been reinvestigated recently,58 and the pristine material exhibited a nearly flat voltage profile with an average voltage of approximately 3.3 V. In addition, a systematic cut-off voltage study shows that the electrode performance is highly correlated with the irreversible structural transition when the cut-off voltage is raised above 3.5 V (Fig. 17). Although the charging capacity increases as a function of the cut-off voltage, the reversible capacity decreases when charged beyond 3.5 V. Excellent reversibility with small polarization was observed with the cut-off voltage at 3.4 V. The reversible capacity reaches 100 mA h g−1, indicating that ∼0.3Na is reversibly de/intercalated from NaFeO2. The Coulombic efficiency during the first cycle is calculated to be 83% when the cell is charged to 3.4 V, and increases to approximately 97% during the 2nd cycle. Polarization on electrochemical cycles drastically increases after charge to 4.0 V or higher, and the reversible capacity rapidly decreases. Although the electrode becomes electrochemically inactive during the following discharge process, approximately 70% of Na is extracted from O3-phase NaFeO2 by oxidation to 4.5 V by assuming that all current is consumed by the sodium deintercalation reaction without any side reactions. The reversible capacity reaches 80 mA h g−1 within the voltage range of 3.4–2.5 V at a current density of 12 mA g−1 for 30 cycles.
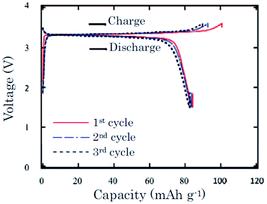
In an effort to prove the versatility of α-NaFeO2, the thermal stability of α-NaFeO2 is investigated.59 Partially desodiated Na0.58FeO2 decomposes at or higher than 300 °C and an exothermic peak was detected in a mixture of Na0.58FeO2 and NaClO4/EC–DMC at 220–300 °C using the DSC technique. The pristine cathode delivered an initial capacity of 103 mA h g−1 and the following discharge capacity of 85 mA h g−1 within the voltage range of 3.6–1.5 V at a current density of 0.2 mA cm−2. The following 2 cycles exhibited nearly 100% Coulombic efficiency with approximately 83 mA h g−1 capacity (Fig. 18).
LiFeO2![[thin space (1/6-em)]](https://www.rsc.org/images/entities/char_2009.gif) 60 was found to be electrochemically inactive until 1995 when Kanno and coworkers found that the corrugated LiFeO2 phase was able to extract and insert Li into the structure, although it showed a large capacity decay due to the cation disorder during the electrochemical reaction.
60 was found to be electrochemically inactive until 1995 when Kanno and coworkers found that the corrugated LiFeO2 phase was able to extract and insert Li into the structure, although it showed a large capacity decay due to the cation disorder during the electrochemical reaction.
Many efforts have been made to improve the performance of the material such as reducing the particle size61,62 or coating processes63 for instance. In the work published by Zhang et al., capacity values of 120 mA h g−1 at C/10 for the polypyrrole coated material were found after 100 cycles.
The capacity value of LiFeO2 is comparable to the one obtained for NaFeO2, but its average voltage and its capacity retention are higher than the Li counterpart.
3.6 NaxCoO2
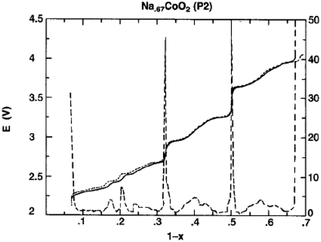
O3-phase NaxCoO2 can be electrochemically deintercalated up to ∼0.5Na while undergoing a phase transition to P3 and hence lead to the multiple plateaus in the electrochemical curve in the 0.67 < x < 0.8 range.14 The phase transitions during the de/intercalation process were analyzed in more detail using NaxCoO2/1 M NaClO4 in PC/Na half-cells as well.19,64 A series of phases can be synthesized based on the sodium concentration range, O3 (x = 1), O′3 (x = 0.77), P2 (0.64 ≤ x ≤ 0.77), and P′3 (0.55 ≤ x ≤ 0.60). As seen in Fig. 19, the pristine O3-phase undergoes a series of phase transitions, O3–O′3–P′3, because layers may glide at room temperature as the Na concentration changes. Such a phase transition is also reflected into a large polarization. Starting with the P′3- or O′3-phase, the highest value of x is always obtained with the O3-phase, which implies that the phase transition between O3, O′3, and P′3 is relatively easy process at room temperature.However, when started with the P2-phase, the P2-phase is preserved over the whole electrochemical range, 0.46 ≤ x ≤ 0.83, although multiple plateau behavior is observed due to redistribution of Na+ (Fig. 20) during the de/intercalation process. A small polarization, indicating structural stability, implies superior long term electrochemical behavior.
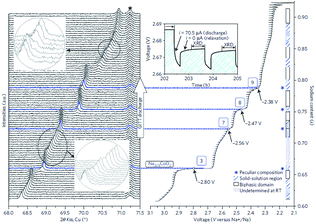
The cationic redistribution is a consequence of minimizing the electrostatic repulsion between Na+ ions, the repulsion between face shared Na and Co3+ as well as the electron–electron interaction in the oxide layer. Sometimes, only a slight change in Na concentration (1–2%) is enough to induce the redistribution.65 Precisely designing the experiment, a phase diagram of P2-NaxCO2 within the voltage range of 3.1–2.1 V, which constitutes ∼0.62 ≤ x ≤ ∼0.92, could be constructed using GITT and in situ XRD techniques. A series of ordered phases, Na1/2CoO2 at 3.45 V, Na4/7CoO2 at 3.15 V, and Na2/3CoO2 at 2.80 V along with single phases, Na∼0.72CoO2 at 2.56 V, Na∼0.76CoO2 at 2.47 V, and Na∼0.79CoO2 at 2.38 V, are observed at room temperature as seen in Fig. 21. A temperature dependent experiment reveals that the phase diagram is highly sensitive to the operating temperature, and the feasibility of utilizing electrochemical methods to obtain finely tuned composition materials with good homogeneity is demonstrated as well.
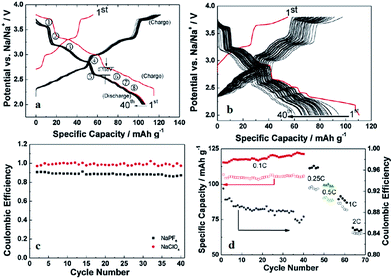
Recently, P2-phase Na0.74CoO2 has been re-evaluated as a feasible cathode material for Na-ion batteries.66 As seen in Fig. 22a and b, the initial charge capacity reaches 55.7 mA h g−1 and the following discharge capacity reaches 107.0 mA h g−1, which constitutes a nearly fully sodiated phase, with the polarization range from 150 to 250 mV within the voltage range of 3.8–2.0 V at 0.1 C. The capacity retention at the 40th cycle is 103 mA h g−1 (89% Coulombic efficiency) at 0.1 C and decreases when the C/rate increases as it can be observed in Fig. 22d. In addition, the electrode performance based on different electrolytes is studied. As shown in Fig. 22a, when using NaPF6 better cycling performance is observed than when using NaClO4 (Fig. 22b) but NaClO4 provides a better Coulombic efficiency.
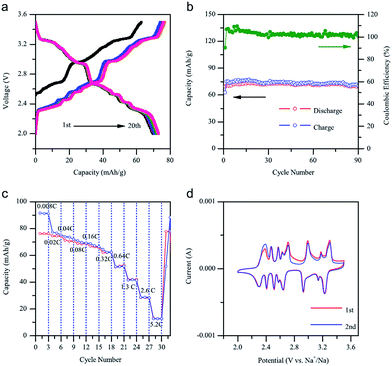
A similar system, Na0.71CoO2, is investigated independently.67 The charge–discharge profile and CV curve (Fig. 23a and d) show a good reversibility of pristine material. Utilizing NaClO4 as the electrolyte, the 1st charge capacity reaches 63.1 mA h g−1 while the following discharge capacity reaches 68.7 mA h g−1 within the voltage range of 3.5–2.0 V at 0.08 C. Nearly 100% Coulombic efficiency until the 90th cycle (Fig. 23b) is realized. Poor rate capability at high rates (Fig. 23c) is suggested to be due to agglomerates of larger particles.
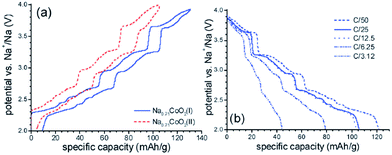
The same composition, Na0.71CoO2, with different morphology samples are synthesized using Na2CO3 (sample I) or NaOH (sample II) and hydrothermally prepared Co3O4 nanocrystal.68 Sample I has a regular platelet shape with sheet edges and flat surface exposed while sample II has an irregular shape with undefined exposed surfaces and broader size distribution. Evidenced by better peak resolution in the CV curve, sample I exhibited faster electrode kinetics because diffusional control of the intercalation element influences the kinetics of the electrochemical process (Fig. 24a and b).
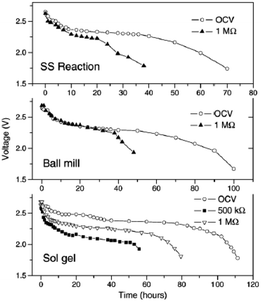
All solid state Na-ion batteries using Na0.7CoO2 synthesized by various techniques have been fabricated using wt% 0.3PEO-0.7PEG as an electrolyte.69 The solid state reaction produces agglomerated particles of irregular shape with an average size of 8–10 μm, and the ball mill assisted method produces spherical particles with 2–4 μm size. The sol–gel method produces a homogeneous spherical and cylindrical shape with an average size of 500 nm. All samples exhibit a resistivity range of 4–12 mΩ cm, and an initial OCV of 2.7 V which gradually decreases to 2.4 V for solid state cells of all samples. The maximum discharge capacity is found with the sol–gel prepared cathode at approximately 29 μA h (Fig. 25). However, the cells were not cycled further due to the low Na+ diffusion coefficient (when compared to the Li+ value in LiCoO2-based systems) and because of the low ionic conductivity of the electrolyte in comparison with the conventional liquid electrolyte.
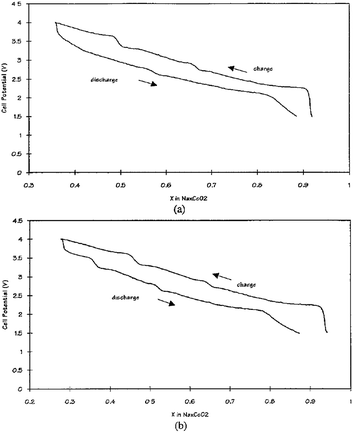
Other solid state cells, Na/P(EO)8NaCF3SO3/Na0.7CoO2 and Na15Pb4/P(EO)8NaCF3SO3/Na0.7CoO2, have been investigated at 90–100 °C.70 At an OCV of 2.8 V, Na de/intercalates in the range of x = 0.3–0.9 which produces a volumetric energy density of 1600 W h L−1 for Na and 1470 W h L−1 for Na15Pb4 within the voltage range of 4.0–1.5 V at a current density of 0.5 mA cm−2 as seen in Fig. 26a and b. The multiple plateau behavior is observed, which is characteristic of the P2-phase NaxCO2 charge–discharge profile.
Along with good rate capability, more than 60% depth of discharge for 100 cycles and 200 shallower cycles are achieved at a current density of 0.5 mA cm−2 as well.
Full Na-ion cells based on NaxCoO2 and different carbons have been tested. Depending on the density and the porosity of the carbonaceous material the limit of capacity for sodium insertion has varied. The maximum discharge capacity value of ca. 200 mA h g−1 in the 4.4–2.5 V range was found for the less dense and highly porous carbon. Sodium ions inserted between the bent layers in the amorphous carbon black and in the pores in the hard carbon were foreseen.71
3.7 NaxNiO2
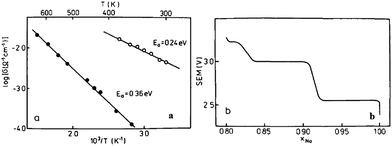
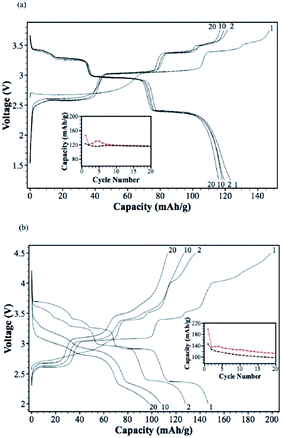
The electrochemistry of NaNiO2 was investigated quite some time ago.12,14,72 O3-phase NaNiO2 forms an ideal hexagonal phase above 220 °C and a distorted monoclinic phase below 220 °C, and for the monoclinic phase, low spin Ni3+ induces remarkably strong Jahn–Teller distortion, which creates a deviation of the a/b cell parameter ratio from an ideal value of 1.73 to 1.86. The potential variations in the electrochemical profiles are related to the Fermi energy and density of the states near the Fermi level. For the temperatures above 600 K the electrical conductivity is almost independent of the temperature, but the activation energy increases from 0.24 eV to 0.36 eV for x = 1 to x = 0.87 (Fig. 27a). Such an increase in the activation energy and hence decrease in the electronic conductivity are related to the potential jump ΔV in the electrochemical curve (Fig. 27b). Initial investigation of the electrochemical performance of NaNiO2 resulted in deintercalation of only 0.2Na from the crystal.Recently, O3-phase NaNiO2 was re-evaluated for its electrochemistry.28 During the 1st cycle, the charge capacity reaches 147 mA h g−1 and the following discharge capacity of 123 mA h g−1 within the voltage range of 3.75–1.25 V at C/10 along with a good capacity retention and the Coulombic efficiency increases to 99.2% after 20 cycles. When cycled between 4.5 and 2.0 V at C/10, the 1st charge capacity reached 199 mA h g−1 and the following discharge capacity reached 147 mA h g−1 as seen in Fig. 28a and b. However, a rapid capacity loss and a low Coulombic efficiency of 86.3% at the 20th cycle are observed. The charge–discharge profile exhibits multiple plateau behaviour due to a series of phase transitions during the cycle. The large capacity loss during the 1st charge–discharge cycle is because a fully sodiated phase could not be reached during the 1st discharge process.
Further details regarding the multiple phase transition during the cycling have been investigated by means of ex situ and in situ XRD techniques.73 The charge–discharge profile shows multiple plateaus and the capacity retention is moderate as seen in Fig. 29a and b. The capacity fading has been attributed to the impossibility to recover the pristine distorted O′3-NaNiO2 phase after the first charge–discharge process. The starting point in the subsequent cycles is a new phase denoted as O′′′′3 with 0.83 Na ions per f.u.
The Na concentration during the multiple phase transition is revised based on the electrochemistry and ICP measurement. Unlike previous literature, an observation of a new phase (Na0.83NiO2) at 1.5 V during the discharge process opened up a possibility of obtaining the fully sodiated phase. Recent development of a full cell composed of O3-phase NaaNi(1−x−y−z)MnxMgyTizO2/hard carbon showed a similar electrochemical performance to the commercially available Li-ion battery.74
Many other transition metal oxides such as WO3, ReO3, MoO3, VO2, and V2O5 and chalcogenides have also been studied for Li or Na intercalation during the initial development of electrode materials for sodium and lithium ion batteries and have been summarized in the early review of such materials.75
4. Binary TM systems: NaxTMT′MO2
The cooperative effect of binary metals in metal oxide layers is investigated, and much effort is devoted to removing multiple plateaus, to increasing the average voltage, and to improving the reversible capacity. Among electrochemically active transition metals, combinations of Ni, Fe, Mn, and Co are focused, and some of the best performances including the highest reversible capacity, fairly flat voltage profile, and higher operating voltage are achieved. In addition, substitution of electrochemically inactive elements in the oxide layer proved to enhance the capacity retention and cycling profile while losing some specific capacity.4.1 Nax[NiT′M]O2
Ni containing layered oxides are an interesting system because the overall electrochemical performance is based on the Ni2+/3+/4+ redox reaction which has a relatively high operating voltage. However, due to the Jahn–Teller distortion induced by low spin Ni3+ (t2g6eg1), the electrochemical cycling profile of the Ni only compound exhibits multiple plateaus during cycling, which is attributed to phase transitions, Na redistribution in the interlayer, or change in the degree of distortion.73The galvanostatic charge–discharge curve of O3-phase NaNi0.5Mn0.5O2 at room temperature shown in Fig. 30a exhibits multiple plateau behaviour26 while P2-phase NaxNi1/3Mn2/3O2 shown in Fig. 30b exhibits a smooth charge–discharge curve.76 The structural evolution investigated by ex situ XRD reveals that there are 4 distinctive phase transitions upon charging, and they are determined to be from O3 (pristine) to O′3, P3, P′3, and P′′3 which implies multiple slab gliding and a strong Jahn–Teller distortion induced during the cycling. In the meantime, a superior cycling stability is achieved when cycled up to 4.0 V because the P2–O2 phase transition occurs at higher voltage.77 Obviously, the initial specific capacity of the O3-phase is higher than that of the P2-phase because the initial Na concentration is much higher for the O3-phase, but the P2-phase exhibits superior capacity retention due to the structural stability. The detailed electrochemical process of the P2-phase NaxNi1/3Mn2/3O2 within 0 < Nax < 2/3 is investigated by combining the first principles computation, electrochemical, and synchrotron techniques.31 The formation energy calculation and ex situ synchrotron XRD indicate that the P2-phase has the lowest energy at 1/3 < Nax < 2/3 while the O2-phase becomes more stable as x approaches 0. Evidenced by site occupancy studies coupled with Rietveld refinement, the deintercalation rate of edge shared Na (0.43Na in the pristine state) is slightly faster than the face shared Na (0.25Na in the pristine state) down to x = 1/3 where each site is occupied by 0.17Na and the deintercalation rate becomes approximately the same below x = 1/3. In addition, the diffusion coefficient calculated by the GITT technique for 1/3 < Nax < 2/3 is 7 × 10⁻⁹ to 1 × 10⁻¹⁰ cm2 s−1 which is faster than the Li diffusivity in the O3 structure. The capacity retains at only 64% after 10 cycles within the voltage range of 4.5–2.3 V due to the P2–O2 transition, but when cycled below the transition voltage, 92% capacity retention up to 50 cycles along with a good rate capability is obtained.
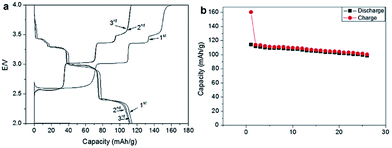
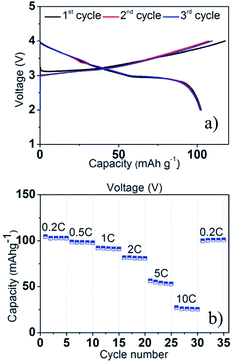
A series of Fe substituted O3-phase NaFex(Ni1/2Mn1/2)1−xO2 has been investigated for enhanced electrochemical performance.78 Although the reversible capacity is reduced to 130 mA h g−1 within the voltage range of 3.8–2.0 V at C/20, the NaFe0.4(Ni1/2Mn1/2)0.6O2 delivered a smooth charge–discharge profile, good capacity retention and rate capability. In addition, Ti substituted P2-phase Na2/3Ni1/3Mn2/3−xTixO2 (x = 0, 1/6, 1/3, and 2/3) exhibited the most improved electrochemical performance with the nominal composition of Na2/3Ni1/3Mn1/2Ti1/6O2 at a specific capacity of 127 mA h g−1 within the voltage range of 4.5–2.5 V at a current density of 12.1 mA g−1.79 The concentration of Ti introduces a remarkable structural stability even at such a high cut-off voltage, which is proposed to be due to smaller volume change for heavily substituted compounds, but the reversible capacity becomes smaller because Ti is electrochemically inactive. Furthermore, the electrochemistry of O3-phase NaNi0.5Ti0.5O2 demonstrates the beneficial effect of Ti substitution into Ni containing layered oxides.80,81 The 1st charge–discharge capacities reached 170/121 mA h g−1 within the voltage range of 4.7–2.0 V at 0.2 C, but the capacity retention is low at 52.8% after 50 cycles. When the upper voltage is limited to 4.0 V, however, the first 3 cycles overlap with each other very well, and the excellent capacity retention of 93.2% after 100 cycles is obtained at 0.2 C as seen in Fig. 31a. In addition, an excellent rate capability delivering 27 mA h g−1 even at 10 C rate (Fig. 31b) is attributed to the faster Na ion diffusivity in this particular phase.
Recently, electrochemistry of Na2Ni2TeO6 and Na1.6Sr0.2Ni2TeO6 has been evaluated for high voltage cathode materials. Na2Ni2TeO6 delivered a maximum discharge capacity of approximately 110 mA h g−1 based on the Ni2+/3+ redox reaction within the voltage range of 4.35–3.0 V at 0.03 C, and Na1.6Sr0.2Ni2TeO6 delivered a maximum discharge capacity of 108.5 mA h g−1 within the voltage range of 4.35–3.00 V at 0.05 C. However, the electrolyte stability at such a high cut-off voltage remains questionable.
One of the most significant improvements regarding multiple plateau behaviour was achieved with a Li substituted system.82 A small substitution of Li in the transition metal oxide layer to yield Na0.85Li0.17Ni0.21Mn0.64O2 vastly improves the charge–discharge profile with an average voltage of 3.4 V. An excellent rate capability with a reversible capacity of 65 mA h g−1 at a current density of 1600 mA g−1 is achieved, in which the power density at such performance is projected to be 670 W kg−1. The average capacity of 95–100 mA h g−1 (approximately 87% of theoretical capacity) is achieved after 50 cycles which is only 2% capacity fade from the initial capacity at a current rate of 15 mA g−1 within the voltage range of 4.2–2.0 V. The gradual capacity fade is proposed to be due to the side reaction of the electrolyte with Na metal, electrochemical reduction of the surface oxide species on Na metal and Na plating problem on charge.
A feasibility of full cell Na-ion batteries has been demonstrated using the NaNi0.5Mn0.5O2 cathode and hard carbon anode full cell configuration.24 Various electrolytes, NaClO4, NaPF6, and NaN(SO2CF3)2 (sodium bis(trifluoromethanesulfonyl)amide, NaTFSA) in PC, are evaluated and all systems exhibited more than 200 mA h g−1 reversible capacity based on the anode. Multiple plateaus during the cycling are observed, which is characteristic of NaNi0.5Mn0.5O2. The NaTFSA solution exhibits a better cyclic performance after 50 cycles by maintaining more than 70% of capacity, and the same cell tested at 60 °C shows similar cyclic performance. Furthermore, an excellent rate capability even at 300 mA g−1 proves the feasibility of Na-ion full cell batteries. At an average operating voltage of 3 V, this type of full cell Na-ion battery achieves ca. 60% of the practical energy density of Li-ion batteries.
4.2 Nax[FeT′M]O2
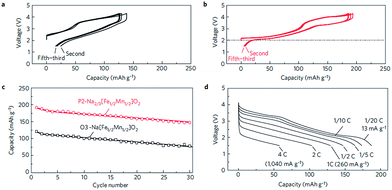
Fe containing layered oxides are very appealing from an application point of view because of natural abundance, environmental benignity, and high operating voltage. Coupling with Mn, Co, or Ni has the potential to obtain a high operating voltage and specific capacity. Specifically, Fe coupled with Mn seems to be a promising electrode by exhibiting one of the largest specific capacities along with good capacity retention.20 However, the challenges lie in (1) irreversible phase change above 3.4 V for α-NaFeO2![[thin space (1/6-em)]](https://www.rsc.org/images/entities/char_2009.gif) 58 and (2) low average potential of the Mn2+/3+/4+ redox reaction and (3) possibility of Mn ion dissolution in the electrolyte.83 The electrochemical performance comparison between partially sodiated P2-phase Na2/3Fe1/2Mn1/2O2 and O3-phase NaFe1/2Mn1/2O2 reveals that the P2-phase exhibits better overall electrochemistry by delivering a reversible capacity of 190 mA h g−1 within the voltage range of 4.2–1.5 V at a current density of 12 mA g−1 (Fig. 32b) and good rate capability (Fig. 32d) while the fully sodiated O3-phase delivered 100–110 mA h g−1 of reversible capacity under the same experimental conditions (Fig. 32a) although the capacity retention rate for both samples is almost identical (Fig. 32c). In addition, the total redox capacity of Fe is different from that of Mn probably because the reversible range associated with the Fe redox reaction is limited by irreversible Fe migration at high voltage.84 At an average operating voltage of 2.75 V, the energy density is estimated to be 520 mW h g−1, which is comparable to that of the commercially available Li-ion battery cathode.20,84
58 and (2) low average potential of the Mn2+/3+/4+ redox reaction and (3) possibility of Mn ion dissolution in the electrolyte.83 The electrochemical performance comparison between partially sodiated P2-phase Na2/3Fe1/2Mn1/2O2 and O3-phase NaFe1/2Mn1/2O2 reveals that the P2-phase exhibits better overall electrochemistry by delivering a reversible capacity of 190 mA h g−1 within the voltage range of 4.2–1.5 V at a current density of 12 mA g−1 (Fig. 32b) and good rate capability (Fig. 32d) while the fully sodiated O3-phase delivered 100–110 mA h g−1 of reversible capacity under the same experimental conditions (Fig. 32a) although the capacity retention rate for both samples is almost identical (Fig. 32c). In addition, the total redox capacity of Fe is different from that of Mn probably because the reversible range associated with the Fe redox reaction is limited by irreversible Fe migration at high voltage.84 At an average operating voltage of 2.75 V, the energy density is estimated to be 520 mW h g−1, which is comparable to that of the commercially available Li-ion battery cathode.20,84
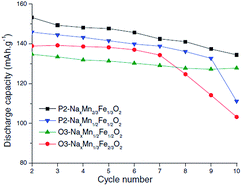
Also, submicron size P2-phase Na2/3Fe1/2Mn1/2O2 cycled within the voltage range of 4.0–1.5 V exhibited an excellent capacity retention of 99.6% for 50 cycles.85 The electrochemical performance of P2- and O3-phases is further investigated with a series of NaxFexMn1−xO2 (1.0 ≤ x ≤ 0.5).86 When x > 0.65, the O3-phase is stabilized while when x < 0.65, a combination of two or more O3- and P2-like phases is formed. The capacity, reversibility, capacity retention and polarization are improved as the Mn concentration increases up to x = 0.5. Such an improvement is suggested to be due to hindered cooperative Jahn–Teller distortions by introducing less active Jahn–Teller ions for the mixed metal ions than pure NaMnO2 or α-NaFeO2. In addition, it was observed that when smaller amounts of Fe3+/4+ redox were utilized, the capacity fade became less prominent.87,88 However, the electrochemical performance comparison between P2-phase Na0.67Mn2/3Fe1/3O2, P2-phase Na0.71Mn1/2Fe1/2O2, O3-phase Na0.82Mn1/3Fe2/3O2, and (O3+O′3)-phase Na0.8Mn1/2Fe1/2O2 at C/100 showed slightly higher reversible capacity for the P2-phase if the transition metal concentration remains the same (see Fig. 33). However, the reversible capacity of O3-phases here exhibited higher discharge capacity than those reported in the previous studies,20 which could be due to the transition metal vacancies introduced based on the experimental conditions or Fe migration at high voltage.58
Generally the P2 based cathode compositions such as Na2/3Fe1/2Mn1/2O2 have sodium deficient structure. Therefore the full reversible capacity can only be achieved either by using a source of sodium as an anode or by presodiating the cathode. Very recently, an approach based on utilizing a sacrificial salt as a cathode mix demonstrated the feasibility of overcoming the limitation of sodium deficiency in the structure. NaN3 is used as a sacrificial salt which act as a source of required sodium and gives an irreversible capacity at ∼3.5 V which is well within the operating voltage window for most of the P2 based cathodes. The oxidation reaction of NaN3 is proposed as 2NaN3 → 3N2 + 2Na+ + 2e−. Due to the high theoretical charge capacity (∼412 mA h g−1), a very small amount of NaN3 is required to overcome the sodium deficiency issue. This approach can be applied to the sodium deficient materials covering the operating voltage window of NaN3 during the formation step of sodium ion cells.89,90 Lastly, electrochemically reversible Li intercalation in P′3-phase Na2/3Mn1−yFeyO2 (y = 0, 1/3, 2/3) has been demonstrated91 which proves the feasibility of obtaining a high capacity Li-ion cathode from a very stable Na layered oxide.
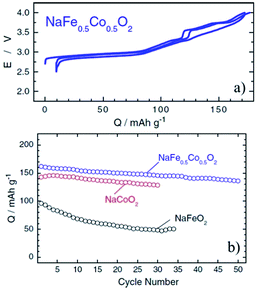
Coupling Fe with Co or Ni is an interesting combination because of the high flat voltage nature of α-NaFeO2 although there are many challenging aspects mentioned above. O3-phase NaFe0.5Co0.5O2, an intermediate solid solution of NaFeO2 and NaCoO2, delivered 160 mA h g−1 reversible capacity within the voltage range of 4.0–2.5 V at a current density of 12 mA g−1 as seen in Fig. 34a.92 The average voltage (3.14 V) is higher than that of NaFeO2 and NaCoO2 along with a smoother charge–discharge profile in a lower voltage range compared to NaCoO2. The capacity retention is improved as well comparing both end members of compounds and is moderate at 85% after 50 cycles (Fig. 34b). A good capacity retention is obtained delivering over 100 mA h g−1 at 30 C rate. The in situ XRD experiment revealed that a two-phase region for NaFe0.5Co0.5O2 only exists at the beginning of the charge process (O3–P3 transition) and such a good rate capability is proposed to be because of faster Na diffusivity in the P3-phase.
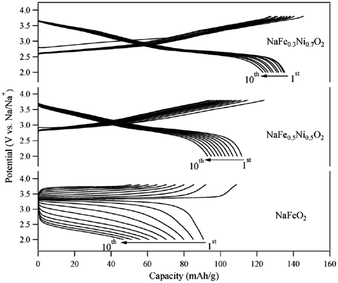
In addition, O3-phase NaFe1−xNixO2 (0.5 ≤ x ≤ 0.7) delivered 112 mA h g−1 and 135 mA h g−1 with the initial Coulombic efficiency of 89% and 93% (Fig. 35) although the average potential decreased to 2.85 V and 2.7 V for x = 0.5 and 0.7, respectively, within the voltage range of 3.8–2.0 V at a current density of 30 mA g−1.25 Substitution of Fe with Ni largely suppressed polarization during cycles, and the origin of improved electrochemistry is suggested to be due to the introduction of Ni3+/4+ redox reactions, which suppresses the Jahn–Teller element effect of Fe4+ during the cycle. Very recently, a study on the NaFex(Ni0.5Ti0.5)1−xO2 (x = 0.2 and x = 0.4) cathode has shown an improved average potential of ≥3.1 V and a discharge capacity of ∼120 mA h g−1 in the narrow operating potential window of 3.75–2.6 V, while maintaining the smooth voltage profile. An improved electrochemical performance has been observed for the NaFSI based electrolyte compared to NaClO4, with capacity falling to 83% of its initial value after 30 cycles.
4.3 Nax[CoT′M]O2
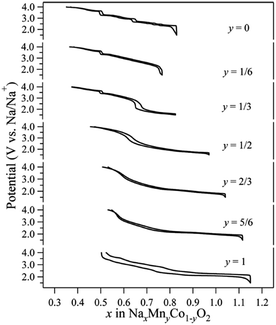
Co containing Na layered oxide cathodes have many drawbacks including low reversible capacity, multiple plateaus, and rapid capacity fade.66 Also, Co may not be the best choice for electrochemically active transition metals because of high price and toxicity. Until now, Co coupled with Mn systems, P2-phase Na2/3MnyCo1−yO2, have been most extensively investigated. Generally speaking, when the Mn concentration increases, the high voltage capacity decreases (Co4+/3+ redox), but the overall capacity slightly increases along with a smother charge–discharge profile (Fig. 36) up to y = 1/2.93–95 The reversible capacity further increases beyond y = 1/2, but plateau behaviour reoccurs with larger polarization.5. Ternary TM systems and beyond
Carefully designing a complex mixture of electrochemically active transition metals can selectively activate the redox reaction of desired elements at a target voltage. Such a scheme could enable a smooth charge–discharge profile by preventing multiple phase transition or changes in the degree of distortion during the cycling. In addition, tuning the operating voltage, desirably at high voltage, could be possible by understanding the effect of cooperative interactions between the active and spectatorial elements.5.1 Nax[NiFeMn]O2
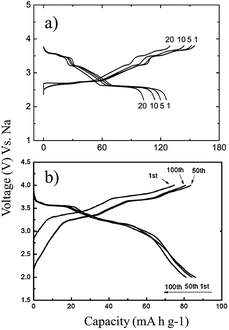
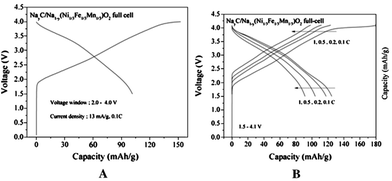
Ni substituted P2-phase NaxMn1−y−zFeyNizO2 exhibits a significantly improved electrochemical performance,96,97 and a stable reversible 2-phase transition is observed using the ex situ XRD technique. The improved electrochemical behaviour is proposed to be due to the suppression of Jahn–Teller distortion by reducing the concentration of high spin Mn3+. In addition, substitution of a small amount of Ti leads to long cycling performance.98 The feasibility of full cells utilizing O3-phase Na[Ni1/3Fe1/3Mn1/3]O2 is demonstrated using hard carbon as an anode.99 Although some irreversible capacity loss is observed during the 1st discharge process mostly due to the carbon electrode first cycle irreversibility which is caused by the formation of SEI on a hard carbon anode, a smooth charge–discharge profile is obtained at an average operating voltage of approximately 2.75 V as seen in Fig. 37a. The full cell delivered a reversible capacity of 100 mA h g−1 (∼0.46Na) for 150 cycles within the voltage range of 4.0–2.0 at 0.5 C and an excellent rate capability of 94 mA h g−1 at 1 C is achieved as seen in Fig. 37b.5.2 Nax[NiCoMn]O2
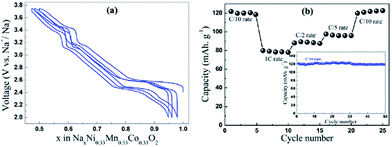
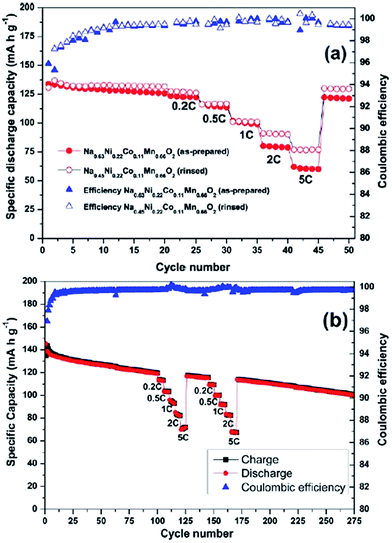
A Na analogue of commercially available LiNi1/3Mn1/3Co1/3O2 (LiNMC), NaNi1/3Mn1/3Co1/3O2 (NaNMC), has been evaluated for Na-ion battery cathode materials.100 Originating from the Ni4+/2+ redox reaction, the cathode delivered a reversible capacity of 120 mA h g−1 (0.5Na) within the voltage range of 3.75–2.00 V at 0.1 C. However in situ XRD data analysis revealed that the electrode undergoes O3–O1–P3–P1 phase transition during the cycling, which appears as multiple plateaus in the charge–discharge profile in Fig. 38a. An excellent capacity retention as well as rate capability (Fig. 38b) is observed for 50 cycles within the voltage range of 3.75–2.5 V (Fig. 38b, inset) although when the cut-off voltage is raised to 4.2 V, the capacity reached more than 120 mA h g−1 at the expense of rapid capacity loss.The stabilizing effect on the capacity retention of proton exchanged P2-phase Na0.63Ni0.22Co0.11Mn0.66O2 is investigated by treating pristine material, in water, which causes sodium leaching and proton exchange.101,23 As shown in Fig. 39a, the rinsed material shows lower discharge capacity during the first cycle but outperforms during the later cycles with higher capacity retention (95% for the rinsed material, 91% for the as-prepared material) at the 50th cycle along with 99.5% Coulombic efficiency after 15 cycles for rinsed material, which confirms the better stability of the rinsed material. Increased rate capability shown in Fig. 39a is also an indicative of the better stability of the proton exchanged material. Such an improvement proves that combining multiple transition metals induces a positive cooperative effect on the overall electrochemistry. The improvement of the overall electrochemical performance is suggested to be a result of more reversible P2–O2 phase transition for the proton exchanged material at high voltage. By stoichiometric calculation, 0.18 equivalent of Na+ is exchanged by a proton. Supposing the total possible Na+ concentration in interlayer space is 1.0, the ratio between the available interlayer position for Na+ and the proton is 4.6 to 1. Therefore, the Na de/intercalation pathway should not be hindered to a large degree. Fig. 39b shows the extraordinary cycling performance of the proton exchanged material where the Coulombic efficiency raises up to 99.7% from the 50th to the 275th cycle and the capacity retention after 275 cycles reaches approximately 100 mA h g−1 which is 72% retention from the 2nd cycle.
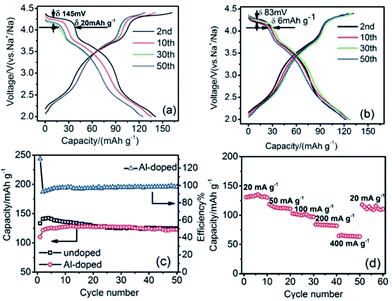
Doping an electrochemically inactive element into a transition metal oxide layer is shown to improve the electrochemical performance in the case of P2-phase Na0.67[Mn0.65Ni0.15Co0.2]O2 and Na0.67[Mn0.65Ni0.15Co0.15Al0.05]O2 microflakes.102 The charge–discharge profiles of both phases exhibit 3 voltage plateaus as shown in Fig. 40a and b, but the reversible capacity of the Al-doped cathode during the first few cycles is slightly lower than that of the undoped cathode. However the capacity retention improved vastly for the Al-doped cathode by retaining from 129 mA h g−1 to 123 mA h g−1 at the 50th cycle as seen in Fig. 40b. The cycling performances of the substituted and unsubstituted materials (Fig. 40c) show that the unsubstituted sample suffers from a significant discharge capacity loss during the first several cycles while the substituted sample does not exhibit a noticeable capacity fade. In addition, the rate capability shown in Fig. 40d proves that the substituted material can cycle at high C-rates by maintaining 50% of capacity at a current density of 400 mA g−1, which demonstrates unquestionable benefits by electrochemically inactive element substitution.
5.3 Li-rich layered oxide
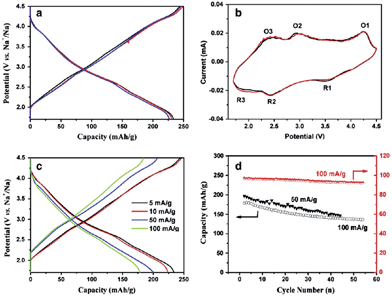
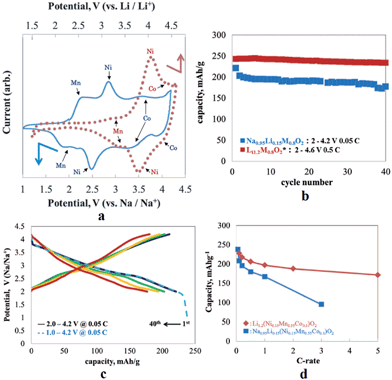
In an effort to increase the specific capacity, the Li-rich layered oxide, 0.5Li2MnO3·0.5LiMn0.42Ni0.42Co0.16O2, as a Na-ion battery cathode has been evaluated by electrochemical Na-insertion.21 Approximately 1.08Li is extracted and 0.76Na (239 mA h g−1) is intercalated into the host structure within the voltage range of 4.5–1.7 V at a current density of 5 mA g−1. The following charge capacity reached 244 mA h g−1 and the first three charge–discharge and CV curves overlap with each other very well, which indicates a good cyclability (Fig. 41a and b). Notice that the discharge capacity at an average voltage of 2.75 V results in an energy density of 644 W h kg−1, which is higher than that of the commercially available Li-ion battery cathode. CV curves exhibit 3 highly reversible redox couples of O1/R1 at 4.2/3.5 V (Co4+/3+), O2/R2 at 2.8/2.4 V (Ni4+/2+), and O3/R3 at 2.3/1.8 V (Mn4+/3+). The discharge capacities at the currents of 5, 10, 50, and 100 mA g−1 are 234, 224, 201, and 178 mA h g−1 (Fig. 41c), respectively and capacity retentions are 147 mA h g−1 after 45 cycles and 135 mA h g−1 after 54 cycles at a current of 50 and 100 mA h g−1, respectively (Fig. 41d).A similar approach has been explored using Na0.95Li0.15(Ni0.15Mn0.55Co0.1)O2 by electrochemical insertion of Na utilizing a Li analogue.22 Na intercalation induced 20% volume expansion and Mn, Ni, and Co redox peaks are clearly visible in the CV (Fig. 42a). The Na-system delivered the 1st discharge capacity of 220 mA h g−1 and the 2nd discharge capacity of 200 mA h g−1 when discharged to 2.0 V (Fig. 42c), and the 1st discharge capacity increased to 238 mA h g−1 when discharged to 1.0 V (Fig. 42c). Also, the Na-based system exhibited a moderate capacity retention of 170 mA h g−1 up to 40 cycles (Fig. 42b) along with the rate capability of 167 mA h g−1 at 1 C.
6. Conclusion
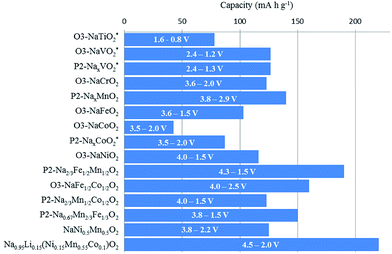
Fig. 43 includes the electrochemical performance of some of the significant Na layered oxides published to date. It should be noted that some of the capacities are well within the range of today's commercially available secondary battery.Despite the extensive research showing much improvement of overall electrochemistry, many aspects need to be addressed. In this review, 4 major challenges are recognized.
(1) Low operating voltage: the challenge lies in the fact that the redox reaction of each TM has its unique potential. One approach to address this issue is to include the elements with higher redox potential such as Fe3+/4+. However, it is shown that utilizing an extensive amount of Fe3+/4+ redox reaction may result in structural instability.
(2) Na deficiency of the P2-phase: although the P2-phase produces much more stable electrochemical cycling due to structural stability, the major challenge is that the P2-phase can only be stabilized at low Na concentrations in the pristine state. As seen in some recent literature this issue can be partially addressed by utilizing sacrificial salts such as NaN3. The search for new sacrificial salts (e.g. NaC2O4) that could have similar electrochemical properties to those of NaN3 can further address such issues.
(3) Long term stability of host structure: the possibilities of undergoing multiple phase transitions during the charge–discharge cycle imply the structural instability during a long term cycling. Recent literature, however, showed possibilities to improve the structural stability by substituting with electrochemically inactive elements such as Mg, and this strategy should be further investigated with other suitable elements.
(4) High polarization: the high polarization issue of Na layered oxide materials has not been focused much up to date, but could be a major obstacle in the near future. First, insight into the cause of this issue must be investigated in more detail before deploying any strategic approach to address this issue. Reducing the size of the electrode particle and optimization of the electrode slurry composition would be some quick approaches to decrease the polarization.
The substitution strategies will be emphasized as they have provided a significant improvement in overall electrochemical performance, and improving the operating voltage and long term stability should be the main focuses. However, a balance between the average voltage, specific capacity, and long term capacity retention must be carefully considered when determining specific systems based on specific requirements for individual applications.
Acknowledgements
This work was financially supported by Ministerio de Economía y Competitividad (Proyecto I+D. Retos 2013), reference number: ENE 2013-44330-R and FPDI-2013-17329, and the Gobierno Vasco/EuskoJaurlaritza (Etortek CICEnergigune 10, SAIOTEK-12 ENERGIBA and IT570-13).References
- M. Armand and J.-M. Tarascon, Nature, 2008, 451, 652–657 CrossRef CAS PubMed.
- V. Palomares, P. Serras, I. Villaluenga, K. B. Hueso, J. Carretero-González and T. Rojo, Energy Environ. Sci., 2012, 5, 5884–5901 CAS.
- K. B. Hueso, M. Armand and T. Rojo, Energy Environ. Sci., 2013, 6, 734–749 CAS.
- H. Pan, Y.-S. Hu and L. Chen, Energy Environ. Sci., 2013, 6, 2338–2360 CAS.
- K. Kubota, N. Yabuuchi, H. Yoshida, M. Dahbi and S. Komaba, MRS Bull., 2014, 39, 416–422 CrossRef CAS.
- J. Xu, D. H. Lee and Y. S. Meng, Funct. Mater. Lett., 2013, 6, 1330001 CrossRef.
- S.-W. Kim, D.-H. Seo, X. Ma, G. Ceder and K. Kang, Adv. Energy Mater., 2012, 2, 710–721 CrossRef CAS.
- B. L. Ellis and L. F. Nazar, Curr. Opin. Solid State Mater. Sci., 2012, 16, 168–177 CrossRef CAS PubMed.
- M. D. Slater, D. Kim, E. Lee and C. S. Johnson, Adv. Funct. Mater., 2013, 23, 947–958 CrossRef CAS.
- S. Engelke, Storage4, 2013, 1, 1–7 Search PubMed.
- V. Palomares, M. Casas-Cabanas, E. Castillo-Martínez, M. H. Han and T. Rojo, Energy Environ. Sci., 2013, 6, 2312–2337 CAS.
- C. Delmas, J.-J. Braconnier, C. Fouassier and P. Hagenmuller, Solid State Ionics, 1981, 3/4, 165–169 CrossRef.
- J. J. Braconnier, C. Delmas and P. Hagenmuller, Mater. Res. Bull., 1982, 17, 993–1000 CrossRef CAS.
- S. Miyazaki, S. Kikkawa and M. Koizumi, Synth. Met., 1983, 6, 211–271 CrossRef CAS.
- A. Maazaz, C. Delmas and P. Hagenmuller, J. Inclusion Phenom., 1983, 1, 45–51 CrossRef CAS.
- S. Kikkawa, S. Miyazaki and M. Koizumi, Mater. Res. Bull., 1985, 20, 373–377 CrossRef CAS.
- A. Mendiboure, C. Delmas and P. Hagenmuller, J. Solid State Chem., 1985, 57, 323–331 CrossRef CAS.
- J. Molenda, A. Stokłosa and D. Than, Solid State Ionics, 1987, 24, 33–38 CrossRef CAS.
- L. W. Shacklette, T. R. Jow and L. Townsend, J. Electrochem. Soc., 1988, 135, 2669–2674 CrossRef CAS PubMed.
- N. Yabuuchi, A. Kajiyama, J. Iwatate, H. Nishikawa, S. Hitomi, R. Okuama, R. Usui, Y. Yamada and S. Komaba, Nat. Mater., 2012, 11, 512–517 CrossRef CAS PubMed.
- Z. Jian, H. Yu and H. Zhou, Electrochem. Commun., 2013, 34, 215–218 CrossRef CAS PubMed.
- R. Kataoka, T. Mukai, A. Yoshizawa and T. Sakai, J. Electrochem. Soc., 2013, 160, A933–A939 CrossRef CAS PubMed.
- D. Buchholz, A. Moretti, R. Kloepsch, S. Nowak, V. Siozios, M. Winter and S. Passerini, Chem. Mater., 2013, 25, 142–148 CrossRef CAS.
- S. Komaba, W. Murata, T. Ishikawa, N. Yabuuchi, T. Ozeki, T. Nakayama, A. Ogata, K. Gotoh and K. Fujiwara, Adv. Funct. Mater., 2011, 21, 3859–3867 CrossRef CAS.
- X. Wang, G. Liu, T. Iwao, M. Okubo and A. Yamada, J. Phys. Chem. C, 2014, 118, 2970–2976 CAS.
- S. Komaba, N. Yabuuchi, T. Nakayama, A. Ogata, T. Ishikawa and I. Nakai, Inorg. Chem., 2012, 51, 6211–6220 CrossRef CAS PubMed.
- C. Delmas, C. Fouassier and P. Hagenmuller, Physica B+C, 1980, 99, 81–85 CrossRef CAS.
- P. Vassilaras, X. Ma, X. Li and G. Ceder, J. Electrochem. Soc., 2013, 160, A207–A211 CrossRef CAS PubMed.
- A. Mendiboure, C. Delmas and P. Hagenmuller, J. Solid State Chem., 1985, 57, 323–331 CrossRef CAS.
- I. Saadoune, A. Maazaz, M. Ménétrier and C. Delmas, J. Solid State Chem., 1996, 122, 111–117 CrossRef CAS.
- D. H. Lee, J. Xu and Y. S. Meng, Phys. Chem. Chem. Phys., 2013, 15, 3304–3312 RSC.
- D. Hamani, M. Ati, J.-M. Tarascon and P. Rozier, Electrochem. Commun., 2011, 13, 938–941 CrossRef CAS PubMed.
- M. Guignard, C. Didier, J. Darriet, P. Bordet, E. Elkaïm and C. Delmas, Nat. Mater., 2013, 12, 74–80 CrossRef CAS PubMed.
- C. Didier, M. Guignard, J. Darriet and C. Delmas, Inorg. Chem., 2012, 51, 11007–11016 CrossRef CAS PubMed.
- C. Didier, M. Guignard, C. Denage, O. Szajwaj, S. Ito, I. Saadoune, J. Darriet and C. Delmas, Electrochem. Solid-State Lett., 2011, 14, A75–A78 CrossRef CAS PubMed.
- S. Komaba, C. Takei, T. Nakayama, A. Ogata and N. Yabuuchi, Electrochem. Commun., 2010, 12, 355–358 CrossRef CAS PubMed.
- X. Xia and J. R. Dahn, Electrochem. Solid-State Lett., 2011, 15, A1–A4 CrossRef PubMed.
- J.-J. Ding, Y.-N. Zhou, Q. Sun and Z.-W. Fu, Electrochem. Commun., 2012, 22, 85–88 CrossRef CAS PubMed.
- C.-Y. Chen, K. Matsumoto, T. Nohira, R. Hagiwara, A. Fukunaga, S. Sakai, K. Jitta and S. Inazawa, J. Power Sources, 2013, 237, 52–57 CrossRef CAS PubMed.
- M. M. Doeff, T. J. Richardson, J. Hollingsworth, C.-W. Yuan and M. Gonzales, J. Power Sources, 2002, 112, 294–297 CrossRef CAS.
- F. Sauvage, L. Laffont, J.-M. Tarascon and E. Baudrin, Inorg. Chem., 2007, 46, 3289–3294 CrossRef CAS PubMed.
- J. A. Saint, M. M. Doeff and J. Wilcox, Chem. Mater., 2008, 20, 3404–3411 CrossRef CAS.
- J. F. Whitcare, A. Tevar and S. Sharma, Electrochem. Commun., 2010, 12, 463–466 CrossRef PubMed.
- A. D. Tevar and J. F. Whitcare, J. Electrochem. Soc., 2010, 157, A870–A875 CrossRef CAS PubMed.
- J.-P. Parant, R. Olazcuaga, M. Devalette, C. Fouassier and P. Hagenmuller, J. Solid State Chem., 1971, 3, 1–11 CrossRef CAS.
- X. Li, X. Ma, D. Su, L. Liu, R. Chisnell, S. P. Ong, H. Chen, A. Toumar, J.-C. Idrobo, Y. Lei, J. Bai, F. Wang, J. W. Lynn, Y. S. Lee and G. Ceder, Nat. Mater., 2014, 13, 586–592 CrossRef CAS PubMed.
- X. Ma, H. Chen and G. Ceder, J. Electrochem. Soc., 2011, 158, A1307–A1312 CrossRef CAS PubMed.
- A. Caballero, L. Hernán, J. Morales, L. Sánchez, J. Santos Peña and M. A. G. Aranda, J. Mater. Chem., 2002, 12, 1142–1147 RSC.
- J. M. Paulsen and J. R. Dahn, Solid State Ionics, 1999, 126, 3–24 CrossRef CAS.
- D. Su, C. Wang, H. Ahn and G. Wang, Chem.–Eur. J., 2013, 19, 10884–10889 CrossRef CAS PubMed.
- J. Billaud, G. Singh, A. R. Armstrong, E. Gonzalo, V. Roddatis, C. Armand, T. Rojo and P. G. Bruce, Energy Environ. Sci., 2014, 7, 1387–1391 CAS.
- N. Yabuuchi, R. Hara, K. Kubota, J. Paulsen, S. Kumakura and S. Komaba, J. Mater. Chem. A, 2014, 40, 16851–16855 Search PubMed.
- Y. Takeda, J. Akagi, A. Edagawa, M. Inagaki and S. Naka, Mater. Res. Bull., 1980, 15, 1167–1172 CrossRef CAS.
- S. Kikkawa, S. Miyazaki and M. Koizumi, Mater. Res. Bull., 1985, 20, 373–377 CrossRef CAS.
- Y. Takeda, K. Nakahara, M. Nishijima, N. Imanishi and O. Yamamoto, Mater. Res. Bull., 1994, 29, 659–666 CrossRef CAS.
- M. C. Blesa, E. Morana, C. León, J. Santamaria, J. D. Tornero and N. Menéndez, Solid State Ionics, 1999, 126, 81–87 CrossRef CAS.
- C. Delmas, A. Maazaz, C. Fouassier, J. M. Reau and P. Hagenmuller, Mater. Res. Bull., 1979, 14, 329–335 CrossRef CAS.
- N. Yabuuchi, H. Yoshida and S. Komaba, Electrochemistry, 2012, 80, 716–719 CrossRef CAS PubMed.
- J. Zhao, L. Zhao, N. Dimov, S. Okada and T. Nishida, J. Electrochem. Soc., 2013, 160, A3077–A3081 CrossRef CAS PubMed.
- T. Shirane, R. Kanno, Y. Kawamoto, Y. Takeda, M. Takano, T. Kamiyama and F. Izumi, Solid State Ionics, 1995, 79, 227–233 CrossRef CAS.
- J. Morales, J. Santos-Peña, R. Trócoli, S. Franger and E. Rodríguez-Castelló, Electrochim. Acta, 2008, 53, 6366–6371 CrossRef CAS PubMed.
- Y. S. Lee, S. Sato, Y. K. Sun, K. Kobayakawa and Y. Sato, J. Power Sources, 2003, 119, 285–289 Search PubMed.
- J. Zhang, J.-Z. Wang, S.-L. Chou, U.-K. Liu, K. Ozawa and J.-J. Li, Electrochim. Acta, 2013, 108, 820–826 CrossRef PubMed.
- C. Delmas, J. Braconnier, C. Fouassier and P. Hagenmuller, Solid State Ionics, 1981, 3–4, 165–169 CrossRef CAS.
- R. Berthelot, D. Carlier and C. Delmas, Nat. Mater., 2011, 10, 74–80 CrossRef CAS PubMed.
- J. J. Ding, Y. N. Zhou, Q. Sun, X. Q. Yu, X. Q. Yang and Z. W. Fu, Electrochim. Acta, 2013, 87, 388–393 CrossRef CAS PubMed.
- A. K. Rai, L. T. Anh, J. Gim, V. Mathew and J. Kim, Ceram. Int., 2014, 40, 2411–2417 CrossRef CAS PubMed.
- M. D'Arienzo, R. Ruffo, R. Scotti, F. Morazzoni, C. M. Mari and S. Polizzi, Phys. Chem. Chem. Phys., 2012, 14, 5945–5952 RSC.
- A. Bhide and K. Hariharan, Solid State Ionics, 2011, 192, 360–363 CrossRef CAS PubMed.
- Y. Ma, M. M. Doeff, S. J. Visco and L. C. De Jonghe, J. Electrochem. Soc., 1993, 140, 2726–2733 CrossRef CAS PubMed.
- R. Alcántara, J. M. Jiménez-Mateos, P. Lavela and J. L. Tirado, Electrochem. Commun., 2001, 3, 639–642 CrossRef.
- J. Molenda and A. Stoklosa, Solid State Ionics, 1990, 38, 1–4 CrossRef CAS.
- M. H. Han, E. Gonzalo, M. Casas-Cabanas and T. Rojo, J. Power Sources, 2014, 258, 266–271 CrossRef CAS PubMed.
- J. Baker, R. J. Heap, N. Roche, C. Tan, R. Sayers and Y. Liu, High Performance Na-ion Batteries Based on Novel O3 Layered Oxide Cathode Materials, International Meeting on Lithium Batteries, Como, Italy, 2014 Search PubMed.
- J. Gopalakrishnan, Bull. Mater. Sci., 1985, 7, 201–214 CrossRef CAS.
- H. Wang, B. Yang, X.-Z. Liao, J. Xu, D. Yang, D. Yang, Y.-S. He and Z.-F. Ma, Electrochim. Acta, 2013, 113, 200–204 CrossRef CAS PubMed.
- Z. Lu and J. R. Dahn, J. Electrochem. Soc., 2001, 148, A1225–A1229 CrossRef CAS PubMed.
- N. Yabuuchi, M. Yano, H. Yoshida, S. Kuze and S. Komaba, J. Electrochem. Soc., 2013, 160, A3131–A3137 CrossRef CAS PubMed.
- H. Yoshida, N. Yabuuchi, K. Kubota, I. Ikeuchi, A. Garsuch, M. Schulz-Dobrick and S. Komaba, Chem. Commun., 2014, 50, 3677–3680 RSC.
- H. Yu, S. Guo, Y. Zhu, M. Ishida and H. Zhou, Chem. Commun., 2014, 50, 457–459 RSC.
- S. Okada, J. Yamaki, Y. Takahashi and K. Nakane, EU Pat., EP 1 826 845 A1, 2007.
- D. Kim, S.-H. Kang, M. Slater, S. Rood, J. T. Vaughey, N. Karan, M. Balasubramanian and C. S. Johnson, Adv. Energy Mater., 2011, 1, 333–336 CrossRef CAS.
- J. Cho, T.-J. Kim, Y. J. Kim and B. Park, Chem. Commun., 2001, 1074–1075 RSC.
- N. Yabuuchi and S. Komaba, Sci. Technol. Adv. Mater., 2014, 15, 043501–043530 CrossRef.
- J. Xu, S.-L. Chou, J.-L. Wang, H.-K. Liu and S.-S. Dou, ChemElectroChem, 2014, 1, 371–374 CrossRef CAS.
- J. S. Thorne, R. A. Dunlap and M. N. Obrovac, J. Electrochem. Soc., 2013, 160, A361–A367 CrossRef CAS PubMed.
- Z. Yuan, W. Xuehang, W. Wenwei and W. Kaitu, Ceram. Int., 2014, 40, 13679–13682 CrossRef CAS PubMed.
- J. Zhao, J. Xu, D. H. Lee, N. Dimov, Y. S. Meng and S. Okada, J. Power Sources, 2014, 264, 235–239 CrossRef CAS PubMed.
- G. Singh, B. Acebedo, M. Casas Cabanas, D. Shanmukaraj, M. Armand and T. Rojo, Electrochem. Commun., 2013, 37, 61–63 CrossRef CAS PubMed.
- G. Singh, F. Aguesse, L. Otaegui, E. Goikolea, E. Gonzalo, J. Segalini and T. Rojo, J. Power Sources, 2015, 273, 333–339 CrossRef CAS PubMed.
- M. Yoncheva, R. Stoyanova, E. Zhecheva, E. Kuzmanova, M. Sendova-Vassileva, D. Nihtianova, D. Carlier, M. Guignard and C. Delmas, J. Mater. Chem., 2012, 22, 23418–23427 RSC.
- H. Yoshida, N. Yabuuchi and S. Komaba, Electrochem. Commun., 2013, 34, 60–63 CrossRef CAS PubMed.
- D. Carlier, J. H. Cheng, R. Berthelot, M. Guignard, M. Yoncheva, R. Stoyanova, B. J. Hwang and C. Delmas, Dalton Trans., 2011, 9306–9312 RSC.
- X. Wang, M. Tamaru, M. Okubo and A. Yamada, J. Phys. Chem. C, 2013, 117, 15545–15551 CAS.
- N. Bucher, S. Hartung, I. Gocheya, Y. L. Cheah, M. Srinivasan and H. E. Hoster, J. Solid State Electrochem., 2013, 17, 1923–1929 CrossRef CAS.
- D. Yuan, X. Hu, J. Qian, F. Pei, F. Wu, R. Mao, X. Ai, H. Yang and Y. Cao, Electrochim. Acta, 2014, 116, 300–305 CrossRef CAS PubMed.
- I. Hasa, D. Buchholz, S. Passerini, B. Scrosati and J. Hassoun, Adv. Energy Mater., 2014, 4, 1400083–1400089 Search PubMed.
- X. Sun, Y. Jin, C.-Y. Zhang, J.-W. Wen, Y. Shao, Y. Zhang and C.-H. Chen, J. Mater. Chem. A, 2014, 2, 17268–17271 CAS.
- D. Kim, E. Lee, M. Slater, W. Lu, S. Rood and C. S. Johnson, Electrochem. Commun., 2012, 18, 66–69 CrossRef CAS PubMed.
- M. Sathiya, K. Hemalatha, K. Ramesha, J.-M. Tarascon and A. S. Prakash, Chem. Mater., 2012, 24, 1846–1853 CrossRef CAS.
- D. Buchholz, L. G. Chagas, M. Winter and S. Passerini, Electrochim. Acta, 2013, 110, 208–213 CrossRef CAS PubMed.
- D. Yuan, W. He, F. Pei, F. Wu, Y. Wu, J. Qian, Y. Cao, X. Ai and H. Yang, J. Mater. Chem. A, 2013, 1, 3895–3899 CAS.
| This journal is © The Royal Society of Chemistry 2015 |


