How does PEDOT combine with PSS? Insights from structural studies†
Rupali Gangopadhyay*a,
Bidisa Das*a and
Mijanur Rahaman Mollab
aCentre for Advanced Materials, India. E-mail: camrg@iacs.res.in; cambd@iacs.res.in
bPolymer Science Unit, Indian Association for the Cultivation of Science, 2A & 2B, Raja S C Mallik Road, Kolkata 32, India
First published on 21st August 2014
Abstract
The severely intractable polymer poly(3,4-ethylenediethoxythiophene) (PEDOT) is brought to stable aqueous solution after in situ combination with polystyrene sulfonic acid (PSS). This solution (PEDOT–PSS) is stable and successfully combines the optical and electrical properties of PEDOT with the water solubility of PSS. This paper explores the physical properties of PEDOT–PSS from morphological and structural aspects and electronic structure studies are employed to understand the interaction between the two polymers. The solution consists of triangular/rectangular shaped nanoparticles and UV-vis spectroscopy is used to establish the highly doped and conductive nature of the sample with bipolarons present as carrier. Theoretical studies reveal the structure of the interpolymer complex and that the PEDOT chain is bent towards the PSS moiety, and thus, PEDOT–PSS is likely to form a partially coiled or helical structure. The unique stability of this system as well as its highly conductive nature is also consistent with the molecular model.
1. Introduction
Poly(ethylene-3,4-diethoxy thiophene) (PEDOT) stabilized in aqueous medium by poly(styrene sulfonic acid) (PSS) is an excellent material offering an optimum combination of the optical and electrical properties of PEDOT and the solubility of PSS. The severe intractability of PEDOT can be easily overcome by the formation of the interpolymer complex between PEDOT with PSS that makes a stable solution/dispersion in water (popularly known as PEDOT–PSS) which allows the polymer to be processed as a film/coating.1,2 This solution/dispersion retains excellent redox coloration, moderate transparency, good electrical conductivity (1–10 S cm−1) and many other important properties of PEDOT3–6 and thus has wide application potential for various electronic devices. Bayer AG patented PEDOT–PSS a long time ago; their product is commonly known as Baytron®, of different grades. Agfa Materials, working with conductive polymer products (known as Orgacon™), have recently launched fifth generation formulations, including dry re-dispersible pellets of PEDOT–PSS.7 Interestingly, this dispersion has unique stability on standing that has successfully been exploited commercially. This solution is extensively utilized worldwide in optoelectronic devices such as photovoltaic cells, light emitting diodes, electrochromic displays,8–11 printing ink for inkjet printers,12 and so on. However, the nature of the interaction between the two polymers and the underlying reason behind the solubilization of PEDOT after combination with PSS have remained almost unexplored.Very recently, Fan et al.13 and Dimitriev et al.14 have tried to explore the structure and interaction of PEDOT–PSS by spectroscopic and morphological techniques. They have, however, focused their interest on improving the electrical conductivity of the material. The present work explores the nature of the interaction between PEDOT and PSS that ultimately leads to the unique stability of the dispersion. For the sake of good comparison, we have followed our own methodology to synthesize PEDOT–PSS solution in our laboratory, and we have studied its morphological and optical properties. Our experimental findings have been correlated with the theoretical studies of electronic structure and spectral properties to understand the nature of the interactions that are responsible for the unique properties of the doped polymer complex, for the first time. Although this system is not a solution in the proper sense, considering its unique stability in water, it will be termed as ‘solution’.
2. Methodologies
2.1 Synthesis
3,4-Ethylenedioxythiophene (EDOT, monomer), PSS (Mw ∼ 75![[thin space (1/6-em)]](https://www.rsc.org/images/entities/char_2009.gif) 000) and FeCl3·6H2O were purchased from Sigma-Aldrich. In a typical synthesis, 90 mM stock solution of PSS was prepared in double distilled water. PSS solution (10 ml) was mixed with 60 μl of FeCl3 solution (1.62 M), followed by addition of 20 μl of EDOT monomer with constant stirring. Several color changes were observed and finally a dark blue PEDOT–PSS solution was synthesized. The product was further purified by dialysis4 with deionised water for three consecutive days and the water was changed every day. The dialysis membrane, which was purchased from Membrane Filtration Products (Mw cut off = 3500), could remove the ions, low molecular weight oligomers and unreacted monomer from the solution. However, the excess PSS and Fe3+ ions complexed to the PSS structure could not be removed, as was observed from further experiments. The same technique was followed for synthesis of a set of three PEDOT–PSS solutions (P-1, P-2, P-3) by varying the amount of monomer (15 μl, 20 μl and 25 μl); P-2 was considered to have the optimum composition.
000) and FeCl3·6H2O were purchased from Sigma-Aldrich. In a typical synthesis, 90 mM stock solution of PSS was prepared in double distilled water. PSS solution (10 ml) was mixed with 60 μl of FeCl3 solution (1.62 M), followed by addition of 20 μl of EDOT monomer with constant stirring. Several color changes were observed and finally a dark blue PEDOT–PSS solution was synthesized. The product was further purified by dialysis4 with deionised water for three consecutive days and the water was changed every day. The dialysis membrane, which was purchased from Membrane Filtration Products (Mw cut off = 3500), could remove the ions, low molecular weight oligomers and unreacted monomer from the solution. However, the excess PSS and Fe3+ ions complexed to the PSS structure could not be removed, as was observed from further experiments. The same technique was followed for synthesis of a set of three PEDOT–PSS solutions (P-1, P-2, P-3) by varying the amount of monomer (15 μl, 20 μl and 25 μl); P-2 was considered to have the optimum composition.
2.2 Transmission electron spectroscopy (TEM)
The stable PEDOT–PSS solution was diluted 20-fold with water, and no precipitation was observed. One drop of the optically clear dispersion was taken on to the TEM grid and analysed at 200 kV using a JEOL JEM-2010 electron microscope.2.3 Scanning electron spectroscopy (SEM)
Morphological studies of the sample were done using a JEOL JSM-6700F scanning electron microscope at 200 kV.2.4 Dynamic light scattering (DLS)
A diluted PEDOT–PSS solution, as used for SEM, was subjected to DLS studies using a Brookhaven Instruments BI-200SM goniometer.2.5 UV-Visible absorption spectroscopy (UV-vis)
The as-prepared PEDOT–PSS solution was diluted with water and subjected to UV-vis spectroscopic measurements using a Shimadzu UV-2550 spectrophotometer. Respective UV-vis spectra were recorded by changing the pH from 2 (original) to 1 (HCl), 5 (NH4OH) and 10 (NaOH).2.6 Electrical conductivity
Spin coated and dried film of the solutions were subjected to conductivity measurement using a four-probe measurement technique.2.7 Theoretical studies
The electronic structure studies for the doped and undoped EDOT oligomers were performed using density functional theory (DFT) as implemented in the Gaussian 0315 suite of programs. Studies of oligomeric EDOT, styrene sulfonic acid (SS) and EDOT–SS complexes were performed using the B3LYP16,17 hybrid functional with the 6-31G** basis sets for all atoms. The stable structures of all isolated molecules and complexes were determined by full geometry optimization in the gas phase and consequent harmonic frequency calculations were performed to ascertain the stationary points. The frontier molecular orbitals, especially the highest occupied molecular orbital (HOMO) and the lowest unoccupied molecular orbital (LUMO) of free PEDOT and PSS and the complex (PEDOT–PSS), were analyzed. The charge distribution was determined using Mulliken's method for all the systems studied. To simulate the UV-vis spectra of the polymeric systems, transition energies and oscillator strengths for electronic excitation to the first 50 singlet excited states of various PEDOT oligomers (complexed and uncomplexed) were calculated using time dependent density functional theory (TD-DFT) using B3LYP/6-31++G** methodology. However, because TD-DFT studies are highly resource consuming we carried out calculations where only the oligomeric PEDOT cation was considered to be fixed in the geometry of the PEDOT–PSS complex. This was not unreasonable because the UV-vis spectra of these systems are experimentally found to be unaffected by the anionic moiety. The UV-vis spectra were plotted using GaussView software (Scientific Software Solutions). We also determined all the transitions and identified the molecular orbitals involved using the application software SWizard.183. Results and discussion
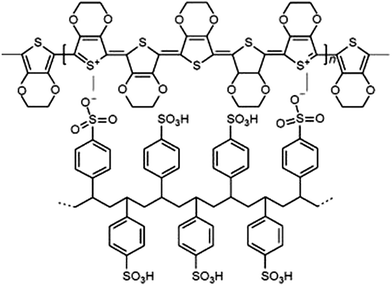
The schematic presentation of the PEDOT–PSS interpolymer complex is shown in Scheme 1. It is obvious that PSS, in this assembly, serves not only as a dispersant of PEDOT but also as a charge compensating counter-polyanion to the PEDOT backbone yielding a primary PEDOT–PSS structure at the molecular level. The secondary as well as the tertiary structure of this complex consists of charged EDOT oligomers (∼6–18 repeating units) distributed along a high molecular weight PSS chain, as proposed by Dimitriev et al.143.1 Morphology (TEM and DLS)
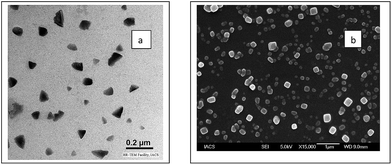
We observed PEDOT–PSS particles of a very similar size and shape from the three sets of solutions using the TEM and SEM images, as shown in Fig. 1a and b. Therefore, it can be stated that the particle size and morphology of PEDOT–PSS is independent of the initial concentration of monomer. Unlike spherical particles, which are generally obtained in dispersed systems, PEDOT–PSS consists of rectangular and triangular shaped discrete particles with two different size ranges, as observed from the TEM and SEM images. In the as-prepared samples (diluted thoroughly), particles of two different size ranges, namely, ∼70–100 nm and ∼400 nm were frequently observed. The sharp contrast of the particles indicates the large Π electron density commonly obtained for conjugated conducting polymers. In the DLS studies of the as-prepared samples, particles having diameter in the range of 20–25 nm, 70–85 nm and 650–970 nm were initially identified (Fig. 2a). When the study was repeated with thoroughly sonicated samples, the association among the particles was destroyed and particles of two size ranges, 25–35 nm and 350–460 nm, were obtained in the DLS spectrum (Fig. 2b) whereas larger structures disappeared from the SEM image (Fig. S1†).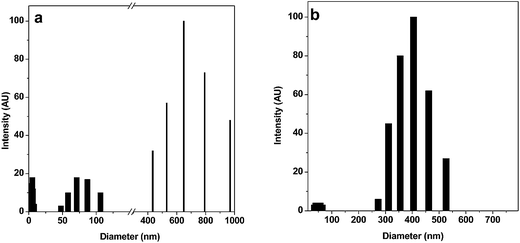 | ||
| Fig. 2 DLS spectra of PEDOT–PSS solution showing the particle size distribution in the system (a) before sonication, (b) after sonication. | ||
Therefore, it can be stated that freshly prepared PEDOT–PSS particles are smaller in size and dispersed in the medium. However, as a result of the multivalent Fe3+ the outer PSS− layer undergoes some degree of association that gives rise to the larger particles. Dimitriev et al.14 previously explored this system and showed the possibility of three types of interaction (primary, secondary and tertiary) within the system. They also showed small PEDOT particles distributed along the PSS chain (secondary structure) and larger gel-like particles consisting of a coiled PEDOT–PSS chain. However, from the TEM and SEM images and DLS spectra, it can be inferred that, despite complete dissociation of PSS in water, the PEDOT–PSS complex does not stay in a molecular wire/nanotube-like open structure, but rather remains in a partially coiled form as explained earlier.13 Our electronic structure studies on this system also corroborate the formation of a coiled structure.
3.2 UV-vis spectroscopy
As PSS has no absorption above 310 nm, the spectral response of PEDOT–PSS comes from the PEDOT moiety. The absorption spectra of three sets of PEDOT–PSS solutions (pH 2) more or less retain the spectral properties of PEDOT (Fig. 3a). The higher energy peak at ∼340 nm is assigned to the n–Π* transition in the PEDOT backbone and the broad band above 800 nm corresponds to bipolaron subgap states19–21 indicating the heavily doped and conductive nature of the sample.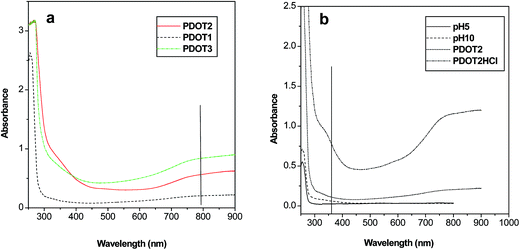 | ||
| Fig. 3 UV-vis absorption spectra of PEDOT–PSS solutions at (a) different concentrations and at (b) different pH values. | ||
On increasing the concentration of PEDOT, no spectral shift was observed but the absorption intensity increased over the whole range. Therefore, in the present system, PEDOT–PSS interaction is independent of PEDOT concentration. UV-vis spectra were also recorded on changing the pH from 2 (original) to 1 (HCl), 5 and 10 (NaOH). On increasing the pH (adding NaOH) to 5 and 10, PSS anions are removed from the PEDOT–PSS assembly, which destroys the mutual interaction between the polymers and breaks down the three-dimensional structure of the system. This conformational change hampers the carrier transport in the system, as a result of which the bipolaron band in the near-infrared (NIR) region flattens. On lowering the pH, the effect is reversed and the PEDOT–PSS interaction becomes stronger because of conformational effects. As a result, carrier transport is favored (although the doping level is unaltered) and the band at ∼800 nm becomes prominent (Fig. 3b). Yamashita et al.22 have also previously reported a similar effect of pH on the conductivity of PEDOT–PSS, whereas some other groups have observed improvement of conductivity in the presence of inert solvents such as sorbitol and polyethylene glycol and have termed this effect as secondary doping.13,23 Our samples have shown electrical conductivity of the order of 10−1 S cm−1 (P2: 0.6 S cm−1), which is a moderately high value, similar to that obtained earlier.13,22,23 Dimitriev et al.14 have made some attempt to enhance the conductivity of the system by controlling the interaction between PEDOT and PSS and have probed it spectroscopically. We have followed quantum mechanical calculations (to be discussed later) that have also revealed the appreciably high conductive nature of the system. Therefore, the experimental part of our work has established PEDOT–PSS to be a highly doped, electrically conductive system with good solution stability but of an entangled and polydispersive nature.
3.3 Quantum mechanical studies
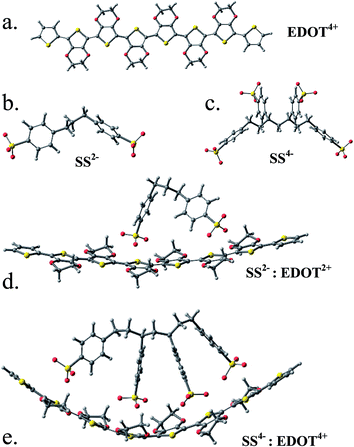
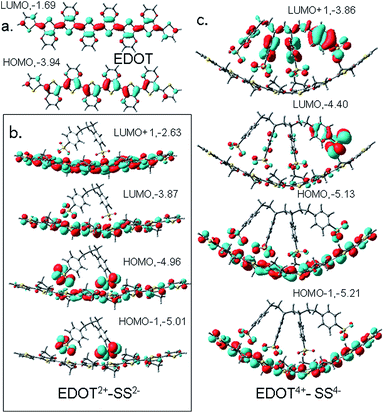
The relaxed structures of EDOT, EDOT2+ and EDOT4+ 8-mers are all planar and the tetracationic form is shown in Fig. 4a together with the relaxed structures of SS2−/SS4− (Fig. 4b and c). It is observed that, if the SS2−/SS4− unit is placed above the EDOT chain, it no longer remains planar and is bent concave to maximize the interaction with the anion (Fig. 4d and e). This, however, indicates that PEDOT and PSS do not stay parallel to each other to form a molecular wire/tube-like structure; rather, with an increase in chain length and charge density, the chain is gradually entangled/coiled as shown by the TEM/SEM images. This is in contrast to the study30 reported by Dkhissi et al. where the authors carried out theoretical studies of the structure of doped PEDOT using a combination of ab initio and molecular mechanics methods in the presence of PSS counterions. They, however, froze the structure of PEDOT to a planar conformation, which did not allow them to check the deformation in the cationic backbone of the complex.
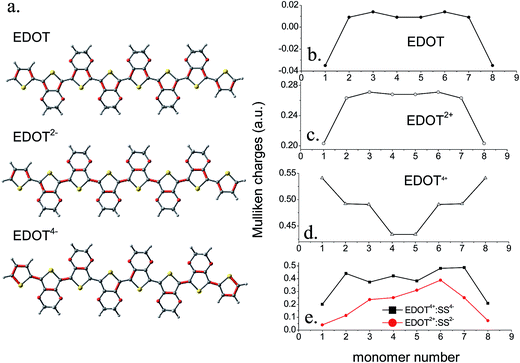
![[double bond, length as m-dash]](https://www.rsc.org/images/entities/char_e001.gif) C) are shown in a red color and it is clear that undoped EDOT is largely aromatic, while the dication has contributions from quinonoid structures. The bond lengths of the tetracation are partially quinone-like. In the doped dicationic complex PEDOT2+–PSS2, the charged sulfonate groups interact with the PEDOT2+ chain and the closest distances of the O-atoms of the two sulfonate groups to the thiophene S atoms are 3.2 Å and 3.5 Å. The binding energy of the SS2− to EDOT2+ is found to be reasonably large (183.85 kcal mol−1, details in ESI†). Interaction between EDOT4+–SS4− is stronger compared to EDOT2+–SS2− where each of the four sulfonate groups interacts with thiophene moieties and a binding energy as large as 629.8 kcal mol−1 is observed. As expected, the structure shows a close positioning of the negatively charged sulfonate groups on top of the EDOT chain where the positive charges are accumulated and the closest distance of approach of the O atoms of the –SO3H group to the thiophene S are 3.2–3.6 Å.
C) are shown in a red color and it is clear that undoped EDOT is largely aromatic, while the dication has contributions from quinonoid structures. The bond lengths of the tetracation are partially quinone-like. In the doped dicationic complex PEDOT2+–PSS2, the charged sulfonate groups interact with the PEDOT2+ chain and the closest distances of the O-atoms of the two sulfonate groups to the thiophene S atoms are 3.2 Å and 3.5 Å. The binding energy of the SS2− to EDOT2+ is found to be reasonably large (183.85 kcal mol−1, details in ESI†). Interaction between EDOT4+–SS4− is stronger compared to EDOT2+–SS2− where each of the four sulfonate groups interacts with thiophene moieties and a binding energy as large as 629.8 kcal mol−1 is observed. As expected, the structure shows a close positioning of the negatively charged sulfonate groups on top of the EDOT chain where the positive charges are accumulated and the closest distance of approach of the O atoms of the –SO3H group to the thiophene S are 3.2–3.6 Å.
The Mulliken atomic charges for the uncomplexed EDOT, EDOT2+, EDOT4+, EDOT2+–SS2− and EDOT4+–SS4− are shown in Fig. 5b–e. The charge distribution of uncharged EDOT (Fig. 5b) shows that, for the singlet optimized geometry, there are negligible charges on the central rings of the backbone compared with the other rings, with the charge slightly increasing from the middle and then decreasing drastically for the two end rings. This finding matches with the study of the uncharged neutral trimer which is included in the ESI.† The same trend is observed for EDOT2+ although the charges are significantly higher in this case. For example, in EDOT2+ (Fig. 5c), the atomic charges are 0.20, 0.26, 0.27, 0.27, 0.27, 0.27, 0.26, and 0.20 for the eight thiophene rings. Indeed, according to Fig. 6a, the end rings are aromatic, whereas the other rings are quinoid. This phenomenon of increasing charge from the middle to the ends of the chain is especially pronounced for the tetracation EDOT4+ (Fig. 5d). EDOT4+ has atomic charge distribution of 0.54, 0.49, 0.49, 0.43, 0.43, 0.49, 0.49 and 0.54 for the eight rings. This pattern represents the presence of two separated polarons at the two sides of the chain, with the separation region lying in the middle of the chain. The charges calculated on the rings after complexation of EDOT2+ with monomeric SS2− are positive and are 0.04, 0.11, 0.24, 0.25, 0.31, 0.39, 0.25 and 0.07 on the eight rings (Fig. 5e). Since the anion is not positioned exactly on top of the centre of the molecule, the charge distribution is not symmetrical and the maximum positive charge is on the rings which directly face the –SO3H groups of the anion, indicating a strong interaction and a possibility of a helical/coiled structure of the complex. When EDOT4+ interacts with the styrene sulfonate tetramer, SS4−, there is still more bending of the cationic EDOT (see Fig. 4), and the average charges on the rings after complexation are calculated as 0.20, 0.44, 0.37, 0.42, 0.38, 0.48, 0.49 and 0.21. The thiophene rings, which face the sulfonate groups show more pronounced charges and because the anion is not placed symmetrically the overall symmetry in the charge distribution is also lost after complexation.
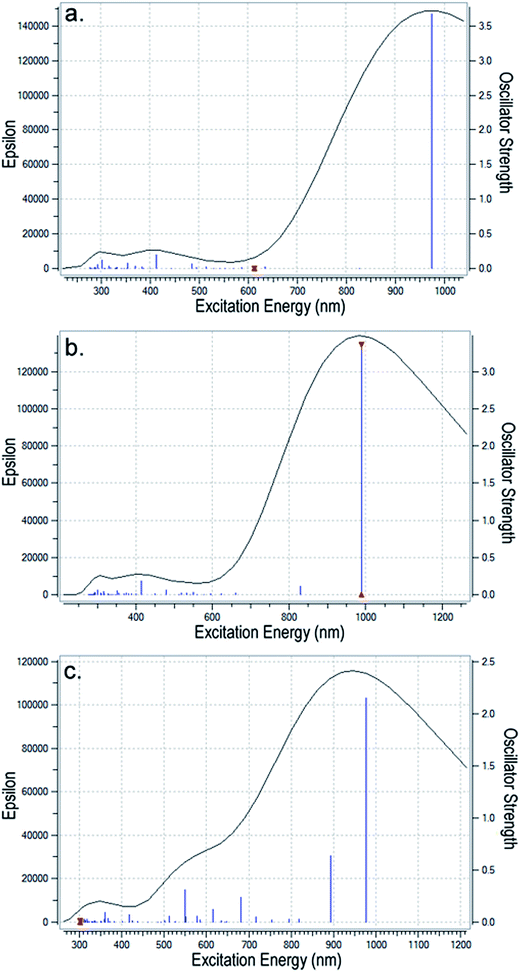 | ||
| Fig. 7 The UV-vis spectra for (a) PEDOT2+ (without PSS2− counterion); (b) PEDOT2+ slightly bent to interact with the dianion; and (c) PEDOT4+ with more bending when it interacts with the tetracation. | ||
Analysis of the electronic transitions calculated using TD-DFT reveals that the most intense transition in these samples is at ∼900 nm with an oscillator strength >3 which corresponds to the HOMO to LUMO transition in the polymer. For planar PEDOT2+ without PSS2− (Fig. 7a), two intense peaks appear at ∼300 nm and ∼415 nm because of transitions from HOMO to LUMO + 2, HOMO − 1 to LUMO + 1 and HOMO − 4 to LUMO + 2 orbitals. These peaks are almost retained in the dicationic complex (Fig. 7b) but are shifted and overlapped with other weak transitions from inner occupied orbitals to LUMO or LUMO + 1/LUMO + 2 orbitals to create a hump in the 300–400 nm region in the bent tetracationic complex. At the same time, several transitions from inner occupied states to the LUMO + 1 orbital takes place in the curved dicationic and bent tetracationic complexes that appear in the region of 550–650 nm. As a result, the valley in the 500–600 nm region gradually diminishes and a broader hump above 500 nm appears for the tetracationic sample (Fig. 7c). Enlarged versions of these figures are included in the ESI (Fig. S7(a)–(c)†). As we compare the results of the theoretical spectra with our own experimental results (Fig. 3a and b) and also those from earlier investigations, we observe good agreement. The bands at lower wavelengths (370 nm, 415 nm) are assigned to the n–Π* transition in the polymer and the broad hump above 900 nm is assigned to the bipolaronic transition.19–21 The large bipolaronic hump indicates the highly conductive nature of the samples. Furthermore, the gradual broadening of the bipolaronic hump in the polymeric complex is also accounted for by macroionic interactions and related bending of the total moiety. As the polymeric complex is bent gradually, degeneracies of different energy levels are disturbed and several weaker transitions take place within the 500–600 nm region, which result in the observed broadening of the bipolaronic peak. Earlier studies have also experimentally established similar changes in UV-vis spectra with an increase in the extent of cation–anion interaction in the PEDOT–PSS system.14,31 The theoretical modeling of the UV-vis spectra helps us to understand the origin of the electronic transitions and subsequent changes occurring upon interaction with the counterion. This helps to resolve the nature of interaction between the components and supports the formation of a bent/helical polymeric structure.
To summarize, the theoretical studies indicate that: (1) PEDOT and PSS oligomers do not stay parallel to each other to form a molecular wire tube-like structure after polymerization – rather, with increase in chain length, the chain is gradually bent around the anionic PSS unit; (2) atomic charge distribution patterns in the PEDOT–PSS oligomers represent the presence of two separated polarons at the two sides of the chain, and the asymmetry in charge distribution also suggests coiled/helical complex formation; (3) analysis of molecular orbitals and HOMO–LUMO gaps indicates a strong conducting nature; and (4) the simulated optical spectra are very similar to experimentally obtained spectra and support the conducting nature.
4. Conclusion
This article explores the nature of interaction between the two polymers PEDOT and PSS which combine to form a well-known aqueous solution with many unique properties. From experimental and theoretical studies we have observed that, unlike other dispersed systems, PEDOT particles are not dispersed in the PSS matrix; rather, PEDOT–PSS particles as a whole are enveloped in an outer PSS–water medium that is the key reason for the unique stability of this solution. PEDOT and PSS form a supramolecular assembly of unique stability in aqueous medium; even oligomers such as 8-mer/3-mer of PEDOT, which are fully planar in isolated form, gradually bend to maximize the interactions with the counterion with thiophene rings facing the sulfonate groups. This indicates the possibility of the formation of a partially coiled or helical structure of the interpolymer complex leading to the formation of particles in reality (as found in the TEM and SEM images) rather than simple side-by-side interaction leading to molecular wires. The helical structure as well as the highly conductive nature of the sample were also supported by the models of UV-vis spectra of the polymeric complex. It is hoped that this understanding will pave the way for new studies with PEDOT that will lead to new insights and more control over the physical and optical properties of PEDOT.Acknowledgements
Corresponding authors acknowledge SERC-DST (India) for financial assistance, project no. SR/FT/CS-119/2010 & SR/WOS-A/CS-77/2011. MRM acknowledges CSIR (India) for granting an SRF.References
- A. G. Bayer, Eur. Patent 440957, 1991; A. Gevaert, Eur. Patent 564911, 1993.
- S. Kirchmeyer and K. Reuter, J. Mater. Chem., 2005, 15, 2077 RSC.
- L. Groenendaal, F. Jonas, D. Freitag, H. Pielartzik and J. R. Reynolds, Adv. Mater., 2000, 12, 481 CrossRef CAS.
- H.-E. Yin, F.-H. Huang and W.-Y. Chin, J. Mater. Chem., 2012, 22, 14042 RSC.
- R. W. Heuer, R. Wehermann and S. Kirchmeyer, Adv. Funct. Mater., 2002, 12, 89 CrossRef.
- A. N. Aleshin, S. R. Williams and A. J. Heeger, Synth. Met., 1998, 94, 173 CrossRef CAS.
- http://www.conductive-polymer.com/orgacon-conductive-inks.html.
- F. Jonas, W. Craft and B. Muys, Macromol. Symp., 1995, 100, 169 CrossRef PubMed.
- M.-A. De Paoli, G. Casalbore-Miceli, E. M. Girotto and W. A. Gazotti, Electrochim. Acta, 1999, 44, 2983 CrossRef.
- Y. Cao, G. Yu, C. Zhang, R. Menon and A. J. Heeger, Synth. Met., 1997, 87, 171 CrossRef CAS.
- J. Ouyang, C.-W. Chu, F.-C. Chen, Q. Xu and Y. Yang, Adv. Funct. Mater., 2005, 15, 203 CrossRef CAS PubMed.
- Y. Yoshika and G. E. Jabbour, Synth. Met., 2006, 156, 779 CrossRef PubMed.
- B. Fan, X. Mei, J. Ouyang, B. Fan, X. Mei and J. Ouyang, Macromolecules, 2008, 41, 5971 CrossRef CAS.
- O. P. Dimitriev, Y. P. Piryatinski and A. A. Pud, J. Phys. Chem. B, 2011, 115, 1357 CrossRef CAS PubMed.
- M. J. Frisch, et al., Gaussian 03, Revision C.02, Wallingford-CT, 2004 Search PubMed.
- A. D. Becke, J. Chem. Phys., 1993, 98, 5648 CrossRef CAS PubMed.
- A. D. Becke, Phys. Rev. A, 1998, 38, 3098 CrossRef.
- S. I. Gorelsky, SWizard program, University of Ottawa, Ottawa, Canada, 2013, http://www.sg-chem.net/ Search PubMed.
- J. Ouyang, X. Qianfei, C.-W. Chu, Y. Yanga, G. Li and J. Shinar, Polymer, 2004, 45, 8443 CrossRef CAS PubMed.
- J. L. Bredas, F. Wudl and A. J. Heeger, Solid State Commun., 1987, 63, 577 CrossRef CAS.
- V. Rumbau, J. A. Pomposo, A. Eleta, J. Rodrigues, H. Grande, D. Mecerreyes and E. Ochoteco, Biomacromolecules, 2007, 8, 315 CrossRef CAS PubMed.
- M. Yamashita, T. Sasaki, H. Okuzaki and C. Otani, IEEE Xplore digital library DOI:10.1109/IRMMW-THz.2012.6380295.
- J. Ouyang, ACS Appl. Mater. Interfaces, 2013, 5, 13082 CAS.
- J. Casado, V. Hernandez, F. J. Ramirez and J. T. Lopez Navarrete, J. Mol. Struct.: THEOCHEM, 1999, 463, 211 CrossRef CAS.
- S. S. Zade and M. Bendikov, J. Phys. Chem. B, 2006, 110, 15839 CrossRef CAS PubMed.
- S. S. Zade and M. Bendikov, Chem.–Eur. J., 2007, 13, 3688 CrossRef CAS PubMed.
- C. Aleman and J. Casanovas, J. Phys. Chem. A, 2004, 108, 1440 CrossRef CAS.
- G. Agalyaa, C. Lva, X. Wanga, M. Koyamaa, M. Kuboa and A. Miyamoto, Surf. Sci., 2005, 244, 195 CrossRef PubMed.
- A. Dkhissi, D. Beljonne, R. Lazzaroni, F. Louwet and B. Groenendaal, Theor. Chem. Acc., 2008, 119, 305 CrossRef CAS PubMed.
- A. Dkhissi, D. Beljonnea and R. Lazzaronia, Synth. Met., 2009, 159, 546 CrossRef CAS PubMed.
- S. Nagarajan, J. Kumar, F. F. Bruno, L. A. Sammuelson and R. Nagarajan, Macromolecules, 2008, 41, 3049–3052 CrossRef CAS.
Footnotes |
| † Electronic supplementary information (ESI) available: Details of the experimental part and theoretical modeling of EDOT trimers and octamers, and a few SEM pictures are available free of cost at http://www.rsc.org. See DOI: 10.1039/c4ra08666j |
| ‡ HOMO − n is the nth MO lower in energy than HOMO and LUMO + n is the nth MO higher in energy than the LUMO. |
| This journal is © The Royal Society of Chemistry 2014 |

