Polyaniline coating on carbon fiber fabrics for improved hexavalent chromium removal†
Bin Qiuab,
Cuixia Xuac,
Dezhi Sun*b,
Huige Weia,
Xi Zhangac,
Jiang Guoa,
Qiang Wangb,
Dan Rutmana,
Zhanhu Guo*a and
Suying Wei*ac
aIntegrated Composites Laboratory (ICL), Dan F Smith Department of Chemical Engineering, Lamar University, Beaumont, TX 77710, USA. E-mail: suying.wei@lamar.edu; zhanhu.guo@lamar.edu
bCollege of Environmental Science and Engineering, Beijing Forestry University, Beijing, 100083, China. E-mail: sundezhi@bjfu.edu.cn
cDepartment of Chemistry and Biochemistry, Lamar University, Beaumont, TX 77710, USA
First published on 19th June 2014
Abstract
Carbon fabrics (CFs) loaded with 5.0, 10.0, 15.0 and 20.0 wt% polyaniline (PANI) (PANI/CF) prepared by soaking carbon fiber fabrics in 1.0 wt% PANI m-cresol solution have demonstrated superior hexavalent chromium (Cr(VI)) removal performance compared to the as-received CFs. The PANI/CF nanocomposites were noticed to remove Cr(VI) from solutions with an initial Cr(VI) concentration of 1.0 mg L-1 within 15 min, which is faster than the conventional active carbon (6 h) and the as-received CFs (>1 h). A better Cr(VI) removal efficiency was observed in the acidic solutions than in the basic solutions. A pseudo-second-order behavior was justified for the PANI/CF with a much higher removal rate (0.06 g mg-1 min-1) than the reported ~0.03 g mg-1 min-1 for the active carbon. The adsorption isotherm study demonstrated that the adsorbents follow the Langmuir model with a calculated maximum adsorption capacity of 18.1 mg g-1 for the 10.0 wt% PANI/CF. The Cr(VI) removal mechanisms explored by FT-IR and XPS involve the reduction of Cr(VI) to Cr(III) by PANI. The PANI/CF adsorbents have demonstrated easy recycling capability for up to five cycles with a Cr(VI) removal rate at above 91%.
1. Introduction
Over the past decades, hexavalent chromium (Cr(VI)) pollution has become a serious environmental problem owing to its toxicity to living organisms and its potential carcinogenicity for human beings.1–3 The Cr(VI) concentration in wastewater must be reduced to an acceptable level before being discharged into environment, in order to avoid affecting the quality of potable water and the threats to public health. The US Environmental Protection Agency (EPA) has issued a maximum contaminant level of 100 µg L-1 for total chromium according to the national primary drinking water regulations. World Health Organization has recommended a maximum allowable concentration in drinking water for Cr(VI) is 50 µg L-1. Many technologies have been developed to remove Cr(VI) from solutions, such as electro-chemical precipitation,4 ion exchange,5 reverse osmosis6 and adsorption.7–10 In recent years, the adsorption technique is favorable for Cr(VI) removal from wastewaters due to its low operation cost and high removal efficiency. Active carbon,11 iron materials,12–14 cellulose,15,69 biomass9 and polymers2,16 have been used as adsorbents for Cr(VI) removal. The Cr ions in the environment have been documented as two main forms, i.e., hexavalent chromium Cr(VI) and trivalent Cr(III). The Cr(III) is less toxic and soluble than Cr(VI), and thus less mobile in the environment. The Cr(VI) in wastewater are mainly chromate (CrO42-), dichromate (Cr2O72-) and hydrogen chromate (HCrO4- and H2CrO4),17 which are dependent on the pH value and total chromate concentration in the solution. The HCrO4- is the dominant form in solutions with pH value lower than 6.8, while only CrO42- is stable when pH is above 6.8. HCrO4- with a higher redox potential (1.33 V) than CrO42- can be easily reduced to Cr(III).16,17 Therefore, the reduction of Cr(VI) to Cr(III) is an effective approach to remediate the Cr(VI) contamination.18,19 Recently, the adsorbents that can adsorb and reduce Cr(VI) to Cr(III) simultaneously have been more interesting for the treatment of Cr(VI) contaminants. These adsorbents can also act as electron donors for Cr(VI) reduction to Cr(III). Various of materials, such as zero-valent iron particle,18 polymer16 and Fe(II)20 have been reported as the electron donors for the reduction of Cr(VI). Among these electron donors, polymers including polyaniline (PANI),16,21,22 polyacrylamide23 and polyethylenimine24 have been paid increasing attention for heavy metal removal due to their high removal efficiency. For example, PANI, as a member of conductive polymers, has been paid more attention due to its wide potential applications including rechargeable batteries,25 sensors,26 electrochromic devices27,28 and corrosion inhibitors.29 PANI is also considered as a good adsorbent for Cr(VI) removal16,21,22,24 due to its good reduction behaviors. Powder form of PANI has been used to remove Cr(VI) from solution with a good removal efficiency due to its large surface area and numerous active sites.30 However, the recycling and regeneration of PANI powders challenge its application due to its small size. Thus, PANI has also been prepared as the film form for the removal of Cr(VI).17,27 The results indicated that the Cr(VI) removal by PANI film was limited by the decreased specific surface area and fewer accessible active adsorption sites.Nowadays, PANI has been coated on the surface of other easily separated materials including magnetite (Fe3O4) nanoparticles,16,31 chitosan,32 sawdust33 and fibers,34 which have demonstrated good performances on the removal of pollutants. Among these materials, carbon materials were widely used as supports for synthesizing carbon-based photocatalysts35,36 and adsorbents37–40 for organics removal, due to the large specific surface area. Carbon fibers have been considered as good adsorbents for removing heavy metal,37–40 phosphate41 and dye42 from wastewaters. Carbon fibers exhibit an excellent adsorption property compared with granular active carbon due to the smaller fiber diameter and concentrated pore distribution.38 Also, carbon fibers with a strong mechanical property can resist the acidic and alkaline conditions and maintain the structural stability at a high temperature up to hundreds degrees,38 and display low adsorption selectivity towards pollutants.37,38,43 However, carbon fibers need several hours to reach the adsorption equilibrium, and have a small adsorption capacity. Thus the modification of carbon fibers with polymers possessing various functional groups is needed to improve both the adsorption rate and the adsorption capacity. PANI has been successfully coated on the surface of carbon nanofibers (CNFs) by vapor deposition polymerization method for electrochemical energy storage applications.44 However, the vacuum and heating condition were needed for the composite synthesis over a long time of 24 hours. And the heavy metal removal performance and removal mechanisms have not been reported.
In this study, polyaniline (PANI) coating on the surface of carbon fiber fabrics (CFs) has been achieved by soaking CFs with 4.0 wt% PANI m-cresol solution and the PANI loading was controlled at 5.0, 10.0, 15.0 and 20.0 wt%. The morphology was characterized by scanning electron microscope (SEM). The functional group was determined by Fourier transform infrared spectroscopy (FT-IR) and X-ray photoelectron spectroscopy (XPS). The thermal stability was evaluated by thermo-gravimetric analysis (TGA). The Cr(VI) removal performances were explored by adsorption batch assays. The effects of PANI loading, treatment time, initial pH value and Cr(VI) concentration on the Cr(VI) removal were investigated. The adsorption kinetics and isothermal adsorption behaviors of the adsorbents have been studied as well. Meanwhile, the Cr(VI) removal mechanisms by PANI/CFs was investigated based on the results from FT-IR and XPS. The recycling and regeneration of PANI/CFs were also reported.
2. Experimental
2.1 Materials
Carbon fiber fabrics with a specific surface area of about 1500 m2 g-1 were obtained from American Technical Trading Inc. Aniline (C6H7N), ammonium persulfate (APS, (NH4)2S2O8), p-toluene sulfonic acid (PTSA, C7H8O3S) and m-cresol were purchased from Sigma Aldrich. Potassium dichromate (K2Cr2O7) and 1,5-diphenylcarbazide (DPC) were purchased from Alfa Aesar Company. Phosphoric acid (H3PO4, 85 wt%) was obtained from Fisher Scientific. All the chemicals were used as received without any further treatment.2.2 Preparation and characterization of PANI/CFs
PANI was synthesized by the method as described in a previous work.45 Briefly, PTSA (30.0 mmol) and APS (18.0 mmol) were added in 200.0 mL deionized water in an ice-water bath for one-hour sonication. Then the aniline aqueous solution (36.0 mmol in 50.0 mL deionized water) was mixed with the above solution and was sonicated continuously for additional one hour in an ice-water bath for polymerization. The product was vacuum filtered and washed with deionized water until pH was about 7 and was further washed with methanol to remove any possible oligomers. The final PANI product was dried at 50 °C overnight. The PANI was then dissolved in m-cresol to obtain a concentration of 4.0 wt% PANI solution. The as-received CFs (4.0 g) were treated with concentrated HNO3 at 50 °C, in which the CFs were oxidized. The generated carboxyl groups provided the active sites for the PANI coating. The treated CFs were then washed by deionized water until pH being 7. The washed CFs were dried at 50 °C overnight. 5.4, 11.2, 17.6 and 25.0 g PANI solution were soaked on the surface of CFs (4.0 g) to obtain the PANI/CFs with 5.0, 10.0, 15.0 and 20.0 wt% PANI loading. The PANI/CFs were dried at room temperature, and were washed with deionized water, and then dried for further usage. It is worth noting that it was impossible to obtain PANI coating without acid treatment.The morphology of the PANI/CFs was characterized by a JEOL field emission scanning electron microscope (SEM, JSM-6700F system). The functional group was characterized by the Fourier transform infrared spectroscopy (FT-IR, a Bruker Inc. Vector 22 coupled with an ATR accessory) in the range of 600 to 4000 cm-1 at a resolution of 4 cm-1. The thermal stabilities of the pure CFs, PANI/CFs before and after treating with Cr(VI) were conducted in a thermo-gravimetric analysis (TGA, TA instruments, Q-500) with a heating rate of 10 °C min-1 under an air flow rate of 60 mL min-1 from 25 to 800 °C. The specific Brunauer–Emmett–Teller (BET) surface area and pore size distribution were measured on a Quantachrome Nova 2200e by nitrogen adsorption at 77.4 K. Prior to each measurement, the samples were degassed at 200 °C for 24 hours under high vacuum (<0.01 mbar). The pore size was calculated by the Barrett–Joyner–Halenda (BJH) method using desorption isotherms. The X-ray photoelectron spectroscopy (XPS) measurements were performed in the Kratos AXIS 165 XPS/AES instrument using a monochromatic Al K radiation to see the elemental compositions. The N1s, C1s and Cr2p peaks were deconvoluted into the components consisting of a Gaussian/Lorentzian line shape function (Gaussian = 80%, Lorentzian = 20%) on Shirley background.
2.3 Cr(VI) adsorption by PANI/CF
The effects of PANI loadings on the Cr(VI) removal were investigated by using pure CFs (50 mg), PANI/CF with a PANI loading of 5.0 (52.5 mg), 10.0 (55.0 mg), 15.0 (57.5 mg) and 20 wt% (60.0 mg) to treat 4.0 mg L-1 Cr(VI) solutions (20.0 mL, pH = 1.0) for 60 min without any agitation. Then these solutions were taken out and determined for Cr(VI) concentrations. For comparison, the as-received CFs (50.0 mg) were used to treat 20.0 mL Cr(VI) solution at pH 1.0 with an initial Cr(VI) concentration of 4.0 mg L-1 for 60 min.The effects of initial pH on the Cr(VI) removal were investigated using the PANI/CF with a PANI loading of 10.0 wt%. The pH values of 1.0, 2.0, 3.0, 5.0, 7.0, 9.0 and 11.0 were selected. The initial pH of Cr(VI) solutions was adjusted by NaOH (1.0 mol L-1) and H2SO4 (1.0 mol L-1) with a pH meter (Vernier Lab Quest with pH-BTA sensor). The PANI/CFs (55.0 mg) were added in 20.0 mL Cr(VI) solutions (4.0 mg L-1) for 60 min.
The effects of initial Cr(VI) concentration on the Cr(VI) removal were investigated by using PANI/CFs (55.0 mg) to treat Cr(VI) solutions (20.0 mL, pH = 1.0) with Cr(VI) concentration varying from 1.0 to 56.0 mg L-1 for 60 min. For kinetic study, the synthesized PANI/CFs were carried out to treat 20.0 mL Cr(VI) solution with an initial Cr(VI) concentration of 24.0 mg L-1 at pH 1.0 for different treatment time.
After adsorption, 20 mL HCl solution (0.1 M) was used to desorb the Cr adsorbed on the PANI/CFs.15,24 The Cr(VI) concentration in the desorption solution was measured. For the total Cr concentration in the desorption solution, the desorption solution was firstly oxidized by oxidant APS in an acidic condition at 100 °C.46 The total Cr concentration was determined by the same procedure as the measurement of Cr(VI). APS was added to the desorption solution for oxidation of Cr(III) to Cr(VI), and therefore the Cr(VI) concentration was the total Cr concentration. The Cr(III) concentration was calculated from the difference between the total Cr and Cr(VI) concentration. All the Cr(VI) removal tests were all conducted at room temperature.
The final concentration of Cr(VI) was determined by colorimetric method7 by using the obtained standard fitting equation: A = 9.7232 × 10⁻⁴C, where C is the concentration of Cr(VI), A is the absorbance at 540 nm obtained from the UV-vis test.
The Cr(VI) removal percentage (R%) is calculated using eqn (1):
 | (1) |
 | (2) |
2.4 PANI/CF regeneration
The PANI/CFs were used to treat 20 mL Cr(VI) solution (4.0 mg L-1), and then were taken out and regenerated by immersing in 20 mL HCl solution (0.1 M) for 30 min.15,24 The Cr adsorbed on the PANI/CF was released in the desorption solution. The PANI/CFs were then washed with deionized water until pH being 7. The regenerated PANI/CFs were then used to treat 20 mL Cr(VI) solution (4.0 mg L-1) again. The adsorption–desorption processes were conducted for 5 times. The Cr(VI) removal efficiency by the generated PANI/CFs was determined each time.3. Results and discussion
3.1 Characteristics of PANI/CFs
Fig. 1 shows the SEM microstructures of the as-received CFs and PANI/CFs with different PANI loadings. Compared to the as-received CFs, Fig. 1a, the surface of PANI/CFs became rougher Fig. 1b–e, indicating that PANI was grafted on the fiber surface. It was noted that the PANI in the PANI/CFs with 5.0 and 10.0 wt% PANI loading was distributed homogeneously on the surface of CFs, Fig. 1b&c, while obvious aggregates of PANI were observed on the surface of CFs when the PANI loading was higher than 10.0 wt%, Fig. 1d&e.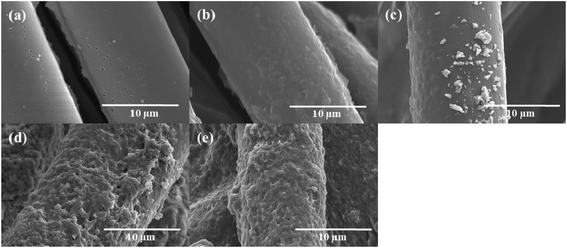 | ||
| Fig. 1 SEM microstructures of (a) the as-received CFs, PANI/CFs with a PANI loading of (b) 5.0, (c) 10.0, (d) 15.0, and (e) 20.0 wt%. | ||
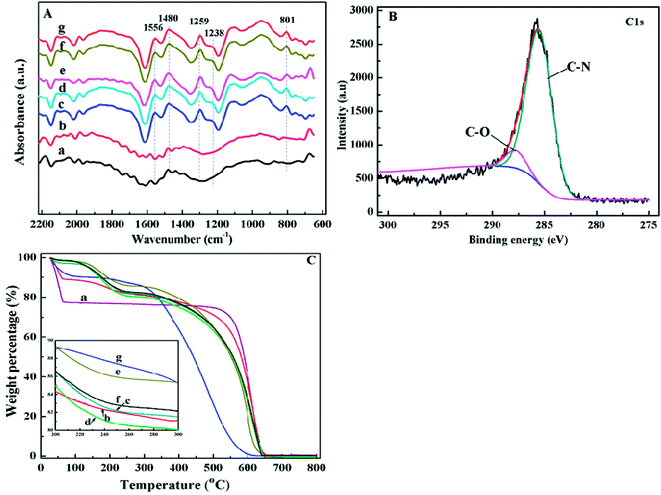
In the FT-IR spectrum of pure PANI, Fig. 2A(g), the absorption peaks at 1556 and 1238 cm-1 correspond to the C?C stretching vibration47,48 and the C–H stretching vibration of quinoid ring.49 The peaks at 1480 and 1295 cm-1 are related to the C?C stretching vibration47,48 and C–N stretching vibration of benzenoid ring.48 The peak at around 801 cm-1 is due to the out-of-plane bending of C–H in the substituted benzenoid ring.50 As shown in Fig. 2A(c–f), the peaks related to the groups of PANI also appeared in the FT-IR spectra of PANI/CFs, indicating a successful coating of PANI on the surface of CFs. The ratio of N–B–N (1459 cm-1) to N?Q?N (1562 cm-1) being about one indicates the emeraldine base (EB) form PANI.51
Fig. 2B shows the C1s XPS spectrum of the synthesized PANI/CFs with 10.0 wt% PANI loading. The C1s peak was deconvoluted to two major components with the binding energy peaks at 285.5 and 287.7 eV, which are attributed to the C–N and C–O, respectively.52 The N1s XPS spectrum of PANI/CF with 10.0 wt% PANI loading (Fig. S1†) was deconvoluted to four major components with the peaks at 398.9, 400.0, 401.6 and 403.6 eV, which are related to the undoped imine (–N?), undoped amine (–NH–), doped imine and doped amine group (N+), respectively.53 The equal proportions of imine and amine groups in N1s component confirmed that the PANI coated on the surface of CFs presented as the EB form,54 which is consistent with the results from FT-IR spectra of the synthesized PANI/CFs (Fig. 2A(c–f)).
As shown in Fig. 2C(a), three-stage weight losses were observed for pure CFs. The significant weight loss before 100 °C is attributed to the loss of moisture in the CFs. The others are at 175 and 600 °C due to the elimination of dopant anion and the degradation of CFs. For pure PANI (Fig. 2C(g)), two-stage weight losses are observed at 100 and 550 °C, which is consistent with the previous reports.16,45 With coating the PANI on the surface of CFs (Fig. 2C(c–f)), the increased thermal stability was observed in the PANI/CFs than pure PANI. However, the weight losses of PANI/CFs before 100 °C were less than that of pure CFs, indicating that water content in the CFs decreased after being coated with PANI. The decreased water content is due to the hydrophobic property of PANI.55 Also, no obvious difference was observed between the PANI/CFs with PANI loadings of 10.0, 15.0 and 20.0 wt%.
The nitrogen adsorption–desorption isotherms of the CFs (Fig. S2†) and PANI/CFs with different PANI loadings showed the representative type-IV curves with hysteresis loops. The specific surface area and the pore characterizations were summarized in Table 1, the specific surface area of 1514.2 m2 g-1 for the CFs was increased to 1622.4 m2 g-1 after CFs coated with 5.0 wt% PANI. The specific surface area of the PANI/CFs was decreased obviously with increasing the PANI loading. The PANI exhibited an decrease in specific surface area with increasing the PANI loading. The BJH pore sizes calculated from desorption branches were showed in Table 1. The pore radius size of CFs is centered at 16.14 Å with a narrow size distribution, which indicated a pore diameter of 32.28 Å. The pore size distribution of PANI/CFs was shifted to bigger with increasing the PANI loading. The PANI/CFs with a PANI loading of 10.0 wt% have a pore diameter of 43.08 Å, which indicated the mesoporous property of PANI/CF.56,57 However, the pore diameter of PANI/CFs with a PANI loading of 15.0 and 20.0 wt% increased to 50.46 and 58.38 Å.56,57 The micropore volume of CF increases with increasing the PANI loading, while the mesopore volume decreases after coating with PANI. PANI with a bigger density has an extra weight on the composites. Also the aggregation of PANI was observed on the surface of CFs (Fig. 1d and e). The PANI particles could either fill in the pore to occupy the effective surface or to block partial channels within the fibers, leading to a decreased surface area of CFs.
| Samples | A | B | C | D | E | F | G |
|---|---|---|---|---|---|---|---|
| a A is CFs; B–E represent the PANI/CFs with 5.0, 10.0, 15.0 and 20.0 wt% of PANI loading, respectively. F and G represent the PANI/CFs with a 10.0 wt% loading after treated with 4.0 and 12.0 mg L-1 Cr(VI) solution. | |||||||
| BET surface area (m2 g-1) | 1514.2 | 1622.4 | 1017.3 | 728.7 | 658.5 | 829.3 | 305.3 |
| Pore radius size (Å) | 16.15 | 16.16 | 21.54 | 25.23 | 29.19 | 23.89 | 16.48 |
| Micropore volume (cc g-1) | 0.052 | 0.074 | 0.040 | 0.721 | 0.942 | 0.105 | 0.056 |
| Mesopore volume (cc g-1) | 0.567 | 0.881 | 0.278 | 0.185 | 0.118 | 0.138 | 0.138 |
3.2 Cr(VI) removal
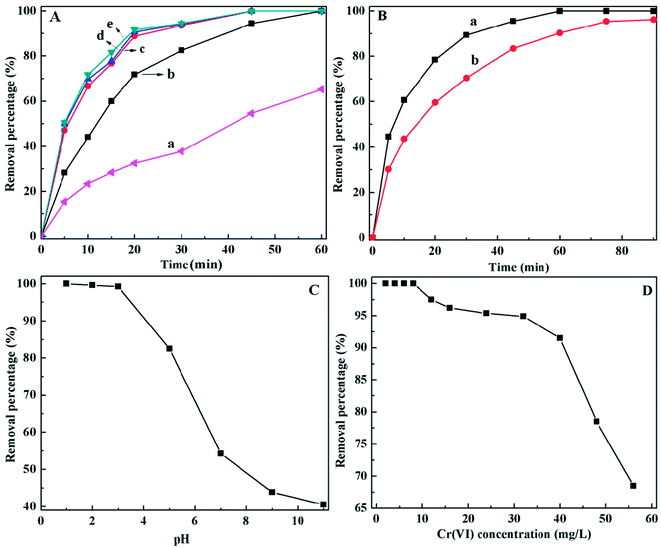
As shown in Fig. 3B(a&b), the PANI/CFs can reach at adsorption equilibrium within 60 and 75 min when the initial concentration of Cr(VI) was 4.0 and 24.0 mg L-1 with a pH of 1.0. It is interesting that the ~62 and 45% Cr(VI) can be removed by 2.75 g L-1 PANI/CF within 10 min. It is also noted that the Cr(VI) solution with a concentration of 1000 µg L-1 can be completely removed within 15 min (Fig. S3†), indicating that the PANI/CFs can be used as an effective adsorbent for fast removal of Cr(VI) with low concentrations. The Cr(VI) adsorption equilibrium time by PANI/CF is much shorter than that of the active carbon (6 hours),11 and polyethylenimine grafting with aerobic granules (3 hour),17 but longer than that by magnetic polyaniline nanocomposite (5 min).16 However, the PANI loading was up to 70% in the magnetic nanocomposites, which is much higher than the 10.0 wt% PANI loading used in this study.
The initial pH value of solution is one of the most important variables affecting the Cr(VI) removal. The Cr(VI) removal efficiency by PANI/CFs under different pH conditions was shown in Fig. 3C with an initial Cr(VI) concentration of 2.0 mg L-1 and PANI/CF dose of 2.75 g L-1. The complete Cr(VI) removal was achieved at pH 1.0, while a little decreased removal efficiency is observed under acidic conditions, which is consistent with the 20 mL 4.0 mg L-1 Cr(VI) complete removal by the PANI/Fe3O4 nanocomposite adsorbents (10 mg) within 5 min under acidic condition.16 Then the Cr(VI) removal efficiency decreased significantly with increasing pH, only ~40% Cr(VI) can be removed from wastewater under basic conditions. These indicate that the PANI/CFs favor removing the HCrO4- rather than CrO42-. The most important forms of Cr(VI) in solution are chromate (CrO42-), dichromate (Cr2O72-) and hydrogen chromate (HCrO4- and H2CrO4) and these ion forms are related to the pH value total Cr concentration in the solutions.17 The HCrO4- is the dominant forms when pH is lower than 6.8, while only CrO42- is stable when pH is above 6.8.17 The H2CrO4 concentration is increased when the solution pH is below 2,17 indicating that the PANI/CF favors the reduction of hydrogen chromate (HCrO4- and H2CrO4). There are two possible reasons for high Cr(VI) removal by PANI/CFs in acidic solutions. One is the bonding with hydrogen chromate and the amine group of the PANI/CFs.58 The other is that the HCrO4- with a higher redox potential (1.33 eV) in acidic solutions can be easily reduced to Cr(III).16
The effect of initial Cr(VI) concentration on the Cr(VI) removal by PANI/CFs was shown in Fig. 3D. It was obvious that 2.75 g L-1 PANI/CFs can completely remove the Cr(VI) with a concentration below 8.0 mg L-1 and pH of 1.0. The removal percentage then decreased with increasing the initial Cr(VI) concentration. It is mainly due to the limitation of active adsorption sites on the surface of PANI/CFs. Also, the high redox potential of solution with high Cr(VI) concentration leads to the degradation of PANI grafted on the surface of CFs,59 which might result in a decreased Cr(VI) removal percentage. However, more than 65% Cr(VI) can be adsorbed by PANI/CFs even when the initial Cr(VI) concentration reaches 56 mg L-1.
| Models | Equation | Parameters | R2 |
|---|---|---|---|
| a Qt is the Cr(VI) uptake amount on the adsorbent at time t, Qe is the adsorption capacity at equilibrium, k1 is the rate constant of pseudo-first-order adsorption. In the pseudo-second-order model, kad is the rate constant of adsorption. | |||
| Pseudo-first-order |  |
k1 (min-1) 0.057 | 0.939 |
| Pseudo-second-order |  |
kad (g mg-1 min-1) 0.06, Qe 10.99 | 0.9973 |
| Isotherms | Langmuir model | Freundlich model | ||||
|---|---|---|---|---|---|---|
| qmax | b | R2 | kf | n | R2 | |
| Values | 18.1 | 0.873 | 0.9890 | 7.24 | 1.08 | 0.8691 |
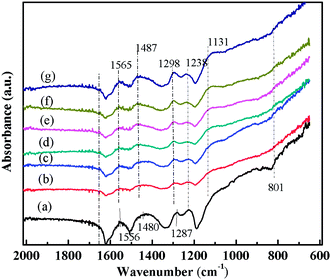 | ||
| Fig. 4 FT-IR spectra of (a) PANI/CFs with 10 wt% PANI, PANI/CFs after treated with Cr(VI) solution for (b) 5, (c) 10, (d) 20, (e) 30, (f) 45 and (g) 60 min, respectively. | ||
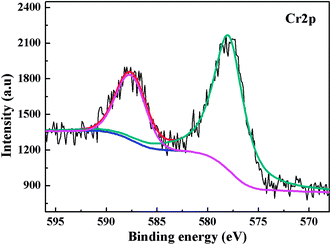 | ||
| Fig. 5 XPS Cr2p spectra on PANI/CFs after the adsorption of Cr(VI) solution with an initial concentration of 48.0 mg L-1 and pH of 1.0. | ||
Different equilibrium models are often used to fit the adsorption behavior of an adsorbent. The equilibrium data for Cr(VI) adsorption by PANI/CFs were fitted by Langmuir64 and Freundlich65 model in this study, respectively. Langmuir isotherm was described as eqn (3):
 | (3) |
Freundlich isotherm is an empirical model that considers heterogeneous adsorptive energies on the absorbent surface, and can be described as eqn (4):
 | (4) |
The PANI/CFs were used to treat the Cr(VI) solution with the Cr(VI) concentration varying from 8.0 to 56.0 mg L-1 at pH 1.0. The fitted results were shown in Table 3. According to the correlation coefficient values, the Langmuir model fits better for Cr(VI) adsorption isotherm, indicating that the Cr(VI) adsorption by PANI/CFs was limited by monolayer coverage.64 This is attributed by the homogeneous distribution of PANI on the surface CFs as confirmed by the SEM observation, Fig. 1. The calculated maximum Cr(VI) adsorption capacity of 18.1 mg g-1 on the PANI/CFs from Langmuir model was a little higher than 15.6 mg g-1 measured with an initial Cr(VI) concentration of 56.0 mg L-1.
3.3 Mechanisms of Cr(VI) removal by PANI/CF
The FT-IR spectra of the PANI/CFs with different treating time were shown in Fig. 4. The main changes were observed in the region from 800 to 1600 cm-1. The peaks at 1556, 1487, 1287 and 1238 cm-1 related to PANI47,51 on the surface of CFs became weaker after treated with Cr(VI). The peak at 801 cm-1 corresponding to the out-of-plane bending of C–H in the benzenoid ring48 disappeared after the adsorption of Cr(VI). The peaks at 1556 and 1480 cm-1 have shifted to 1565 and 1487 cm-1, indicating a stronger interaction between PANI and Cr(VI) adsorbed. A new peak at 1131 cm-1 related to the carbon–nitrogen vibration was observed in the Cr(VI)-adsorbed PANI/CFs, which is consistent with the changes upon oxidation of PANI.16 These indicated that the PANI with EB form on the CFs has been oxidized to PB form by Cr(VI) adsorbed.16The XPS was used to determine the valence state of Cr adsorbed on the PANI/CF. As documented, for Cr2p spectrum, the characteristic binding energy peaks at 577.0–580.0 eV and 586.0–588.0 eV correspond to Cr(III), and the peaks at 580.0–580.5 eV and 589.0–590.0 eV are contributed by Cr(VI).66 Fig. 5 shows the XPS Cr2p spectra of the PANI/CFs treated with 48.0 mg L-1 Cr(VI) solution for 60 min. The binding energy peaks of Cr2p were observed at ~577.5 and 587 eV, indicating that the Cr adsorbed on the surface of PANI/CFs was in the form of Cr(III). Also the peaks had shifted slightly compared with literatures.66 No Cr(VI) was detected on the PANI/CFs by the XPS Cr2p spectra. The result suggested that all the Cr(VI) adsorbed on the surface of PANI/CFs was reduced to Cr(III). The peak of C1s spectra of the Cr(VI)-adsorbed PANI/CFs (Fig. S4(A)†) has been deconvoluted to two major components at 285.5 and 287.7 eV, which are attributed to the C–N and C–O,52 respectively. No obvious difference was observed for the peaks between the PANI/CFs before (Fig. 2B) and after adsorption (Fig. S4(A)†), indicating that the CFs had no contribution for the reduction of Cr(VI) to Cr(III). The peak of N1s spectra of the Cr(VI)-adsorbed PANI/CFs (Fig. S4(B)†) has been deconvoluted to three major components at 398.3, 400.1 and 401.7 eV, which are attributed to amine group, imine group and protonated nitrogen, respectively. The proportion of amine group decreased after treated with Cr(VI), indicating that the amine group had been oxidized by Cr(VI). Generally, the Cr(VI) adsorbed on the PANI/CFs was reduced to Cr(III) by the amine group of PANI, leading to the transformation of PANI from EB form to PB form.67 This result is consistent with the results based on FT-IR (Fig. 5).
The Cr(VI) and total Cr concentrations in the solution and on the PANI/CFs after adsorption were also measured with the initial Cr(VI) concentrations ranging from 0.2 to 2.0 mg L-1. It showed that no Cr(VI) was detected in the solution after adsorption (Fig. 6A(a)), while ~15 µg L-1 of total Cr was detected in solution (Fig. 6A(b)), indicating that there was a little Cr(III) existing in the solution. 20–40 µg L-1 of Cr(VI) were detected on the surface of PANI/CFs (Fig. 6B(a)), however, the concentration is too low to be detected by XPS. High concentrations of the total Cr were detected on the PANI/CFs after oxidized by APS, accounting for more than 90% of the initial concentration in solutions (Fig. 6B(b)). It suggested that the Cr(VI) adsorbed on the PANI/CFs had been completely reduced to Cr(III) and was then adsorbed on the surface of PANI/CFs, which is consistent with the results based on FT-IR (Fig. 4) and XPS (Fig. 5).
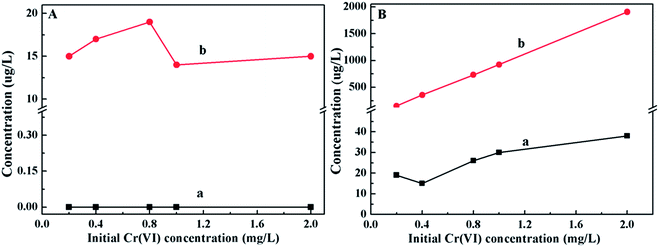 | ||
| Fig. 6 Cr(VI) (a) and total Cr (b) concentrations in the solution (A) and PANI/CFs (B) after adsorption with initial Cr(VI) concentrations ranging from 0.2 to 2.0 mg L-1. | ||
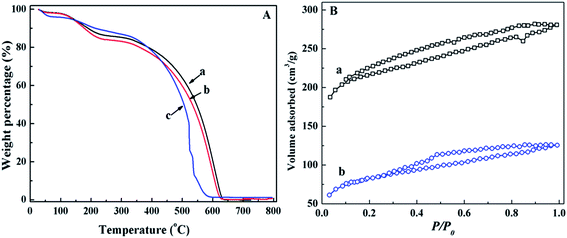
The thermal stability of PANI/CFs after treated with Cr(VI) solution was investigated by TGA (Fig. 7A). A slightly decreased thermal stability was observed with increasing the initial Cr(VI) concentration. As shown in Fig. 7A(b), three-stage weight losses were observed for the PANI/CFs treated with 8.0 mg L-1 Cr(VI) solution. There was an obvious weight loss before 100 °C due to the evaporation of moisture, followed with two-stage weight losses at 175 and 600 °C, which are attributed to the elimination of dopant anions and thermal degradation of PANI.16 There was no obvious difference between the PANI/CFs before and after treated with 8 mg L-1 Cr(VI) solution. However, a significant weight loss was observed at 510 °C for the PANI/CFs treated with 32.0 mg L-1 Cr(VI) solution (Fig. 7A(c)), indicating that solutions with high Cr(VI) concentration affected significantly the stability of PANI/CFs mainly due to the over-oxidation of PANI by Cr(VI).16 It is consistent with the result of XPS that the Cr(VI) was reduced to Cr(III) and the amine group was oxidized after adsorption of Cr(VI).
Fig. 7B showed the nitrogen adsorption–desorption isotherms of PANI/CFs after treated with 4.0 and 12.0 mg L-1 Cr(VI) solution. The specific surface area of the PANI/CFs calculated from BET method (Table 1) decreased with increasing the Cr(VI) concentration. The PANI/CFs with a 10.0% PANI loading treated with 4.0 and 12.0 mg L-1 Cr(VI) had a specific surface area of 829.3 and 305.3 m2 g-1, which are much lower than the as-synthesized PANI/CFs. The pore diameters were calculated by BJH method to be 47.78 and 32.96 Å for the PANI/CFs treated with 4.0 and 12.0 mg L-1 Cr(VI) solution. The PANI coated on the surface of CFs was oxidized by Cr(VI), forming smaller particles and then distributing more homogeneously on the CF surface. It is consistent with the result of a decreased pore diameter. The smaller PANI particles would fill in the pores to occupy the effective area surface and block partial channels within the CFs, leading to a decreased specific surface area.
3.4 Regeneration of PANI/CFs
For practical application, the recycling and regeneration of the adsorbent is indispensable. The CFs can be easily recycled due to their large size. The Cr was desorbed from Cr(VI)-adsorbed PANI/CFs by 0.1 M HCl solution at room temperature.15,68 The regenerated PANI/CFs were used to treat 4.0 mg L-1 Cr(VI) solution (20 mL) for 60 min. The adsorption–desorption was conducted for 5 cycles, and the Cr(VI) removal efficiency was measured (Fig. 8). The removal efficiency was 100% at the first cycle and then slightly decreased to 91.35% at the fifth cycle. The thermal stability of the regenerated PANI/CFs treated with 4.0 mg L-1 Cr(VI) solution was analyzed by TGA (Fig. S5†). No obvious change was observed for the regenerated PANI/CFs except for a little more weight loss at 250 °C compared with the initial PANI/CFs. It suggested that the regenerated PANI/CFs have a good thermal stability, indicating that the PANI/CFs are promising absorbents with high removal efficiency for Cr(VI) and easy regeneration for resuage.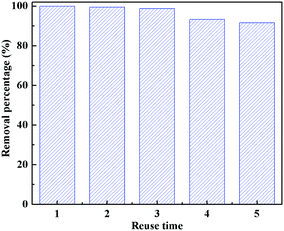 | ||
| Fig. 8 Cr(VI) removal efficiency of the regenerated PANI/CFs after 60 min adsorption. ([Cr(VI)]: 4.0 mg L-1, [PANI/CF]: 55.0 mg, pH: 1.0, treating time: 60 min). | ||
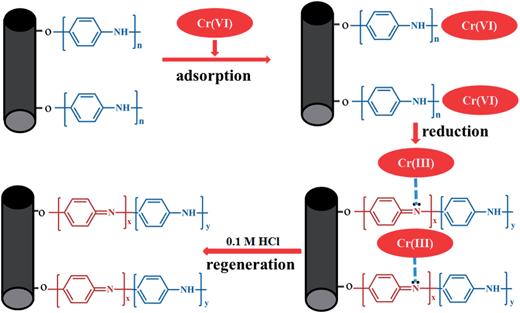
Generally, the proposed pathway of Cr(VI) removal by PANI/CFs was depicted in Fig. 9. The Cr(VI) was initially adsorbed on the surface of PANI/CFs due to the large specific surface area, followed by the reduction of Cr(VI) to Cr(III) by amine groups of PANI coated on the surface of CFs. The Cr(III) was then adsorbed on the surface of PANI/CFs rather than released into the solution. Therefore, it is easy to recover the Cr adsorbed on the adsorbents, and to recycle and to regenerate PANI/CF by 0.1 M HCl solution.
4. Conclusion
The prepared PANI/CFs have demonstrated a great performance for Cr(VI) removal with a PANI loading of 10.0 wt%. These PANI/CFs adsorbents (60 mg) were able to remove 1000 µg L-1 Cr(VI) solution (20 mL) within 15 min. The Cr(VI) adsorption by PANI/CFs was highly dependent on the initial pH and had a higher adsorption capacity at pH 1.0. The Cr(VI) removal percentage decreased with increasing the initial Cr(VI) concentration. The adsorption kinetic was fitted better with pseudo-second-order with a removal rate of 0.06 g mg-1 min-1. A maximum adsorption capacity of 18.1 mg g-1 was calculated following Langmuir model for the PANI/CFs. The Cr(VI) adsorbed was then reduced to Cr(III) by PANI coated on the surface of CFs. The regenerated PANI/CFs by 0.1 M HCl solution exhibited a fairly good performance of Cr(VI) removal, indicating that PANI/CFs are promising adsorbents for effective Cr(VI) removal.Acknowledgements
This project is financially supported by Research Enhancement Grant of Lamar University. Partial supports from Texas Hazardous Waste Research Center (THWRC) and the National Science Foundation-Chemical and Biological Separation under the EAGER program (CBET 11-37441) managed by Dr Rosemarie D. Wesson are acknowledged. B. Qiu acknowledges the support from China Scholarship Council (CSC) program.References
- L. Legrand, A. El Figuigui, F. Mercier and A. Chausse, Environ. Sci. Technol., 2004, 38, 4587–4595 CrossRef CAS.
- C. J. Lin, S. L. Wang, P. M. Huang, Y. M. Tzou, J. C. Liu, C. C. Chen, J. H. Chen and C. Lin, Water Res., 2009, 43, 5015–5022 CrossRef CAS PubMed.
- C. Xu, B. Qiu, H. Gu, X. Yang, H. Wei, X. Huang, Y. Wang, D. Rutman, D. Cao, S. Bhana, Z. Guo and S. Wei, ECS J. Solid State Sci. Technol., 2014, 3, M1–M9 CrossRef CAS PubMed.
- N. Kongsricharoern and C. Polprasert, Water Sci. Technol., 1996, 34, 109–116 CrossRef CAS.
- S. Rengaraj, C. K. Joo, Y. Kim and J. Yi, J. Hazard. Mater., 2003, 102, 257–275 CrossRef CAS.
- Z. Modrzejewska and W. Kaminski, Ind. Eng. Chem. Res., 1999, 38, 4946–4950 CrossRef CAS.
- J. Zhu, S. Wei, H. Gu, S. B. Rapole, Q. Wang, Z. Luo, N. Haldolaarachchige, D. P. Young and Z. Guo, Environ. Sci. Technol., 2011, 46, 977–985 CrossRef PubMed.
- R. Aravindhan, B. Madhan, J. R. Rao, B. U. Nair and T. Ramasami, Environ. Sci. Technol., 2003, 38, 300–306 CrossRef.
- L. C. Hsu, S. L. Wang, Y. C. Lin, M. K. Wang, P. N. Chiang, J. C. Liu, W. H. Kuan, C. C. Chen and Y. M. Tzou, Environ. Sci. Technol., 2010, 44, 6202–6208 CrossRef CAS PubMed.
- Z. Ai, Y. Cheng, L. Zhang and J. Qiu, Environ. Sci. Technol., 2008, 42, 6955–6960 CrossRef CAS.
- Y. Wu, X. Ma, M. Feng and M. Liu, J. Hazard. Mater., 2008, 159, 380–384 CrossRef CAS PubMed.
- D. Zhang, S. Wei, C. Kaila, X. Su, J. Wu, A. B. Karki, D. P. Young and Z. Guo, Nanoscale, 2010, 2, 917–919 RSC.
- S. Wei, Q. Wang, J. Zhu, L. Sun, H. Lin and Z. Guo, Nanoscale, 2011, 3, 4474–4502 RSC.
- J. Zhu, S. Wei, Y. Li, S. Pallavkar, H. Lin, N. Haldolaarachchige, Z. Luo, D. P. Young and Z. Guo, J. Mater. Chem., 2011, 21, 16239–16246 RSC.
- Y. Zhou, X. Hu, M. Zhang, X. Zhuo and J. Niu, Ind. Eng. Chem. Res., 2012, 52, 876–884 CrossRef.
- H. Gu, S. B. Rapole, J. Sharma, Y. Huang, D. Cao, H. A. Colorado, Z. Luo, N. Haldolaarachchige, D. P. Young, B. Walters, S. Wei and Z. Guo, RSC Adv., 2012, 2, 11007–11018 RSC.
- X.-F. Sun, Y. Ma, X.-W. Liu, S.-G. Wang, B.-Y. Gao and X.-M. Li, Water Res., 2010, 44, 2517–2524 CrossRef CAS PubMed.
- N. Melitas, O. Chuffe-Moscoso and J. Farrell, Environ. Sci. Technol., 2001, 35, 3948–3953 CrossRef CAS.
- G. Choppala, N. Bolan, A. Kunhikrishnan, W. Skinner and B. Seshadri, Environ. Sci. Pollut. Res., 2013 DOI:10.1007/s11356-013-1653-6.
- B. Deng and A. T. Stone, Environ. Sci. Technol., 1996, 30, 2484–2494 CrossRef CAS.
- S. T. Farrell and C. B. Breslin, Environ. Sci. Technol., 2004, 38, 4671–4676 CrossRef CAS.
- S. Deng and Y. P. Ting, Environ. Sci. Technol., 2005, 39, 8490–8496 CrossRef CAS.
- L. Önnby, V. Pakade, B. Mattiasson and H. Kirsebom, Water Res., 2012, 46, 4111–4120 CrossRef PubMed.
- P. A. Kumar and S. Chakraborty, J. Hazard. Mater., 2009, 162, 1086–1098 CrossRef CAS PubMed.
- A. Mirmohseni and R. Solhjo, Eur. Polym. J., 2003, 39, 219–223 CrossRef CAS.
- F.-W. Zeng, X.-X. Liu, D. Diamond and K. T. Lau, Sens. Actuators, B, 2010, 143, 530–534 CrossRef CAS PubMed.
- H. Wei, J. Zhu, S. Wu, S. Wei and Z. Guo, Polymer, 2013, 54, 1820–1831 CrossRef CAS PubMed.
- H. Wei, X. Yan, S. Wu, Z. Luo, S. Wei and Z. Guo, J. Phys. Chem. C, 2012, 116, 25052–25064 CAS.
- J. Fang, K. Xu, L. Zhu, Z. Zhou and H. Tang, Corros. Sci., 2007, 49, 4232–4242 CrossRef CAS PubMed.
- A. Olad and R. Nabavi, J. Hazard. Mater., 2007, 147, 845–851 CrossRef CAS PubMed.
- A. G. Yavuz, E. Dincturk-Atalay, A. Uygun, F. Gode and E. Aslan, Desalination, 2011, 279, 325–331 CrossRef CAS PubMed.
- P. Tamilarasan and S. Ramaprabhu, Int. J. Greenhouse Gas Control, 2012, 10, 486–493 CrossRef CAS PubMed.
- M. S. Mansour, M. E. Ossman and H. A. Farag, Desalination, 2011, 272, 301–305 CrossRef CAS PubMed.
- P. A. Kumar, S. Chakraborty and M. Ray, Chem. Eng. J., 2008, 141, 130–140 CrossRef CAS PubMed.
- M.-Q. Yang and Y.-J. Xu, Phys. Chem. Chem. Phys., 2013, 15, 19102–19118 RSC.
- N. Zhang, Y. Zhang and Y.-J. Xu, Nanoscale, 2012, 4, 5792–5813 RSC.
- M. A. A. Zaini, Y. Amano and M. Machida, J. Hazard. Mater., 2010, 180, 552–560 CrossRef CAS PubMed.
- K. C. Kang, S. S. Kim, J. W. Choi and S. H. Kwon, J. Ind. Eng. Chem., 2008, 14, 131–135 CrossRef CAS PubMed.
- M. Arulkumar, K. Thirumalai, P. Sathishkumar and T. Palvannan, Chem. Eng. J., 2012, 185–186, 178–186 CrossRef CAS PubMed.
- D. Mohan, K. P. Singh and V. K. Singh, Ind. Eng. Chem. Res., 2005, 44, 1027–1042 CrossRef CAS.
- J. Liu, L. Wan, L. Zhang and Q. Zhou, J. Colloid Interface Sci., 2011, 364, 490–496 CrossRef CAS PubMed.
- K. Y. Foo and B. H. Hameed, Chem. Eng. J., 2011, 166, 792–795 CrossRef CAS PubMed.
- W. Shen, H. Wang, R. Guan and Z. Li, Colloids Surf., A, 2008, 331, 263–267 CrossRef CAS PubMed.
- J. Jang, J. Bae, M. Choi and S.-H. Yoon, Carbon, 2005, 43, 2730–2736 CrossRef CAS PubMed.
- H. Gu, J. Guo, R. Sadu, Y. Huang, N. Haldolaarachchige, D. Chen, D. P. Young, S. Wei and Z. Guo, Appl. Phys. Lett., 2013, 102, 212403–212404 CrossRef PubMed.
- X. Liu, X. Qian, J. Shen, W. Zhou and X. An, Bioresour. Technol., 2012, 124, 516–519 CrossRef CAS PubMed.
- J. Zhu, S. Wei, L. Zhang, Y. Mao, J. Ryu, A. B. Karki, D. P. Young and Z. Guo, J. Mater. Chem., 2011, 21, 342–348 RSC.
- J. Stejskal, I. Sapurina, M. Trchová and E. N. Konyushenko, Macromolecules, 2008, 41, 3530–3536 CrossRef CAS.
- P. Mavinakuli, S. Wei, Q. Wang, A. B. Karki, S. Dhage, Z. Wang, D. P. Young and Z. Guo, J. Phys. Chem. C, 2010, 114, 3874–3882 CAS.
- M. Mahmoudi, A. Simchi, M. Imani, A. S. Milani and P. Stroeve, J. Phys. Chem. B, 2008, 112, 14470–14481 CrossRef CAS PubMed.
- N. R. Chiou and A. J. Epstein, Adv. Mater., 2005, 17, 1679–1683 CrossRef CAS.
- B. C. Beard and P. Spellane, Chem. Mater., 1997, 9, 1949–1953 CrossRef CAS.
- E. T. Kang, K. G. Neoh and K. L. Tan, Prog. Polym. Sci., 1998, 23, 277–324 CrossRef CAS.
- J. Zhu, S. Wei, L. Zhang, Y. Mao, J. Ryu, N. Haldolaarachchige, D. P. Young and Z. Guo, J. Mater. Chem., 2011, 21, 3952–3959 RSC.
- S. Xuan, Y.-X. J. Wang, K. C.-F. Leung and K. Shu, J. Phys. Chem. C, 2008, 112, 18804–18809 CAS.
- J. Zhu, H. Gu, J. Guo, M. Chen, H. Wei, Z. Luo, H. A. Colorado, N. Yerra, D. Ding, T. C. Ho, N. Haldolaarachchige, D. P. Young, S. Wei, J. Hopper and Z. Guo, J. Mater. Chem. A, 2014, 2, 2256–2265 CAS.
- F. Stoeckli, A. Guillot, A. M. Slasli and D. Hugi-Cleary, Carbon, 2002, 40, 383–388 CrossRef CAS.
- M. R. Samani, S. M. Borghei, A. Olad and M. J. Chaichi, J. Hazard. Mater., 2010, 184, 248–254 CrossRef CAS PubMed.
- A. Mirmohseni and A. Oladegaragoze, J. Appl. Polym. Sci., 2002, 85, 2772–2780 CrossRef CAS.
- S. E. Bailey, T. J. Olin, R. M. Bricka and D. D. Adrian, Water Res., 1999, 33, 2469–2479 CrossRef CAS.
- Y. S. Ho, G. McKay, D. A. J. Wase and C. F. Forster, Adsorpt. Sci. Technol., 2000, 18, 639–650 CrossRef CAS.
- Y. Li, B. Gao, T. Wu, D. Sun, X. Li, B. Wang and F. Lu, Water Res., 2009, 43, 3067–3075 CrossRef CAS PubMed.
- A. E. Nemr, J. Hazard. Mater., 2009, 161, 132–141 CrossRef PubMed.
- E. Álvarez-Ayuso, A. García-Sánchez and X. Querol, Water Res., 2003, 37, 4855–4862 CrossRef PubMed.
- R. Sudha Bai and T. E. Abraham, Bioresour. Technol., 2003, 87, 17–26 CrossRef CAS.
- D. Park, Y.-S. Yun and J. M. Park, J. Colloid Interface Sci., 2008, 317, 54–61 CrossRef CAS PubMed.
- Y. Chen, E. T. Kang, K. G. Neoh, S. L. Lim, Z. H. Ma and K. L. Tan, Colloid Polym. Sci., 2001, 279, 73–76 CAS.
- A. S. K. Kumar, S. Kalidhasan, V. Rajesh and N. Rajesh, Ind. Eng. Chem. Res., 2011, 51, 58–69 CrossRef.
- B. Qiu, C. Xu, D. Sun, H. Yi, J. Guo, X. Zhang, H. Qu, M. Guerrero, X. Wang, N. Noel, Z. Luo, Z. Guo and S. Wei, ACS Sustainable Chem. Eng., 2014 DOI:10.1021/sc5003209.
Footnote |
| † Electronic supplementary information (ESI) available. See DOI: 10.1039/c4ra01700e |
| This journal is © The Royal Society of Chemistry 2014 |

