
 Open Access Article
 This Open Access Article is licensed under a Creative Commons Attribution-Non Commercial 3.0 Unported Licence
A synergistic radical concentration increase in eumelanin–PEDOT:PSS blends: mammalian pigment-based doping for thermopower improvement†
Raffaella Ferraiuolo‡
a,
Carlo Carandente Coscia‡bc,
Maria Grazia Maglionede,
Paolo Tassini de,
Rodolfo Espositobc,
Giuseppe Vitiellocf,
Gerardino D'Erricobc and
Alessandro Pezzella*aegh
de,
Rodolfo Espositobc,
Giuseppe Vitiellocf,
Gerardino D'Erricobc and
Alessandro Pezzella*aegh
aDepartment of Physics “Ettore Pancini”, University of Naples Federico II, via Cinthia 21, I-80126, Naples, Italy. E-mail: alessandro.pezzella@unina.it
bDepartment of Chemical Science, University of Naples Federico II, via Cinthia 21, I-80126, Naples, Italy
cConsorzio Interuniversitario per lo Sviluppo dei Sistemi a Grande Interfase (CSGI), Via della Lastruccia 3, I-50019, Sesto Fiorentino (FI), Italy
dLaboratory of Nanomaterials and Devices (SSPT-PROMAS-NANO) ENEA – C. R. Portici, p.le E. Fermi 1 Loc. Granatello, I-80055, Portici (NA), Italy
eBioelectronics Task Force at University of Naples Federico II, Naples, Italy
fDepartment of Chemical, Materials and Production Engineering, University of Naples Federico II, p.le Tecchio 80, I-80125, Naples, Italy
gNational Interuniversity Consortium of Materials Science and Technology (INSTM), piazza S. Marco 4, I-50121, Florence, Italy
hInstitute for Polymers Composites and Biomaterials (IPCB) CNR, via Campi Flegrei 34, I-80078, Pozzuoli (NA), Italy
First published on 23rd July 2024
Abstract
Moving from a previous investigation of eumelanin and PEDOT:PSS blends we decided to explore the possible contribution of eumelanin to thermopower improvement of PEDOT:PSS in light of the well-known radical character of the mammalian pigment. Determination of the Seebeck coefficient and conductivity showed an effective contribution of eumelanin blending to the PEDOT thermoelectric properties. Notably, these effects correlate with a marked modification of paramagnetic features of both PEDOT and eumelanin after blending. A possible model for the interaction of PEDOT radical cations and eumelanin radical anions is proposed based on the chemical properties of the materials and the fabrication protocol of the blends.
Introduction
The growing diffusion of organic electronic devices is rooted in several factors, ranging from the design and fabrication of new architectures to the development of advanced materials tailored for a wide range of applications in optoelectronics,1 energy storage2 and sensing,3 just to mention a few. Energy conversion can also take advantage of organic materials; for example, thermoelectric devices based on conducting polymers are promising tools for several applications, chiefly self-powered health monitoring devices4 and more generally wearable devices that require conformable substrates.5 In this scenario, valuable thermoelectric conversion imposes strict requirements on the electronic structures of the active organic materials, whose rational design and precise modulation are producing new state-of-the-art thermoelectric devices.6 Indeed, great advancements are emerging by the integration of different conjugated polymers.7 However, the intrinsic semiconducting nature inherent in the macromolecular architecture of common conjugated polymers requires some doping to increase electrical conductivity as well as to optimize thermoelectric performance.2 Therefore, the search for new materials (mainly polymers) featuring tunable properties, possibly by doping with easy-to-handle sustainable additives and by facile protocols, is gaining interest in the field of organic electronics and bioelectronics. In particular, in thermoelectric devices based on conducting polymers (CPs), a side effect of CP doping, to increase electrical conductivity, involves the Seebeck coefficient decrease,8 which is highly undesired for the conversion efficiency.In this perspective, recent observations suggest that the addition of a tailored open-shell system significantly increases the Seebeck coefficient S in a material involving a single species9 as well as allows the systematic manipulation of the thermoelectric properties of non-traditional CP thermoelectric systems, resulting in an optimized power factor above 10 μW m−1 K−2, one of the largest values reported.10 Moreover, a combination of open-shell small molecule dopants and macromolecules bearing stable radical groups is also emerging as a tool to control charge transport, reduce thermal conductivity and enable improved behavior in polymer-based thermoelectric systems.10,11
Eumelanin polymers12 possess an intrinsic radical population13 whose persistence is consistent with stabilization of unpaired electrons via multi-center delocalization within the polyindole backbone.14 This radical population is directly detected and characterized by electron paramagnetic resonance (EPR) spectroscopy.15
Eumelanins are the black-brown subgroup of melanins, the natural nitrogen-containing pigments responsible for the skin and hair pigmentation in mammals and widely distributed throughout the animal kingdom.16 In vivo, the formation of eumelanins is the final outcome of the oxidative metabolism of the amino acid tyrosine (Fig. 1), and in vitro, a number of synthetic protocols have been developed to achieve these pigments by oxidative polymerization, mainly of the indolic precursor 5,6-dihidroxyindole (DHI) and its 2-carboxyl derivative (DHICA).17
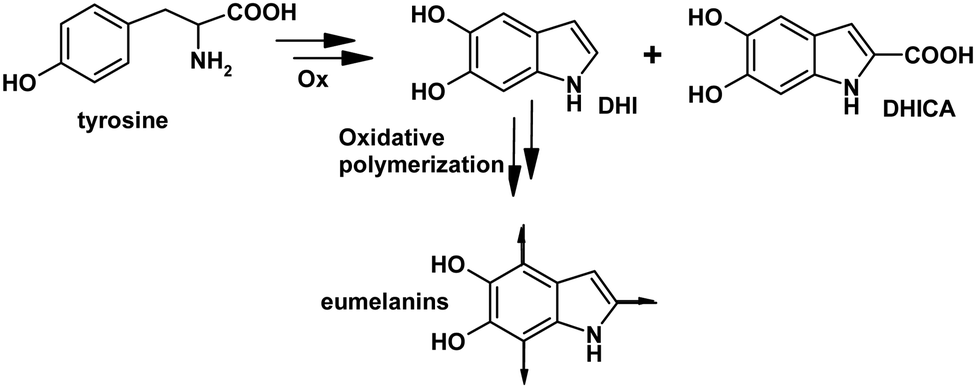 | ||
| Fig. 1 Schematic outline of early steps in eumelanin synthesis. | ||
Beyond its radical polymer nature, melanins also exhibit other peculiar properties, including the broadband UV-vis absorption, the energy dissipating behavior and a mixed ionic/electronic semiconducting response toward charge transport.18,19 This last property first reported by Proctor20 and Powell and Rosenberg21 is at the root of growing interest in the exploitation of these pigments in organic electronics and, given their biocompatibility, in bioelectronics.22,23 In fact, several applications of eumelanin pigments and related materials as electroactive materials have been reported in recent years, including some studies addressing the integration of the eumelanin pigment and PEDOT:PSS.22,24 We have recently proposed and systematically investigated the integration of commercial PEDOT:PSS (PH 1000) and eumelanin pigments prepared by oxidative polymerization of DHI and DHICA to obtain the two blends EuPH25and C-EuPH,26 respectively. Key steps of the PH1000–melanin blends are the dissolution of appropriate amounts of DHI and DHICA in the PH1000 commercial preparation, the deposition of the indole-added PH1000 by spin coating or drop casting, and the melanization of indole precursors by oxidative polymerization into a thin film solid layer.23 The integration of eumelanins in PH1000 produced a marked modification of the structural organization of the PEDOT and PSS chains27 (chiefly) in the films, which is likely connected with the conductivity properties of the blends and even allows the fabrication of an ITO-free OLED.25
Capitalizing on this experience, we combine here the study of the Seebeck coefficient of EuPH blends and the analysis of their EPR profiles, eventually identifying a possible role for eumelanin pigments as radical dopants of PEDOT:PSS for thermoelectric applications.
Results
EuPH thin films were fabricated based on minor modifications of a reported solid state protocol involving the preparation of DHI/PEDOT:PSS mixtures at different weight ratios. The key difference with respect to previously adopted procedures is the use of DMSO rather than isopropyl alcohol to veiculate DHI in PH1000. This choice was made to simplify the procedure where the doping effect of DMSO was not relevant. The mixtures were used to fabricate thin films for chemical, physical and electrical characterization. Drop casting and spin coating were used to obtain the desired films featuring thicknesses in the range of 200–500 nm. To permit straight characterization, films were fabricated on quartz and glass substrates via solid state ammonia-induced oxidative polymerization. Blends with DHI/PEDOT ratios of 25, 50 and 75%, designated as EuPH25, EuPH50 and EuPH75, respectively, were investigated and films of sole DHI–eumelanin and PEDOT:PSS were also prepared for comparison (blanks).Preliminary characterization included UV-vis and surface analysis to confirm the conversion of DHI to eumelanin and to provide information about the contact surface for electrical measurements. In Fig. 2, UV-vis profiles of EuPHs at different weight ratios are reported along with the profiles of sole PEDOT:PSS and eumelanin for comparison.
 | ||
| Fig. 2 UV spectra of (a) DHI–melanin, (b) EuPH75, (c) EuPH50, (d) EuPH25 and (e) PEDOT:PSS thin films on quartz. Absorbances are normalized to the thickness. | ||
The surface analysis of the thin films was carried out by AFM for the samples intended for electrical measurements. The films were prepared by drop casting and inspected in tapping mode imaging to obtain both topographical and phase images (Fig. S3, ESI†). The films with a low content of eumelanin exhibit a decrease in the surface roughness compared to the sole PEDOT:PSS film or the sole eumelanin film. No relevant roughness variation could be noted with the eumelanin content variation in the blends.
For thermoelectric property measurements, a Linseis thin film analyser system was used for the determination of both the electrical conductivity σ and the Seebeck coefficient S. From the measurements of these quantities, the thermopower S2σ was also calculated to estimate the efficiency of the thermoelectric conversion. Details of the experimental procedure are reported in the ESI;† in brief, thin films of blanks and blends were mounted on a holder equipped with electrodes and a temperature sensor.
Consistent with previous studies,25 the conductivity of the blends decreased with the eumelanin content (Fig. 3, top panel), while the blanks values were 750 and 4.5 × 10⁻⁵ Siemens per centimeter for the sole PEDOT:PSS and DHI–melanin, respectively. At the same time, the Seebeck coefficient showed an increase with the eumelanin content in the blends containing PEDOT:PSS, although the growth profile did not follow the eumelanin content but asymptotically reached a value of 23 μV K−1 in EuPH75 (Fig. 3, top panel).
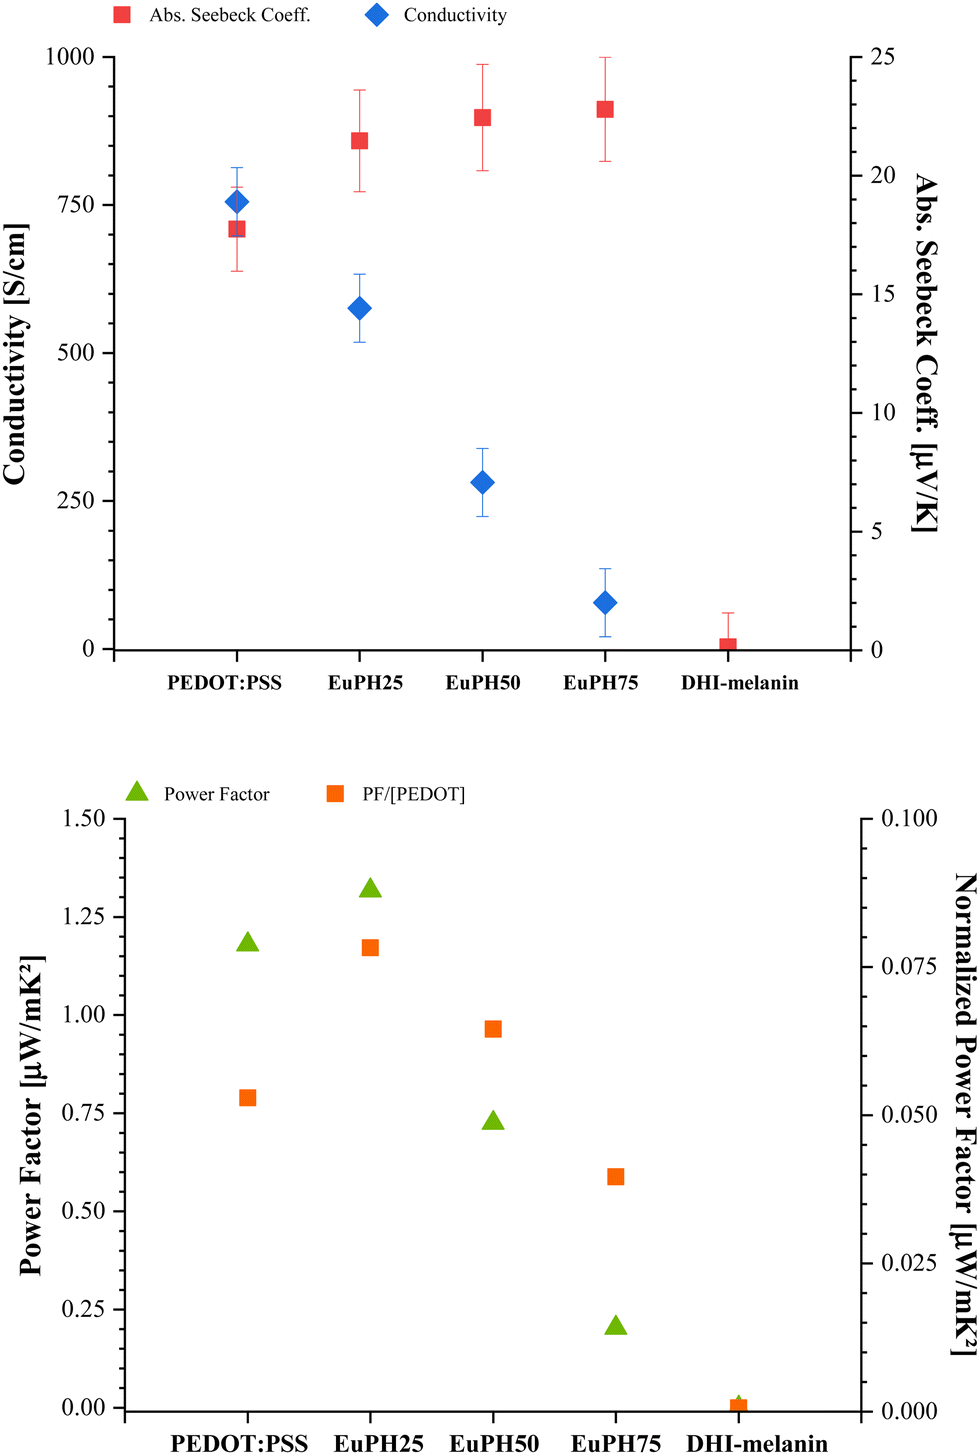 | ||
| Fig. 3 Top panel: Seebeck coefficient (left axis) and conductivity (right axis). Bottom panel: power factor (left axis) and power factor normalized to the PEDOT content (right axis). | ||
To evaluate the improvement of the thermoelectric response of the blends, the power factor (PF) was reported as a function of the eumelanin content, showing an optimal value for EuPH25, and when the PF is normalized to the PEDOT content, EuPH50 also showed a higher value than that of the sole PEDOT:PSS (Fig. 3, bottom panel).
In order to investigate whether and to what extent the properties discussed above are correlated with the configuration and delocalization of free electrons in the polymer molecules present in the samples, an EPR investigation was undertaken. A CW X-band spectrometer was used to record the spectra of the samples. The spectrum of the PEDOT:PSS sample treated with ammonia vapors shows a broad, slightly asymmetric singlet resulting from the quinoid configuration of conjugated π-bonds,28 at a g-value of 2.0023 ± 0.0002, corresponding to that of free electrons (the black line in Fig. 4). The large peak-to-peak distance value (ΔB) indicates a statistical distribution of the radicals and their wide delocalization29 along the conjugated aromatic system. Line shape analysis of this signal reveals a fair agreement with a Lorentzian profile, which is related to the high mobility of electrons. In fact, a better fit of the spectrum is obtained by using a Dysonian line shape, which is typical of conducting samples.30 The ammonia treatment step (described in the Experimental section) resulted in no significant change of the spectral features, see the ESI.† As previously reported for PEDOT samples, the area of the absorption spectrum (i.e., the double integral of the experimental derivative spectrum) increases with the microwave power without evidence of saturation (Fig. 5).31
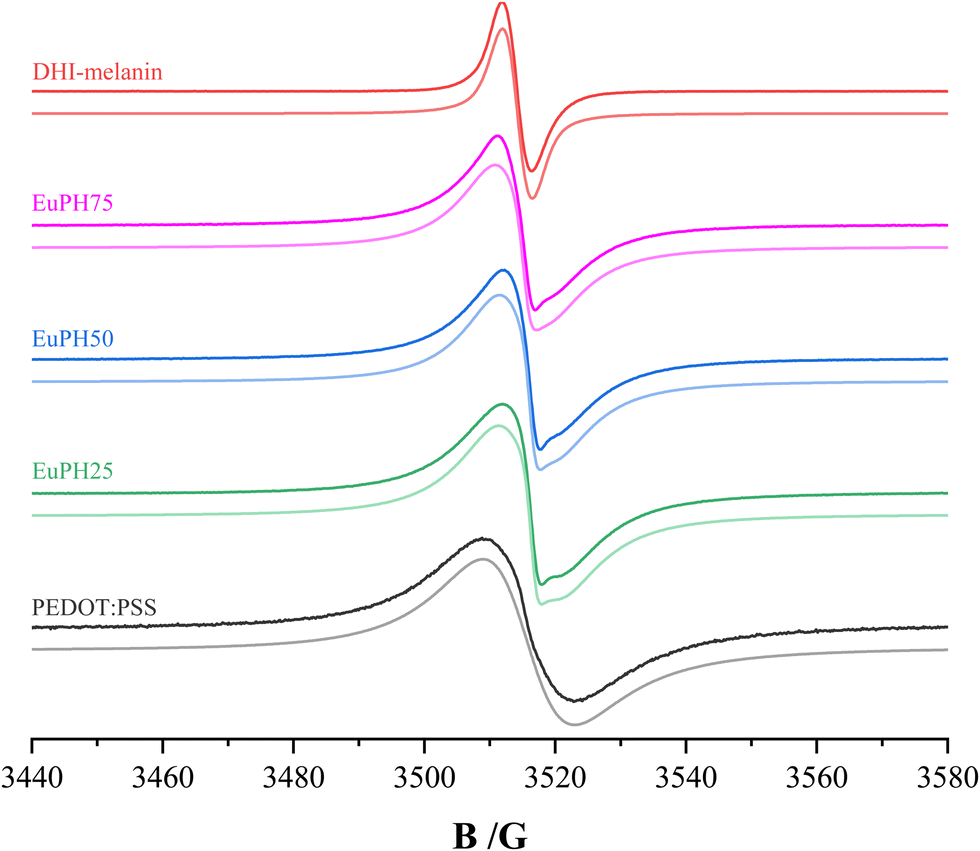 | ||
| Fig. 4 EPR spectra of DHI–melanin, EuPH75, EuPH50, EuPH25, and PEDOT:PSS. Darker lines represent the experimental spectra and lighter lines represent the best fit. | ||
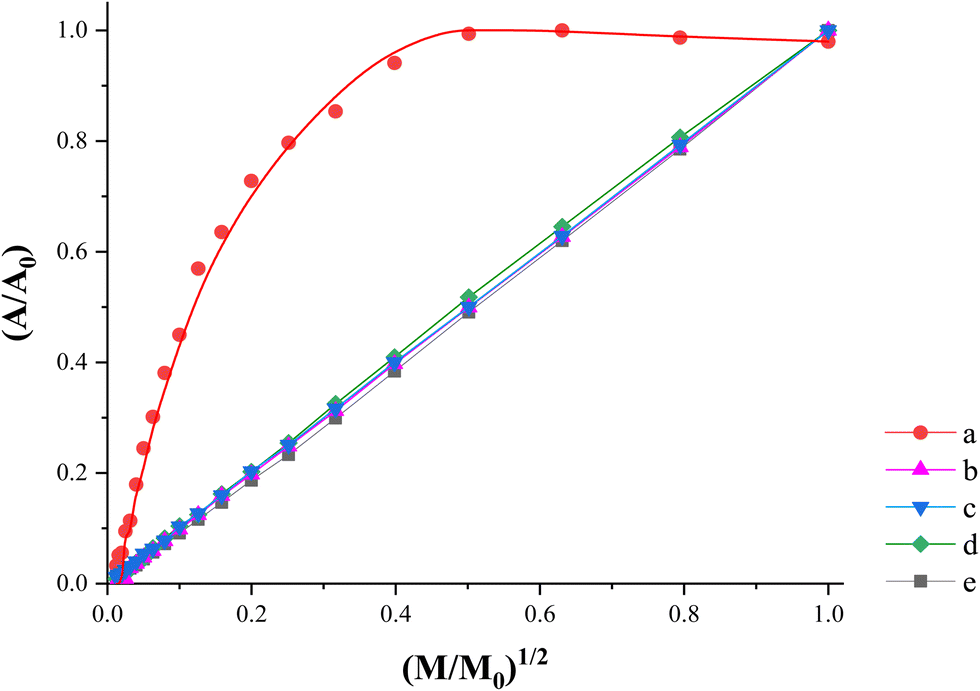 | ||
| Fig. 5 Power saturation curves corresponding to (a) DHI–melanin, (b) EuPH75, (c) EuPH50, (d) EuPH25 and (e) PEDOT:PSS. | ||
On the other hand, the spectrum of the DHI–melanin sample (red line in Fig. 4) shows a relatively narrow singlet at a slightly higher g-value (2.0035 ± 0.0002). This spectrum is satisfactorily fitted with a Lorentzian line shape and only a limited fit improvement is obtained by using a Voight line shape (combination of Lorentzian and Gaussian curves), suggesting the presence of weakly interacting spin systems with weak exchange interactions.32 A detailed analysis of DHI–melanin spectra was performed by Paulin et al.,13 who found the coexistence of three components, two of which are carbon-centered radicals and the third is the semiquinone free radical. In our sample, the results indicate the prevalence of a single species which, considering the g-value, is a carbon-centered one. Unlike PEDOT:PSS, the signal intensity reaches a maximum with the increasing microwave power, above which it decreases slightly (Fig. 5).33
The spectra of the blends (dark lines for EuPH75, EuPH50, and EuPH25 in Fig. 4) show the superposition of the signals due to PEDOT and DHI–melanin. Spectra analysis was performed using the Bruker X-EPR software. The best fit of the spectra, shown as light lines in Fig. 4, was obtained by adding a broad Dyson line due to the PEDOT and a relatively narrow line due to the melanin (see ESI†). Interestingly, all our attempts to use a Lorentz or Voight line for the latter signal resulted in an unsatisfactory fit to the experimental spectrum. A good fit was obtained only by using a Dysonian line shape also for the melanin contribution. This evidence suggests a strong influence of the PEDOT on the electron features of the melanin in the blends whose EPR spectrum becomes similar to those found for conducting polymers. Details of the two signals whose sum gives the best fit are reported in Table 1. The ratio between the double integrated area of the two contributions shows that a strong increase of the DHI content in the sample does not lead to a similar increase of the DHI–melanin contribution to the EPR signal: increasing from 25 to 75% of the DHI content results in an increase of the melanin contribution from 9 to 12%. Although the variation of the component contributions is limited, the quantitative analysis of the spectral features shows clear trends: the PEDOT signal remains fixed at a constant g-value, but its width, in terms of the ΔB value, decreases with the increasing melanin content. At the same time, as the PEDOT contribution increases, the g-value of the DHI–melanin gradually decreases and tends to assume the value typical of free electrons, and the ΔB value also decreases.
| Sample | %PEDOT | g-Factor | ΔB (G) | Radical concentration × 10−18 (spin per g) |
|---|---|---|---|---|
| %DHI–melanin | ||||
| DHI–melanin | 2.0035 | 4.5 | 1.8 | |
| EuPH75 | 88% | 2.0023 | 9.2 | 6.1 |
| 12% | 2.0031 | 2.9 | ||
| EuPH50 | 89% | 2.0023 | 9.4 | 17 |
| 11% | 2.0026 | 2.6 | ||
| EuPH25 | 91% | 2.0023 | 10 | 8.7 |
| 9% | 2.0025 | 2.5 | ||
| PEDOT:PSS | 2.0023 | 14 | 6.9 | |
Table 1 also shows the concentrations of unpaired electrons in the systems, expressed as the number of radicals per gram of the sample. These values, obtained by double integration of the experimental derivative signal in the presence of a standard as reported in the Experimental section, are usually subjected to a large uncertainty. To make the situation even more difficult, this parameter strongly depends on the sample hydration, as discussed in detail for melanin signals.34 To increase the reliability of the experimental values, for all the systems studied, we repeated the determination on three independently prepared samples and checked whether the water content in the samples was within a narrow range of variability for all of them (see the Experimental section). Thanks to all these precautions, we estimate that the uncertainty of the quoted values does not exceed 30%. The values reported in Table 1 show that the radical concentrations in the blends are higher than those found for the single component, thus indicating a synergistic effect between PEDOT and DHI–melanin in radical stabilization.
Finally, in the power saturation curves (Fig. 5) obtained by plotting the normalized area of the absorption spectrum as a function of the square root of the microwave power, the PEDOT contribution predominates and the curves show a monotonically increasing trend, which is completely different from that of pure DHI–melanin, appropriate for the free radical species with long relaxation times.
Discussion
In order to investigate the possible exploitation of eumelanin for the thermopower improvement of PEDOT:PSS blends and the possible link between the eumelanin radical content and the electrical properties of EuPHs, we looked for correlations between the electrical and EPR data of the blends with different relative eumelanin contents, starting from the analysis of sole eumelanin and PEDOT:PSS.The EPR profile of PEDOT:PSS is reported in several studies and is characterized by a large peak-to-peak distance value (ΔB) due to the radical wide delocalization.29 In EuPHs, after the introduction of eumelanin, the linewidth of EPR lines is affected by the magnetic interaction between paramagnetic centers in the sample28 resulting in a signal narrowing,29 (Fig. 4) likely ascribed to increased interactions that reduce radical delocalization. It may be argued that ionic pairing between the positive charges of PEDOT and the negative charges of phenoxy semiquinones within the eumelanin backbone can result in some obstacles to radical delocalization, as radicals and ions in the polymers are linked in the π system (Fig. 6).
 | ||
| Fig. 6 Schematic outline of possible interactions between PEDOT polarons and indole semiquinone anions. Polaron generation after oxidative doping and semiquinone deprotonation after pH increase are shown. | ||
Notably, the signal narrowing pairs with the increase of the radical concentration (Table 1), a finding that further supports the model of PEDOTn+–eumelaninm− pairing. Indeed, the (phenol + quinone)/semiquinone equilibrium in eumelanin is pH sensitive35 as the acidity of the phenoxy form is increased with respect to that of the phenol form (Fig. 7).36
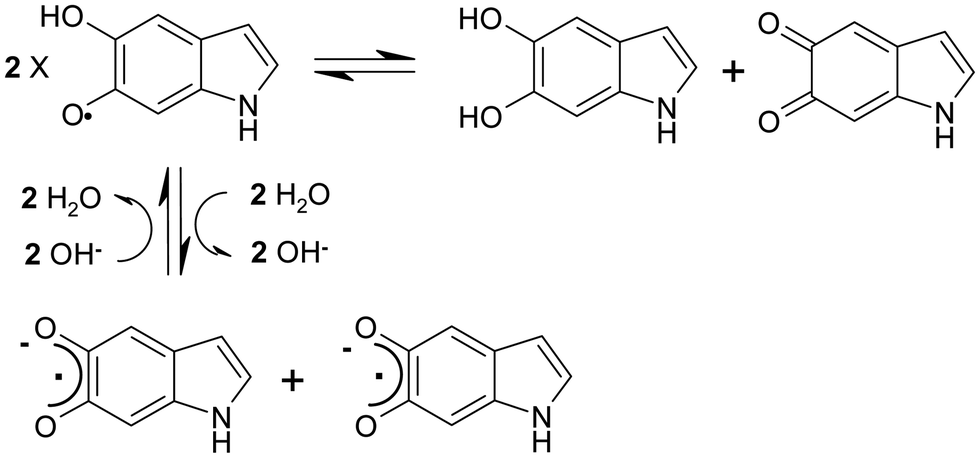 | ||
| Fig. 7 Indole semiquinone redox equilibrium and pH dependent ionization. | ||
Since the EuPH preparation protocol involves exposure to ammonia vapors, the resulting increase in thin film pH shifts the redox equilibrium of the indole semiquinone toward the comproportionation, which in turn leads an increase in the radical concentration in the semiquinone deprotonated anionic form.
Radicals in PEDOT are produced after the oxidative doping of the polymer (Fig. 6), which is mandatory to achieve high conductivity levels,37 and are considered to be associated with the formation of polarons whose charge is stabilized to some extent by the anionic groups of PSS. This picture is partially modified by the introduction of eumelanin, which is formed in situ after the polymerization of small DHI units dispersed in the PEDOT:PSS mixture and, according to the X ray data from previous studies,27 intercalates between the PEDOT and the PSS. This intimate mixing is also supported here by the lack of relevant variations in the phase images of AFM, which allows to assume homogeneity of the film bulk properties, thus supporting the affordability of macroscopic measurements/characterization of the films.
Such proximity can be invoked in a possible model for the blending-induced increase in the radical concentration. Indeed, the positive charges of polarons can pair with the anionic conjugate base of radical semiquinone moieties in eumelanin polymers and in turn favor the redox comproportionation of catechol and quinone units.35 This dynamics is similar to the pH-induced quinone-indole comproportionation35 but is not (or not only) due to the effect of the basic nature of ammonia, but also due to the driving force provided by the charge pairing.
Both these effects are expected to operate in EuPHs as a consequence of the chemical nature of the components and the fabrication protocol and can provide a solid model to justify the measured properties. Indeed, if we plot the radical concentration vs. the Seebeck/conductivity ratio (Fig. 8), we can observe some similarities in the trends, suggesting a possible direct contribution of eumelanin doping to the thermoelectric properties of PEDOT.
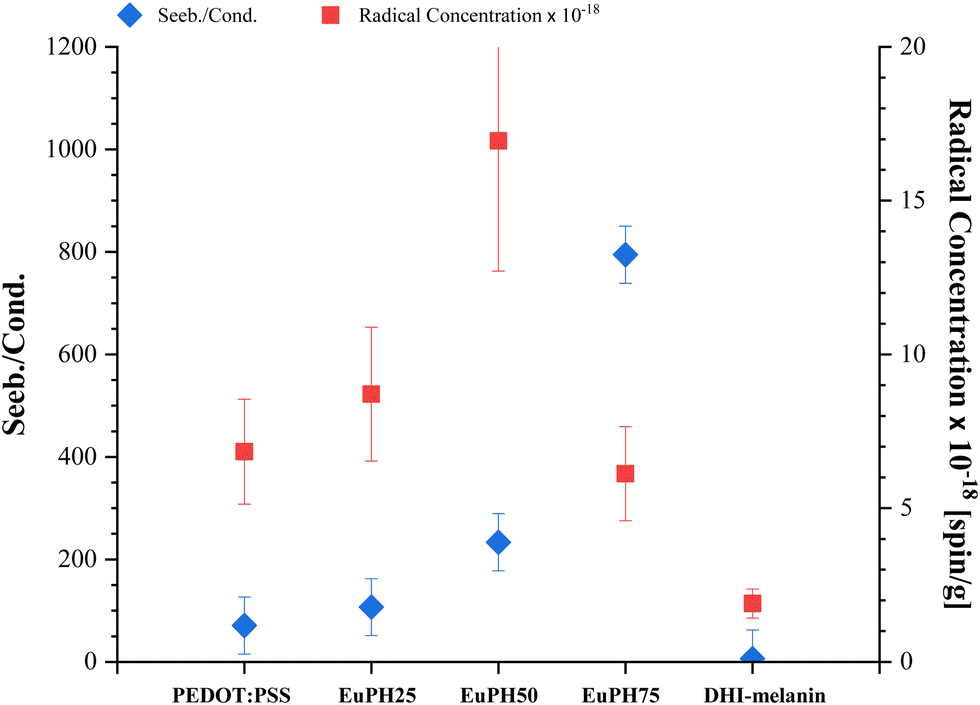 | ||
| Fig. 8 Seebeck over conductivity ratio (left axis) and radical concentration (right axis). | ||
Conclusions
The chemical properties of the semiquinone moieties within the eumelanin backbone allowed expanding the literature applications of radical species for the thermopower enhancement of conducting polymers. The pH dependence of semiquinone redox equilibrium combined with the acidity of the polymer resulted in a synergistic increase in the radical concentration in EuPH blends, a parameter that appears to correlate with the Seebeck coefficient and the improvement in the PEDOT thermopower. Based on knowledge of the materials chemistry and EPR investigation of the blends, a model was proposed that invokes the interaction between PEDOT radical cations and eumelanin radical anions as the underlying observed synergism. Although more systematic investigations need to be designed and carried out before a quantitative model can be defined, this study disclosed how eumelanin can play a role in modulating the Seebeck coefficient vs. conductivity in PEDOT-based conductive materials and opens an entirely new scenario for the application of a natural biocompatible product in organic electronics for energy conversion.Experimental section
More details concerning materials and methods are reported in the ESI.†Film preparation and EPR measurements
EuPH thin films were prepared by spin coating the corresponding mother solution containing DHI and PEDOT:PSS. DHI/(PEDOT:PSS) mother solutions, at ratios of 0.25/0.75, 0.5/0.5 and 0.75/0.25 w/w, were obtained by mixing two solutions: (a) DHI in isopropyl alcohol (8 mg mL−1) and (b) PEDOT:PSS in water (a Clevios™ PH 1000 commercial product featuring 1–1.3% weight content of polymers, with a PEDOT![[thin space (1/6-em)]](https://www.rsc.org/images/entities/char_2009.gif) :PSS ratio of 1:2.5).38 To enhance the conductivity of the pristine PEDOT:PSS, 5% DMSO was added to PH 1000.38 Prior to use, the solutions were vortexed in an oxygen-free atmosphere, filtered through a 0.45 μm Whatman membrane, and spin-coated on quartz substrates using a Laurell WS-650MZ-23NPP/LITE spin coater. After drying and annealing (80 °C for 10′ on a hot plate in air), the resulting film thicknesses, measured with a KLA Tencor P-10 surface profiler, were in the range of 100–150 nm. Once prepared, the layers were subjected to the ammonia-induced solid state polymerization (AISSP) protocol23 to finally obtain the desired EuPH thin film by exposing the DHI-PEDOT:PSS films for 1 h to air-equilibrated gaseous ammonia from an ammonia solution (28% in water) inside a sealed chamber at 1 atm pressure and at a controlled temperature (25–40 °C). The film of sole PEDOT:PSS was subjected to the same treatment as a control.
:PSS ratio of 1:2.5).38 To enhance the conductivity of the pristine PEDOT:PSS, 5% DMSO was added to PH 1000.38 Prior to use, the solutions were vortexed in an oxygen-free atmosphere, filtered through a 0.45 μm Whatman membrane, and spin-coated on quartz substrates using a Laurell WS-650MZ-23NPP/LITE spin coater. After drying and annealing (80 °C for 10′ on a hot plate in air), the resulting film thicknesses, measured with a KLA Tencor P-10 surface profiler, were in the range of 100–150 nm. Once prepared, the layers were subjected to the ammonia-induced solid state polymerization (AISSP) protocol23 to finally obtain the desired EuPH thin film by exposing the DHI-PEDOT:PSS films for 1 h to air-equilibrated gaseous ammonia from an ammonia solution (28% in water) inside a sealed chamber at 1 atm pressure and at a controlled temperature (25–40 °C). The film of sole PEDOT:PSS was subjected to the same treatment as a control.
CW EPR measurements were conducted using an X-band Bruker Elexys E-500 spectrometer that was equipped with a highly sensitive probe head. As humidity is known to affect signals,39 films were scraped from substrates, manually ground to powder, and equilibrated for at least 1 h in a laboratory with a controlled temperature (25 ± 2 °C) and relative humidity (70 ± 5%). This procedure resulted in samples with approximately the same water content (see Fig. S6, ESI†) not exceeding 10%. Then, the samples were placed in flame-sealed glass capillaries, which were inserted into a standard 4 mm quartz sample tube. The measurements were performed at room temperature with specific instrument settings: a sweep width of 140 G, a resolution of 1024 points, a modulation amplitude of 1.0 G, a conversion time of 20.5 ms, and a time constant of 10.24 ms. The field modulation amplitude was preliminarily checked to avoid signal overmodulation. The microwave power was optimized to avoid saturation of the resonance absorption curve. In power saturation experiments, the microwave power was gradually increased from 0.001 to 127 mW. The signal line width, known as ΔB, was calculated as the peak-to-peak distance of the first derivative signal, while the g-factor and spin concentration parameters were determined using an internal standard, Mn2+-doped MgO, a weighted amount of which, sealed in a capillary, was introduced into the quartz tube alongside the capillary containing the sample.40,41 By repeating the measurements for each system considered on three independently prepared samples, uncertainties of 30% were estimated for the radical concentration and 3 × 10⁻⁴ for the g-factor value.
Data availability
The data supporting this article have been included as part of the ESI.†Conflicts of interest
There are no conflicts to declare.Acknowledgements
Financial support from the ENEA (Italian Project RdS_PTR22-24 – CUP I53C22003040001), the PNRR project Pathogen Readiness Platform for CERIC-ERIC Upgrade, and the PNRR NEST – Network 4 Energy Sustainable Transition is acknowledged.References
- A. Khasbaatar, Z. Xu, J.-H. Lee, G. Campillo-Alvarado, C. Hwang, B. N. Onusaitis and Y. Diao, Chem. Rev., 2023, 123, 8395–8487 CrossRef CAS.
- P. Sang, Q. Chen, D.-Y. Wang, W. Guo and Y. Fu, Chem. Rev., 2023, 123, 1262–1326 CrossRef CAS PubMed.
- A. Koklu, D. Ohayon, S. Wustoni, V. Druet, A. Saleh and S. Inal, Chem. Rev., 2022, 122, 4581–4635 CrossRef CAS PubMed.
- M. Wu, K. Yao, D. Li, X. Huang, Y. Liu, L. Wang, E. Song, J. Yu and X. Yu, Mater. Today Energy, 2021, 21, 100786 CrossRef.
- Z. Yan, S. Luo, Q. Li, Z.-S. Wu and S. Liu, Adv. Sci., 2024, 11, 2302172 CrossRef CAS PubMed.
- X. Dai, Q. Meng, F. Zhang, Y. Zou, C.-A. Di and D. Zhu, J. Energy Chem., 2021, 62, 204–219 CrossRef CAS.
- A. B. Mostert, S. B. Rienecker, M. Sheliakina, P. Zierep, G. R. Hanson, J. R. Harmer, G. Schenk and P. Meredith, J. Mater. Chem. B, 2020, 8, 8050–8060 RSC.
- M. Culebras, B. Uriol, C. M. Gómez and A. Cantarero, Phys. Chem. Chem. Phys., 2015, 17, 15140–15145 RSC.
- J. Hurtado-Gallego, S. Sangtarash, R. Davidson, L. Rincón-García, A. Daaoub, G. Rubio-Bollinger, C. J. Lambert, V. S. Oganesyan, M. R. Bryce, N. Agraït and H. Sadeghi, Nano Lett., 2022, 22, 948–953 CrossRef CAS.
- Y. Joo, L. Huang, N. Eedugurala, A. E. London, A. Kumar, B. M. Wong, B. W. Boudouris and J. D. Azoulay, Macromolecules, 2018, 51, 3886–3894 CrossRef CAS.
- E. P. Tomlinson, M. J. Willmore, X. Zhu, S. W. A. Hilsmier and B. W. Boudouris, ACS Appl. Mater. Interfaces, 2015, 7, 18195–18200 CrossRef CAS.
- M. D'Ischia, A. Napolitano, A. Pezzella, P. Meredith and T. Sarna, Angew. Chem., Int. Ed., 2009, 48, 3914–3921 CrossRef.
- J. V. Paulin, A. Batagin-Neto and C. F. O. Graeff, J. Phys. Chem. B, 2019, 123, 1248–1255 CrossRef CAS PubMed.
- P. Manini, V. Lino, G. D'Errico, S. Reale, A. Napolitano, F. De Angelis and M. d'Ischia, Polym. Chem., 2020, 11, 5005–5010 RSC.
- J. V. Paulin, C. F. O. Graeff and A. B. Mostert, Mater. Adv., 2024, 5, 1395–1419 RSC.
- M. D'Ischia, K. Wakamatsu, A. Napolitano, S. Briganti, J. C. Garcia-Borron, D. Kovacs, P. Meredith, A. Pezzella, M. Picardo, T. Sarna, J. D. Simon and S. Ito, Pigm. Cell Melanoma Res., 2013, 26, 616–633 CrossRef PubMed.
- M. d'Ischia, A. Napolitano, A. Pezzella, P. Meredith and M. Buehler, Angew. Chem., Int. Ed., 2020, 59, 11196–11205 CrossRef PubMed.
- J. V. Paulin, S. Bayram, C. F. O. Graeff and C. C. B. Bufon, ACS Appl. Bio Mater., 2023, 6, 3633–3637 CrossRef CAS.
- A. B. Mostert, B. J. Powell, F. L. Pratt, G. R. Hanson, T. Sarna, I. R. Gentle and P. Meredith, Proc. Natl. Acad. Sci. U. S. A., 2012, 109, 8943–8947 CrossRef CAS PubMed.
- J. McGinness, P. Corry and P. Proctor, Science, 1974, 183, 853–855 CrossRef CAS.
- M. R. Powell and B. Rosenberg, J. Bioenergy, 1970, 1, 493–509 CrossRef CAS.
- N. L. Nozella, J. V. M. Lima, R. F. de Oliveira and C. F. D. O. Graeff, Mater. Adv., 2023, 4, 4732–4743 RSC.
- A. Pezzella, M. Barra, A. Musto, A. Navarra, M. Alfè, P. Manini, S. Parisi, A. Cassinese, V. Criscuolo and M. D'Ischia, Mater. Horiz., 2015, 2, 212–220 RSC.
- M. Sheliakina, A. B. Mostert and P. Meredith, Mater. Horiz., 2018, 5, 256–263 RSC.
- L. Migliaccio, S. Aprano, L. Iannuzzi, M. G. Maglione, P. Tassini, C. Minarini, P. Manini and A. Pezzella, Adv. Electron. Mater., 2017, 3 Search PubMed.
- L. Migliaccio, F. Gesuele, P. Manini, M. G. Maglione, P. Tassini and A. Pezzella, Materials, 2020, 13 Search PubMed.
- L. Migliaccio, D. Altamura, F. Scattarella, C. Giannini, P. Manini, F. Gesuele, M. G. Maglione, P. Tassini and A. Pezzella, Adv. Electron. Mater., 2019, 5 Search PubMed.
- A. Zykwinska, W. Domagala and M. Lapkowski, Electrochem. Commun., 2003, 5, 603–608 CrossRef CAS.
- A. k Anbalagan, S. Gupta, M. Chaudhary, R. R. Kumar, Y.-L. Chueh, N.-H. Tai and C.-H. Lee, RSC Adv., 2021, 11, 20752–20759 RSC.
- J. P. Joshi and S. V. Bhat, J. Magn. Reson., 2004, 168, 284–287 CrossRef CAS.
- W. Domagala, B. Pilawa and M. Lapkowski, Electrochim. Acta, 2008, 53, 4580–4590 CrossRef CAS.
- L. Panzella, G. Gentile, G. D’Errico, N. F. Della Vecchia, M. E. Errico, A. Napolitano, C. Carfagna and M. d'Ischia, Angew. Chem., Int. Ed., 2013, 52, 12684–12687 CrossRef CAS.
- L. Panzella, G. D’Errico, G. Vitiello, M. Perfetti, M. L. Alfieri, A. Napolitano and M. d’Ischia, Chem. Commun., 2018, 54, 9426–9429 RSC.
- A. B. Mostert, G. R. Hanson, T. Sarna, I. R. Gentle, B. J. Powell and P. Meredith, J. Phys. Chem. B, 2013, 117, 4965–4972 CrossRef CAS PubMed.
- S.-S. Chio, J. S. Hyde and R. C. Sealy, Arch. Biochem. Biophys., 1982, 215, 100–106 CrossRef CAS PubMed.
- A. Pezzella, O. Crescenzi, L. Panzella, A. Napolitano, E. J. Land, V. Barone and M. d’Ischia, J. Am. Chem. Soc., 2013, 135, 12142–12149 CrossRef CAS PubMed.
- I. Zozoulenko, A. Singh, S. K. Singh, V. Gueskine, X. Crispin and M. Berggren, ACS Appl. Polym. Mater., 2019, 1, 83–94 CrossRef CAS.
- Y. Xia and J. Ouyang, ACS Appl. Mater. Interfaces, 2012, 4, 4131–4140 CrossRef CAS PubMed.
- J. V. Paulin, A. P. Coleone, A. Batagin-Neto, G. Burwell, P. Meredith, C. F. O. Graeff and A. B. Mostert, J. Mater. Chem. C, 2021, 9, 8345–8358 RSC.
- F. Amantea, G. Antignani, G. Pota, E. Cascone, S. Parisi, M. Alfè, V. Gargiulo, G. Luciani, A. Pezzella, G. D'Errico, R. Di Capua and G. Vitiello, Appl. Surf. Sci., 2023, 633, 157608 CrossRef CAS.
- F. Furlani, G. Pota, A. Rossi, G. Luciani, E. Campodoni, F. Mocerino, G. D’Errico, A. Pezzella, S. Panseri, G. Vitiello and M. Sandri, Colloids Surf., B, 2024, 235, 113756 CrossRef CAS PubMed.
Footnotes |
| † Electronic supplementary information (ESI) available. See DOI: https://doi.org/10.1039/d4ma00339j |
| ‡ These authors equally contributed to this work. |
| This journal is © The Royal Society of Chemistry 2024 |